

1 Introduction
Stochastic events such as climatic change can lead to the differentiation of a genetic lineage through isolation, the absence of gene flow, genetic drift, or selective pressure [1,2]. Natural selection allows genetic traits favouring survival and reproduction of the species to become more frequent in the population [3], in such a way that the lineage can succeed to preserve itself in an isolated territory by means of population adaptation [4]. Another evolutionary factor allowing speciation is the founder effect [5], with which a very small number of individuals colonises a new environment. From this bottleneck, through successive generations, isolation and genetic drift allow a new species to be created [6].
In the context of phylo-geographical studies, barbels represent a highly interesting model, as a result of their huge genetic diversity, their ecology and their adaptability [7–14].
Within the Barbus sensu stricto group, two different lineages can be distinguished: Barbus Cuvier, 1817, and Luciobarbus Heckel, 1843. The fossils of the latter genus have been documented [9] and should allow one to estimate its rate of evolution and to calibrate the historical events having led to its genetic differentiation. Some data are already available, especially on the evolution of Luciobarbus during the Upper Miocene transgression (8–10 Myr) [9,15], and on the current geographic distribution following the Messinian salinity crisis (∼5 Myr) [16]. Some North African fishes belonging to this genus, such as Saharan barbels, represent an interesting group for studying the genetic patterns of populations [11]. Saharan rivers such as the Ziz wadi (Morocco), the Guir wadi (Morocco and Algeria), and the Abiod wadi (Algeria) are relatively isolated geographic areas: their water streams infiltrate and disappear into the sands of the Sahara.
Between the Guir wadi, which runs down from the High Atlas (Morocco) and its confluence with the Zousfana River, the Saoura wadi runs across the south-west of the Algerian western Sahara, and then flows towards the Adrar oasis (Touat, Algeria). However, the connection between the upstream and downstream sections of the Guir appears to be interrupted, and the fish populations of these habitats seem to have been separated from each other by a distance of approximately 300 km. As a consequence, the barbel populations in the Adrar region are disconnected from the original hydrographic system, and thus live under insular-type conditions.
The underground worlds of foggaras1 seem barely suitable for life. Nevertheless, the ecological and evolutionary features associated with the insular structure of these specific habitats in the Sahara can create lineages evolving independently [17,18]. There, the barbel, Luciobarbus pallaryi, has succeeded to prosper, providing evidence of remarkable adaptation, in terms of its behaviour and reproductive mode. This species began to reproduce during the juvenile phase (personal observation). This early maturation phenomenon is known as neoteny [19].
Over the last 2.5 million years, in accordance with climatic fluctuations of the Quaternary [20], the Earth's species have indeed been subjected to numerous contractions and expansions of their areas of distribution [21]. Although the influence of these climatic variations on the genetic diversity of species has been very well documented for the case of temperate climates [22–24], the influence of repeated, alternating glacial/interglacial cycles during the Quaternary, on the specific diversity of Saharan ecosystems, remains poorly understood.
In order to evaluate the impact of these glacial periods on the evolution of barbels, and to gain a better understanding of the structuration of L. pallaryi populations in the Guir Basin, a comparative approach was used, based on biological and genetic characteristics. More precisely, the aim of this study is to answer the following question: how did the climatic oscillations of the middle Quaternary influence the distribution of this species? The answers to this question should provide a new understanding of the intra-species taxonomy of Saharan barbels. In practice, this implies comparing an insular situation (foggaras) with a continental situation (lake), in order to reconstruct the history of the recent evolution of fish populations in extreme environments.
2 Material and methods
2.1 Samples and molecular protocols
In 2013, a total of 52 barbels were collected in the Algerian Sahara, sampled from the following two sites: the Djorf-Torba Lake (Bechar Province), whose waters are carried from the High Atlas by the Guir wadi (Errachidia region in Morocco: 31°31′426′’ N; 02°45′319′’ W), and the foggaras of the Touat oasis in the southeast of the Great Western Erg (Adrar Province: 28°00′167′’ N; 0°25′465′’ W). These two hydric sites are independent and separated by a distance of approximately 300 km (Fig. 1).
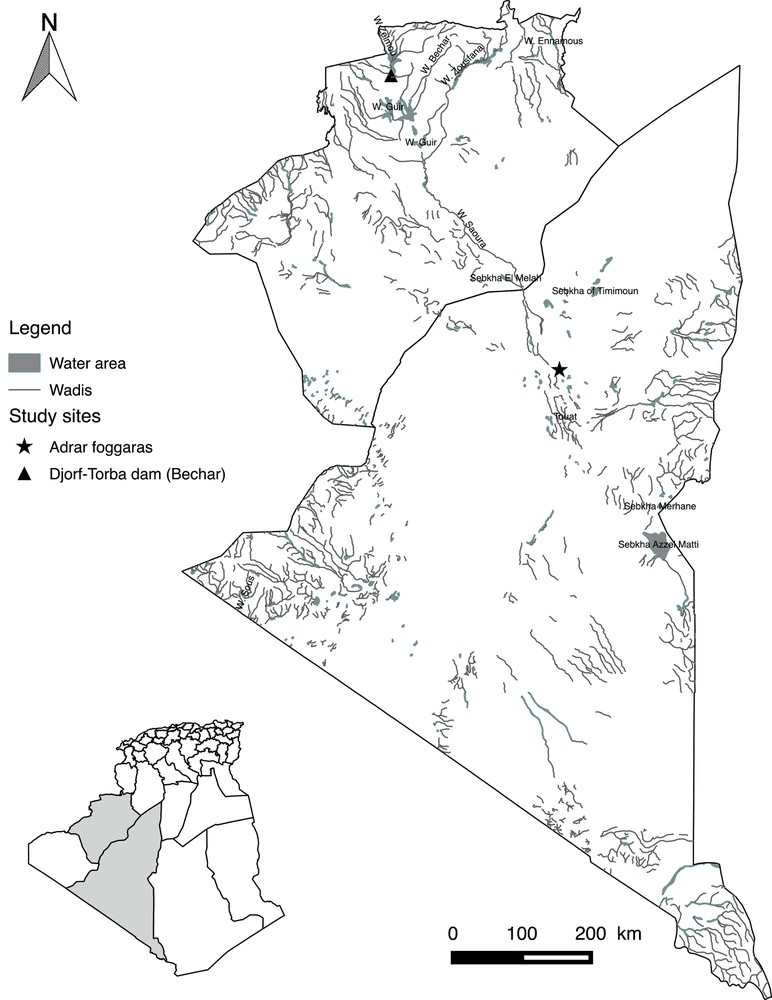
Map of Algeria showing the sampling sites of the analyzed Luciobarbus pallaryi in the Great Western Erg (Bechar and Adrar provinces).
2.1.1 DNA extraction, amplification, and sequencing
In total, 43 specimens of barbel were sampled for the genetic study. Twenty-seven additional mitochondrial sequences were downloaded from Genbank (Table 1). Whole genomic DNA was extracted from ethanol-preserved muscle using a DNeasy® Tissue Kit (Qiagen), according to the manufacturer's protocol.
Geographical locations, GenBank accession numbers and species abbreviations used in the molecular analyses.
| Species | Locality | GenBank acc. no. | Abbreviations in Fig. 4, Fig. 5, and Fig. 6 |
| Barbus barbus | Danube R., Austria | AB238965 | B. barbus |
| Luciobarbus sclateri | Manzano R., Spain | AF334082 | B. sclateri 1 |
| Segura, Spain | AF334083 | B. sclateri 2 | |
| Luciobarbus setivimensis | Aissi R., Algeria | AY015991 | B. setivimensis 1 |
| AY015992 | B. setivimensis 2 | ||
| Luciobarbus capito | China | NC020338 | L. Capito |
| Luciobarbus lepineyi | Noun R., Morocco | AY004739 | L. lepineyi 2 |
| Tidili R., Morocco | AY004746 | L. lepineyi 3 | |
| Noun R., Morocco | AF145929 | L. lepineyi 1 | |
| Draâ R., Morocco | JF798261 | L. lepineyi 4 | |
| Luciobarbus massaensis | Massa R., Morocco | AF145930 | L. massaensis 1 |
| Zag Mouzen R., Morocco | AY004737 | L. massaensis 2 | |
| Tamrhalcht R., Morocco | AY004740 | L. massaensis 3 | |
| Assaka R., Morocco | AY004741 | L. massaensis 4 | |
| Luciobarbus pallaryi | Draâ R., Morocco | AF145927 | L. pallaryi 1 |
| Guir R., Morocco | AY004736 | L. pallaryi 2 | |
| AY004745 | L. pallaryi 3 | ||
| Guir R., Djorf-Torba lake, Algeria | KU577513a KU577514a KU577515b KU577516b |
B57 to B080 | |
| Foggaras, Adrar, Algeria | KU577507a KU577508a KU577509a KU577510b KU577511b KU577512b |
A109 to A137 | |
| Luciobarbus antinorii | Bichri R., Tunisia | AY004725 | L. antinorii 1 |
| AY015989 | L. antinorii 2 | ||
| AY015990 | L. antinorii 3 | ||
| Luciobarbus moulouyensis | Moulouya River, Morocco | AF145925 | L. moulouyensis |
| Luciobarbus labiosa | Hajera River, Morocco | JF798260 | L. labiosa |
| Luciobarbus issenensis | Souss River, Morocco | AF145928 | L. issenensis |
| Luciobarbus magniatlantis | Oum er-Rbia River, Morocco | AF145926 | L. magniatlantis |
| Luciobarbus callensis | Kebir River, Algeria | AF145931 | L. callensis |
| Luciobarbus biscarensis | El Abiod, Arris, Algeria | AY004726 | L. biscarensis |
| Luciobarbus amguidensis | Imirhou Riverl, Algeria | AY004724 | L. amguidensis |
a GenBank accession number of Cytb sequences.
b GenBank accession number of D-loop sequences.
Polymerase chain reaction (PCR) amplification and sequencing were applied to two fragments of the mitochondrial genome: the cytochrome b (cyt b) and the D-loop control region. The cyt b gene was amplified using GluDG.L (5′TGACTTGAARAACCAYCGTTG3′) [25] and H16460 (5′CGAYCTTCGGATTAACAAGACCG3′) primers [26], while the D-loop was amplified using L15923 (5′TTAAAGCATCGGTCTTGTAA3′) and H16500 (5′GCCCTGAAATAGGAACCAGA3′) primers [27]. The PCR products were sent to Macrogen for sequencing in both directions. A total of 1586 bp obtained from the two loci was sequenced for L. pallaryi with the lengths of cyt b and D-loop being 1116 and 470 bp, respectively.
2.1.2 Alignments and phylogenetic analyses
The sequences were visualized and edited in SEQUENCHER v.5.2.4 (Gene Codes, USA) and then compared with other GenBank sequences in order to identify any undesirable contamination. The sequences were then aligned using MAFFT v.7 [28].
For each population, different indices were computed using ARLEQUIN v.3.1 [29]: the number of polymorphic sites (S), number of haplotypes (h), haplotype diversity (Hd), nucleotide diversity (π) [30,31], and pairwise FST values [32].
The genetic distance (d) between lineages was estimated using the Kimura two-parameter model [33] and then incorporated into MEGA v.6.0 [34]. Subsequently, the Student and Mann-Whitney tests were used to compare the different variables between clades using XLSTAT v.2014.
Tajima's D neutrality test [35], Fu and Li's test [36], and Fu's Fs test [37] were computed using DNAsp v.5.10. The demographic history of the sampled populations was inferred from pairwise mismatch distribution analysis [38,39]. A network of haplotypes was constructed using the median-joining method (MJ) [40] with the program Network v.4.6 (www.fluxus-technology.com).
We also reconstructed phylogenetic trees using the cyt b sequences. Maximum likelihood analyses [41] were implemented with GARLI v.2.1 [42] using the TN93 evolutionary model [43], as suggested for the data by JMODELTEST [44]. In total, 1000 bootstraps were obtained with four independent runs, each including 250 repetitions. The bootstrap values were then summarized on the best ML tree using SumTree [45] (run on DendroPy v.4.0.0; [46]).
The TN93 model was incorporated into Bayesian inference analysis, which was performed using four runs of Metropolis-coupled Markov Chain Monte Carlo (MCMC) sampling as implemented in the program MrBayes v.3.2.5 [47] using default model parameters as starting values. The following parameter settings were used: mchains = 4; lset nst = 2; rates = invgamma; mcmc ngen = 10,000,000; sample freq = 1000. The trees were represented using Figtree v.1.4.2 [48].
2.1.3 Divergence-time analysis
The analysis involved 70 nucleotide sequences. We estimated divergence times using a relaxed-clock model run with BEAST v.1.8.2 [49], which uses a Bayesian MCMC method. The MCMC chain was run for 10,000,000 generations, and its parameters were sampled every 1000 steps. The branch rates were drawn following an uncorrelated log-normal distribution and a coalescent one [50]. To implement the molecular clock, we set several calibration points based on the molecular clock data reported by Zardoya and Doadrio [15], in which the separation between North African, Greek, and Caucasian Luciobarbus was estimated to have occurred approximately 3.8 million years before present (BP), while the separation between Barbus/Luciobarbus lineages was considered to have occurred through orogenesis, during the Late Miocene, at approximately 8 million BP. Tracer v.1.6 [51] was used to plot the log-likelihood scores against generation time and evaluate run convergence and the burn-in needed before reconstructing a 50% majority rule consensus. The effective sample sizes of all of the parameters of interest were greater than 200. Finally, the trees were summarized with TreeAnnotator v.1.8.2 [49] to obtain a maximum clade credibility tree for the estimation of divergence times.
2.2 Morphological analyses
2.2.1 External morphology
For each specimen, 24 external morphological characteristics were described: 14 metric variables (Fig. 2) and 10 meristic variables relating to the number of scales on the lateral line and the number of soft and spiny rays on each fin (Table 2). The morphological characteristics to be examined were selected on the basis of similar studies [52–58].
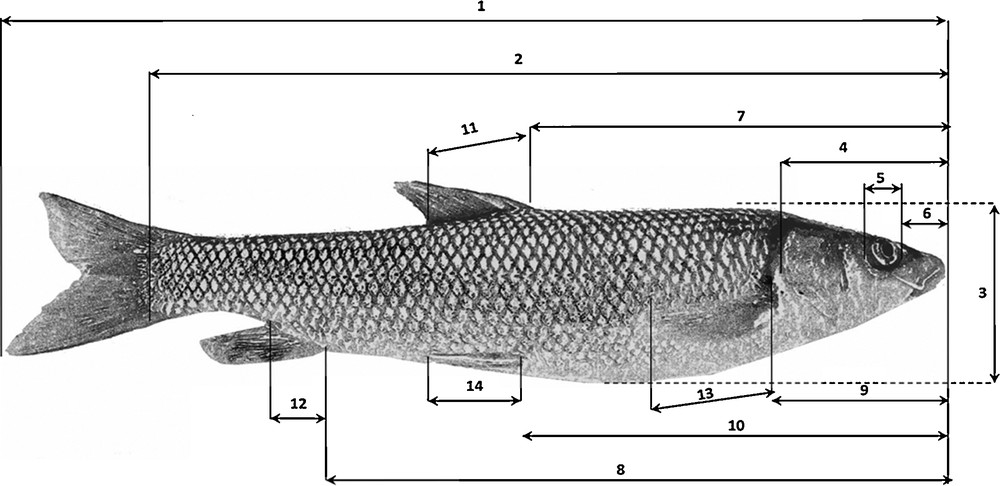
Measurements made on the barbel specimens: the numbering in this figure indicates the studied metric characteristics: 1. Total length (TL). 2. Standard length (SL). 3. Body height (H). 4. Head length (HeL). 5. Eye diameter (ED). 6. Snout length (SnL). 7. Pre-dorsal length (PDL). 8. Pre-anal length (PAL). 9. Prepectoral length (PPL). 10. Pre-ventral length (PVL). 11. Dorsal fin base length. (DL). 12. Anal fin base length (AL). 13. Pectoral fin base length (PL). 14. Ventral fin base length (VL).
Listed meristic variables on barbels.
| Code | Meristic variables |
| C | Number of rays on the caudal fin |
| D spiny | Number of spiny rays on the dorsal fin |
| D branched | Number of soft rays on the dorsal fin |
| A spiny | Number of spiny rays on the anal fin |
| A branched | Number of soft rays on the anal fin |
| P spiny | Number of spiny rays on the pectoral fin |
| P branched | Number of soft rays on the pectoral fin |
| V spiny | Number of spiny rays on the ventral fin |
| V branched | Number of soft rays on the ventral fin |
| LL | Number of scales on the lateral line |
2.2.2 Morphology of the cephalic components
The fish heads were boiled, and following their natural decomposition in water, the bones were dried and preserved. From the cephalic components, we selected the dentary, premaxilla, maxilla, and pharyngeal bones.
The classification recommended by Libois et al. [59], Libois and Hallet-Libois [60], and Mahnert and Gery [61] was used to describe the bones. Measurements were taken based on Libois and Hallet-Libois’ study [60] using a caliper and an eyepiece micrometer. For each cephalic part studied, the most significant osteological differences were noted. The osteometric variables and biometric indices are shown in Fig. 3 and Table 3.
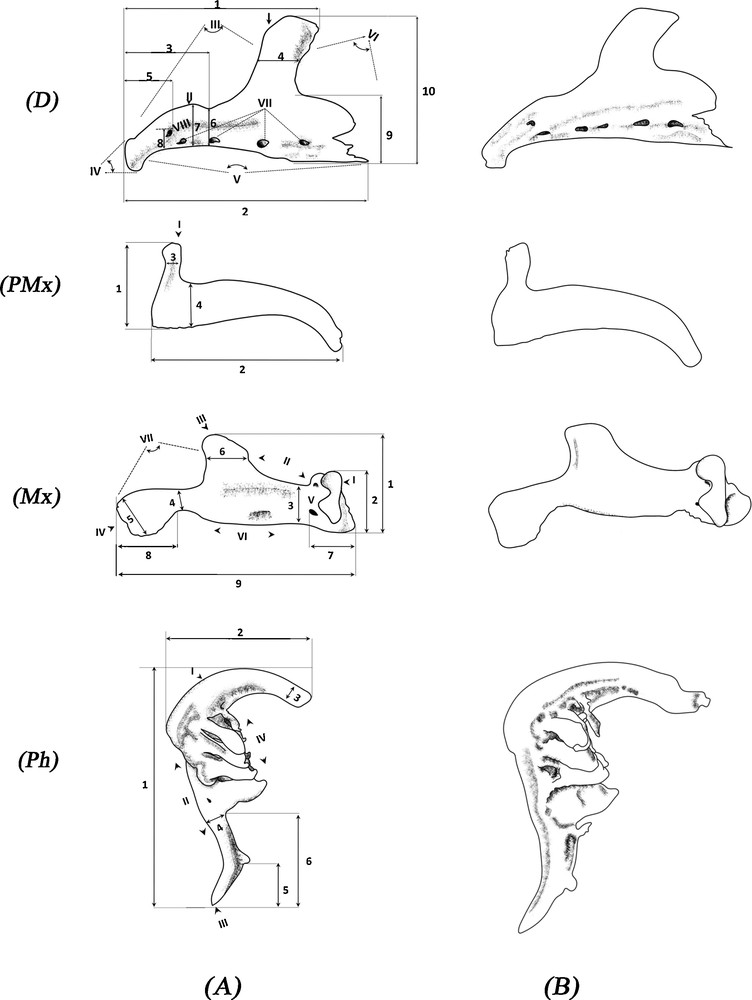
Measured dimensions of the left bones of Luciobarbus pallaryi: a, Adrar population; b, Bechar population. D: dentary; PMx: premaxilla; Mx: maxilla; Ph: pharyngeal bones (three rows of teeth). D I. Superior aboral apophysis (a.a.s). II. Coronoid process (c.a). III. Incisura anterior (i.a). IV. Anterior margin (m.a). V. Lower margin (m.i). VI. Incisura posterior (i.p). VII. Orifice of the lateral line (P). VIII. Foramen (f). 1. Maximum distance between the anterior margin and the posterior edge of the superior aboral apophysis (A). 2. Total length (L). 3. Distance between the anterior margin and the base of the superior aboral apophysis (Y). 4. Width of the superior aboral apophysis (S). 5. Distance between the anterior margin and the posterior edge of the foramen (X). 6. Height of the coronoid process (c’). 7. Maximum height of the coronoid process (C). 8. Distance between the lower margin and the foramen (x’). 9. Height of the lower mastoid aboral (Haai). 10. Maximum dentary height (H). PMx I. Rostral apophysis (p.a.s). 1. Maximum height (H) 2. Total length (L). 3. Width of rostral apophysis (G). 4. Maximum width of premaxilla (E). Mx I. Articular process (a.a.). II. Anterior apophysis (m.a). III. Superior aboral apophysis (a.a.s). IV. Posterior apophysis (a.p). V. Foramen (f). VI. Lower margin (m.i). VII. Posterior margin (m.p). 1. Maximum height of the maxilla (H). 2. Maximum height of the anterior apophysis (A). 3. Minimum height of the maxilla (E). 4. Minimum width of the posterior apophysis (P). 5. Maximum width of the posterior apophysis (G). 6. Width of the superior aboral apophysis (S). 7. Distance between the anterior edge and the posterior edge of the foramen (f). 8. Length of the posterior apophysis (Lap). 9. Total length (L). Ph I. Pharyngeal arch (c.o). II. Posterior margin (m.p). III. Posterior apophysis (a.p). IV. Dentigerous plate (c.d). 1. Total length (L). 2. Maximum height (A). 3. Larger diameter (DS). 4. Posterior diameter (DP). 5. Peduncle length (L.p). 6. Length of the posterior apophysis (L.a.p).
Comparison of osteometric ratios for L. pallaryi.
| Bones | Sites | Adrar (N = 30) | Bechar | F Probability | |||||||
| Statistics | Min (mm) |
Ave (mm) |
Max (mm) |
σ | N | Min (mm) |
Ave (mm) |
Max (mm) |
σ | ||
| Dentary | A/L | 0.72 | 0.86 | 1.01 | 0.07 | 21 | 0.8 | 0.9 | 1.01 | 0.06 | < 0.0001 |
| Y/L | 0.28 | 0.39 | 0.5 | 0.06 | 21 | 0.35 | 0.42 | 0.5 | 0.04 | < 0.0001 | |
| Haai/H | 0.46 | 0.57 | 0.74 | 0.07 | 21 | 0.5 | 0.6 | 0.74 | 0.06 | < 0.0001 | |
| c’/H | 0.23 | 0.31 | 0.42 | 0.05 | 21 | 0.24 | 0.33 | 0.42 | 0.04 | < 0.0001 | |
| C/H | 0.26 | 0.34 | 0.42 | 0.05 | 21 | 0.26 | 0.35 | 0.42 | 0.05 | < 0.0001 | |
| x’/L | 0.15 | 0.25 | 0.38 | 0.04 | 21 | 0.21 | 0.27 | 0.38 | 0.04 | < 0.0001 | |
| c’/L | 0.13 | 0.18 | 0.25 | 0.03 | 21 | 0.13 | 0.19 | 0.25 | 0.02 | < 0.0001 | |
| Y/A | 0.38 | 0.45 | 0.56 | 0.04 | 21 | 0.42 | 0.47 | 0.56 | 0.03 | < 0.0001 | |
| X/Y | 0.17 | 0.24 | 0.43 | 0.06 | 21 | 0.17 | 0.22 | 0.27 | 0.03 | < 0.0001 | |
| Y/L | 0.28 | 0.39 | 0.5 | 0.06 | 21 | 0.35 | 0.42 | 0.5 | 0.04 | < 0.0001 | |
| Laas/L | 0.16 | 0.21 | 0.26 | 0.02 | 21 | 0.16 | 0.21 | 0.26 | 0.02 | 0.959 | |
| Laai/L | 0.56 | 0.62 | 0.7 | 0.03 | 21 | 0.56 | 0.62 | 0.68 | 0.03 | 0.244 | |
| X/L | 0.07 | 0.09 | 0.15 | 0.02 | 21 | 0.07 | 0.09 | 0.12 | 0.01 | 0.824 | |
| H/L | 0.53 | 0.59 | 0.65 | 0.03 | 21 | 0.53 | 0.59 | 0.65 | 0.04 | 0.372 | |
| Laai/H | 0.95 | 1.06 | 1.2 | 0.06 | 21 | 0.95 | 1.05 | 1.15 | 0.05 | 0.8 | |
| Premaxilla | G/H | 0.15 | 0.2 | 0.26 | 0.03 | 20 | 0.17 | 0.26 | 0.32 | 0.04 | < 0.0001 |
| G/L | 0.07 | 0.1 | 0.13 | 0.01 | 20 | 0.1 | 0.13 | 0.16 | 0.02 | < 0.0001 | |
| H/L | 0.41 | 0.48 | 0.55 | 0.03 | 20 | 0.45 | 0.52 | 0.59 | 0.04 | 0.001 | |
| E/H | 0.44 | 0.51 | 0.73 | 0.05 | 20 | 0.44 | 0.49 | 0.55 | 0.03 | 0.054 | |
| E/L | 0.23 | 0.25 | 0.3 | 0.02 | 20 | 0.21 | 0.25 | 0.3 | 0.02 | 0.304 | |
| Maxilla | E/A | 0.63 | 0.74 | 0.82 | 0.04 | 21 | 0.58 | 0.66 | 0.77 | 0.05 | < 0.0001 |
| H/L | 0.31 | 0.4 | 0.46 | 0.03 | 21 | 0.3 | 0.36 | 0.41 | 0.03 | <0.0001 | |
| G/E | 0.79 | 1.08 | 1.27 | 0.11 | 21 | 0.88 | 1.27 | 1.59 | 0.16 | < 0.0001 | |
| P/E | 0.36 | 0.46 | 0.56 | 0.04 | 21 | 0.41 | 0.61 | 0.83 | 0.08 | < 0.0001 | |
| F/L | 0.17 | 0.19 | 0.26 | 0.02 | 21 | 0.1 | 0.13 | 0.22 | 0.03 | < 0.0001 | |
| E/H | 0.44 | 0.49 | 0.63 | 0.04 | 21 | 0.47 | 0.52 | 0.57 | 0.03 | 0.007 | |
| E/L | 0.16 | 0.19 | 0.23 | 0.01 | 21 | 0.15 | 0.19 | 0.23 | 0.02 | 0.062 | |
| Lap/L | 0.15 | 0.23 | 0.27 | 0.02 | 21 | 0.22 | 0.25 | 0.29 | 0.02 | 0.027 | |
| Pharyngeal bones | Lap/L | 0.38 | 0.43 | 0.52 | 0.03 | 22 | 0.44 | 0.48 | 0.52 | 0.02 | < 0.0001 |
| Lp/Lap | 0.45 | 0.55 | 0.73 | 0.05 | 22 | 0.4 | 0.47 | 0.59 | 0.05 | < 0.0001 | |
| DS/L | 0.07 | 0.09 | 0.13 | 0.01 | 22 | 0.09 | 0.11 | 0.13 | 0.01 | < 0.0001 | |
| A/L | 0.6 | 0.65 | 0.8 | 0.04 | 22 | 0.57 | 0.65 | 0.73 | 0.04 | 0.5382 | |
| DP/A | 0.15 | 0.19 | 0.25 | 0.03 | 22 | 0.18 | 0.22 | 0.29 | 0.03 | 0.0002 |
The external morphological as well as the osteological measurements expressed as ratios (Tables 4 and 5) were studied using discriminant factorial analysis (DFA) (XLSTAT v.2014) to determine the contribution of each index to the differentiation of the two studied populations.
Equality test of the average morphometric ratios for L. pallaryi.
| Statistics | Adrar (N = 30) | Bechar (N = 22) | F obs | Probability | ||
| Ave (mm) | σ | Ave (mm) | σ | |||
| PL/SL | 0.21 | 0.01 | 0.17 | 0.01 | 213.08 | < 0.0001 |
| VL/SL | 0.18 | 0.01 | 0.14 | 0.01 | 172.24 | < 0.0001 |
| HeL/PPL | 1.07 | 0.03 | 0.96 | 0.04 | 129.58 | < 0.0001 |
| HeL/SL | 0.29 | 0.01 | 0.25 | 0.01 | 109.54 | < 0.0001 |
| ED/HeL | 0.20 | 0.03 | 0.13 | 0.03 | 74.31 | < 0.0001 |
| H/SL | 0.26 | 0.02 | 0.22 | 0.02 | 46.18 | < 0.0001 |
| PDL/SL | 0.57 | 0.02 | 0.55 | 0.01 | 14.18 | 0.001 |
| PVL/SL | 0.54 | 0.02 | 0.53 | 0.03 | 5.26 | 0.026 |
| SnL/HeL | 0.33 | 0.04 | 0.31 | 0.03 | 5.25 | 0.026 |
| DL/SL | 0.12 | 0.01 | 0.12 | 0.01 | 1.39 | 0.244 |
| AL/SL | 0.08 | 0.01 | 0.08 | 0.01 | 0.51 | 0.478 |
| PAL/SL | 0.81 | 0.08 | 0.80 | 0.03 | 0.08 | 0.779 |
| PPL/PDL | 0.47 | 0.03 | 0.47 | 0.02 | 0.01 | 0.926 |
Comparison of meristic data from L. pallaryi.
| Meristic Variable | Adrar (N = 30) | Bechar (N = 22) | G test | Ddl | Probability | ||||
| Min | Max | Mode | Min | Max | Mode | ||||
| C | 16 | 22 | 21 | 22 | 25 | 24 | 61.29 | 2 | P < 0.001 |
| D branched | 7 | 8 | 7 | 7 | 8 | 8 | 4.18 | 1 | P < 0.05 |
| A branched | 5 | 5 | 5 | 5 | 6 | 6 | 28.72 | 1 | P < 0.001 |
| P spiny | 1 | 1 | 1 | 1 | 2 | 2 | 55.89 | 1 | P < 0.001 |
| P branched | 14 | 18 | 16 | 14 | 16 | 15 | 14.10 | 2 | P < 0.001 |
| V spiny | 1 | 1 | 1 | 1 | 2 | 2 | 55.89 | 1 | P < 0.001 |
| V branched | 8 | 8 | 8 | 5 | 8 | 8 | 20.60 | 2 | P < 0.001 |
| LL | 43 | 43 | 43 | 41 | 47 | 43 | 3.55 | 1 | NS |
The analysis of meristic variables consists mainly in computing the descriptive statistics, i.e. the mode (Table 5). To compare the two populations, a G test [62] was conducted for each variable, expressed in the form of frequency of occurrence.
The external morphometry of the fish and cephalic parts is based on the study of form. The word “form” refers to both the size and the proportion of the different parts. The comparison of the different “forms” of the cephalic parts is based on the principle of the Procrustes superimposition, which allows all individuals to be considered in the same morphological species to remove the effects of position, size, and orientation [63].
3 Results
3.1 Phylogenetic reconstruction and divergence date estimation
Phylogenetic relationships between haplotypes based on the cyt b are shown in Fig. 4. The maximum likelihood and Bayesian trees reveal identical topologies. These results are congruent with those obtained in previous studies [13,15,16,64,65].
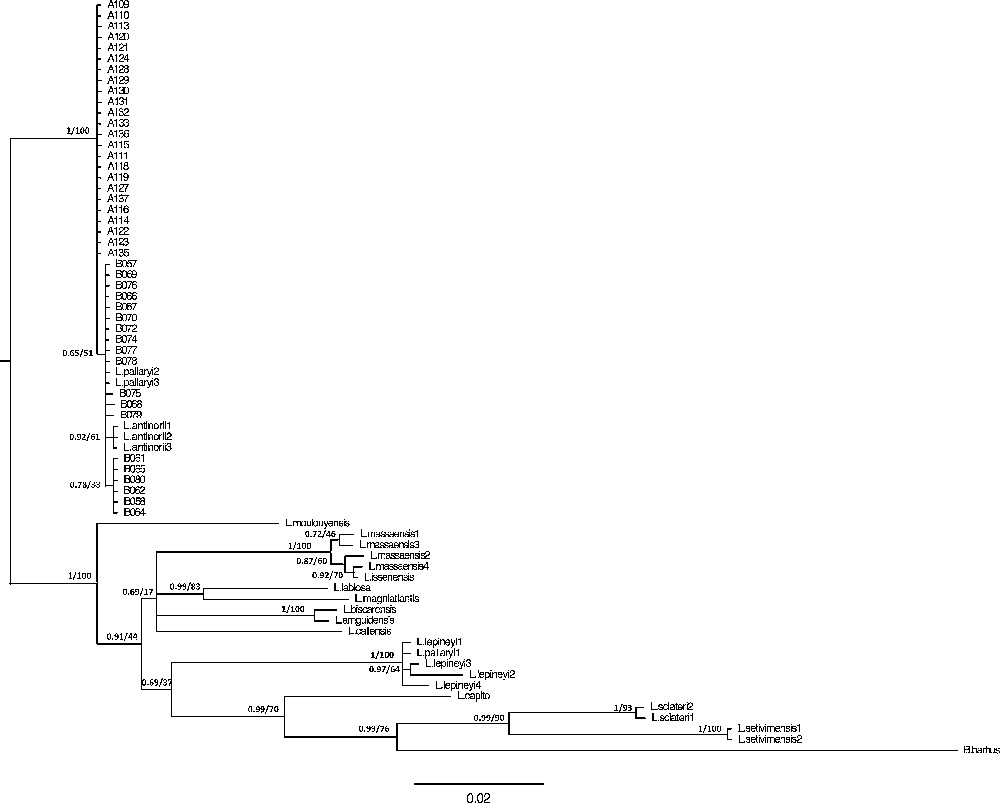
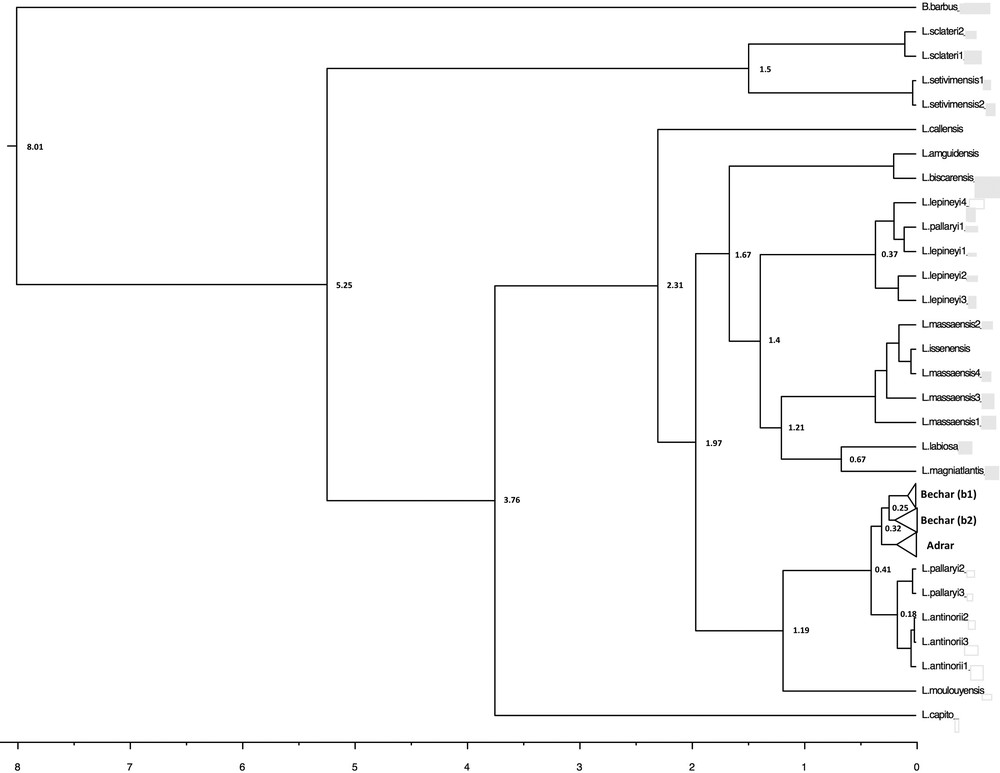
Bayesian inference and maximum likelihood phylogenetic relationships of the species included in the study, using the TN93 model obtained with the cyt b gene. Support values are indicated at the node as follows: posterior probability values for Bayesian Inference/bootstrap values (%) in the ML analyses.
For the sampled Northwest African barbels, the phylogenetic tree reveals a genetic and geographic structuration with three major groups:
- • the first corresponds to the L. lepineyi species, geographically limited by the Noun and Drâa wadies (Morocco);
- • the second includes the L. massaensis individuals originating from the Tamrhalcht and Assaka wadies (Massa wadi Basin, Morocco);
- • the third includes both the L. antinorii population from Chott El-Djerid, located in Southern Tunisia, and all of the L. pallaryi individuals located in the Zousfana wadi, including our samples from Bechar and Adrar (Guir wadi Basin, Morocco and Algeria). In the case of this third group, one can distinguish the following: the Tunisian subgroup, including the L. antinorii individuals, is strongly supported by the posterior Bayesian probability (PP: 0.92); the “Adrar” subgroup including only Adrar foggaras specimens, with a node that is strongly supported (PP: 1.00; BT: 100); one final subgroup including specimens from the Djorf-Torba Lake (Bechar) can be divided into two subclades (b1 and b2) that are poorly supported (PP: 0.78 and 0.65, respectively), with b1 including the individuals B58, B61, B62, B64, B65, and B80 and b2 all other Bechar specimens. The two L. pallaryi individuals (acc. N°: AY004736; AY004745) are also associated with the latter.
In terms of the phylogeographic pattern and population differentiation, the molecular clock (Fig. 5) estimates the separation between the Bechar and Adrar groups as having occurred approximately at 320,000 BP, and the divergence date for the node corresponding to the subclades (b1/b2) was estimated to be 250,000 BP.
Divergence times for Luciobarbus as estimated with BEAST, using a Bayesian MCMC method with an uncorrelated relaxed-clock model. The divergence times are indicated only for nodes supported by an a posteriori probability of > 0.5. The divergence time corresponds to the median of the a posteriori probability distribution of the node's age, in millions of years.
3.2 Population structure and genetic diversities
A total of 17 different haplotypes was identified within the 43 mtDNA sequences (1586 pb) of L. pallaryi analyzed. The median-joining method (Fig. 6) also reveals a differentiation between the Adrar and Bechar populations. Indeed, none of the haplotypes is common to the two clades. Four haplotypes characterizing the Adrar population (h = 4 out of 24 specimens) are distinguished by a single mutational step (1 pb difference), of which the predominant haplotype A109 is shared by 21 specimens. By contrast, the Bechar population has a high number of haplotypes (h = 13 out of 19 specimens) divided into two groups (b1) and (b2), separated by at least two mutational steps.
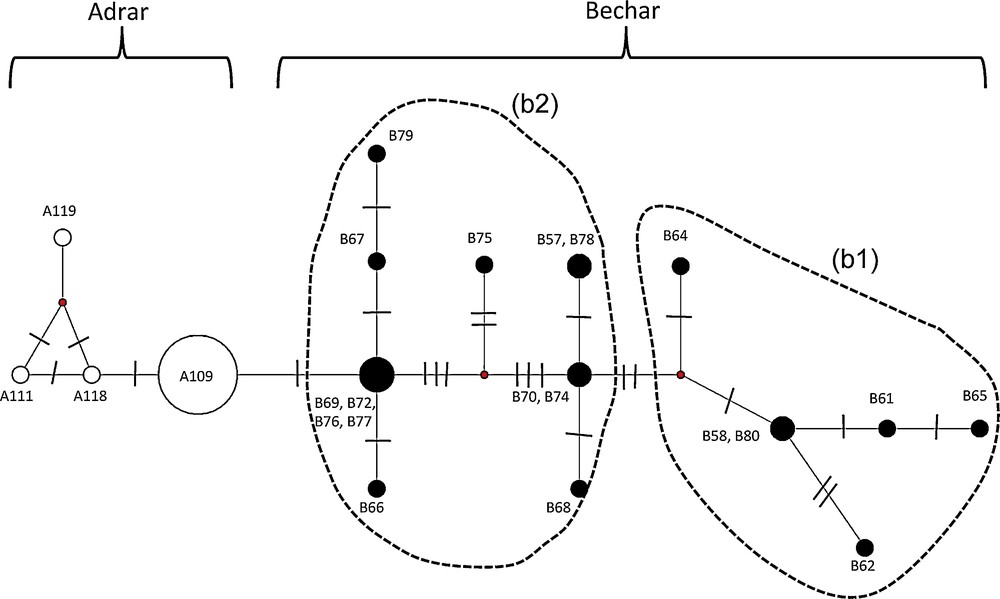
Haplotype median-joining network of the cyt b and D-loop mtDNA markers. The size of the circles is proportional to the haplotype frequencies within the full dataset. The two clades are identified by different colours: Adrar (white circles); Bechar (black circles). The text close to the circles indicates the corresponding sampling names. The numbers of mutations between haplotypes are indicated by lines on the branches. The haplotypes that were not detected in the samples are represented by small red circles.
As a consequence, the haplotype diversity is greater for Bechar (Hd = 0.936 ± 0.037) than for Adrar (Hd = 0.239 ± 0.113) populations. In addition, the nucleotide diversity is higher in the Bechar sample (π = 0.0038 ± 0.0022) than in the Adrar population (π = 0.0003 ± 0.0003).
When compared with other species of the Barbus genus, nucleotide diversity is rather low within the Adrar and Bechar populations. The Italian barbels, Barbus caninus found in the Po River Basin (Hd = 0.617; π = 0.033) and B. tyberinus from the Tiber River Basin (Hd = 0.831; π = 0.018), are characterized by much higher values [65].
The intra-population divergence is very low for the Adrar samples (d = 0.47%) when compared to the Bechar samples (d = 5.57%). When compared to other Luciobarbus species in which the genetic distance is between 1.4 and 3.2% [66,67], the mean genetic divergence separating the Adrar and Bechar sequences (d = 6.46%; P < 0.0001) remains very high, suggesting a strong genetic differentiation (Fst = 0.6; P < 0.05). This results from the absence of any genetic exchange between geographically removed locations (distance equal to approximately 300 km).
The mismatch distribution analysis revealed the signature of a population in recent expansion (unimodal distribution; [38]) for the Adrar group (Fig. 7 A). However, a more heterogeneous distribution characterizes the Bechar group, suggesting a relatively stable population (Fig. 7 B). The expansion signal is also confirmed by the negative significant values of Fs and Fu (P ≤ 0.05), contrary to the values of Tajima's D neutrality test, Fu and Li's test, and the sample standard deviation, which are non-significant for both lineages (Fig. 7).
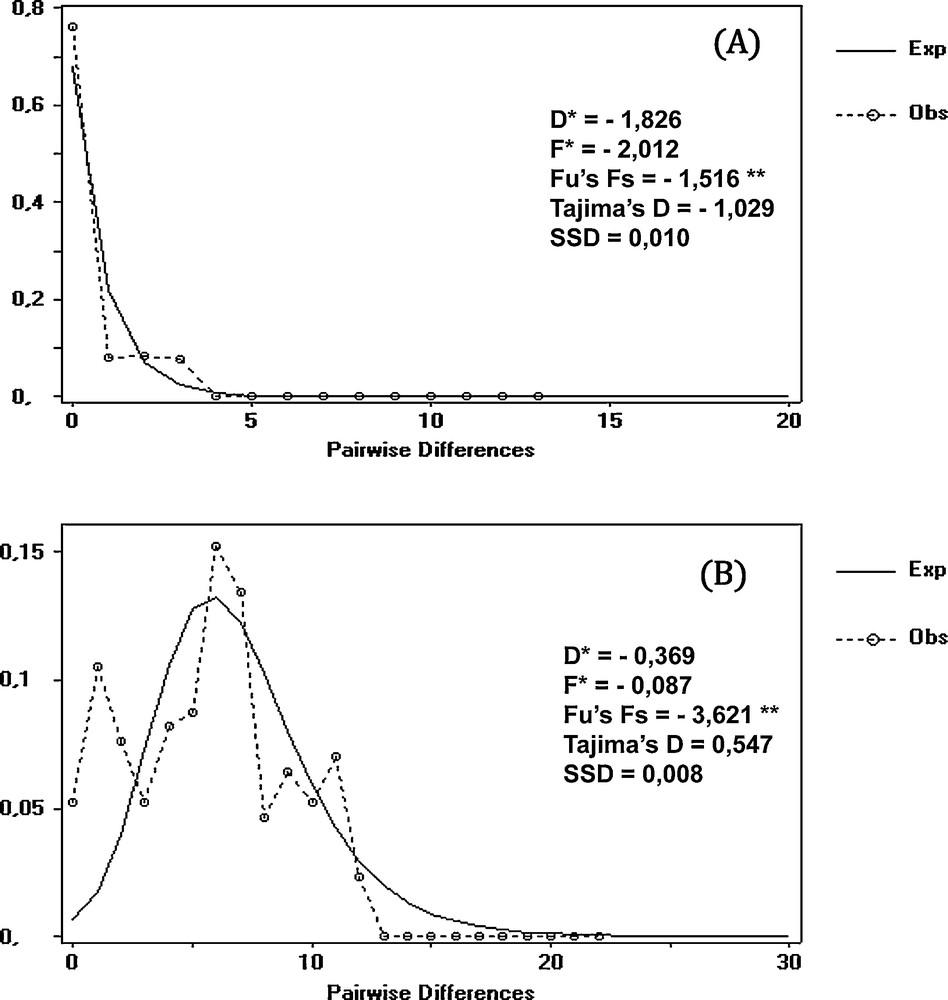
Mismatch distribution analysis for mtDNA from two groups of Luciobarbus pallaryi. A: Adrar; B: Bechar; **: P < 0.05.
3.3 External morphology
The external morphological characteristics make it possible to distinguish the studied populations. The barbel in the Touat d’Adrar region, described by Pellegrin [68] as B. pallaryi, corresponds to our observations: a mottled brown fish, with head length equal to one-third of its standard length (HL = 0.26 to 0.27), an elongated snout (SnL/HL = 0.33 to 0.36), eye diameter one-fifth to one-quarter of the head length (ED/HL = 0.20 to 0.25), and dorsal and ventral fins located at the same position.
The barbel from the Djor-Torba lake (Bechar) corresponds to the indications for B. figuigensis described by Pellegrin [69,70] at Figuig, in the basin of the Zousfana wadi: upper brownish and lower whitish skin, head length equal to 0.27 of its size, an elongated snout (SnL/HL = 0.26 to 0.37), and a dorsal fin with three spiny rays and eight branched rays.
Moreover, the foggaras barbel is much smaller than that from Djorf-Torba Lake: the size (TL) of the former ranges between 83 and 192 mm, whereas that of the latter ranges between 130 and 413 mm.
Similarly, the Fischer (variance) test shows highly significant differences for the first six variables (P < 0.0001, Table 4), which allow total discrimination (100%) between the two groups. The indices, PL/SL, VL/SL, HeL/PPL, and HeL/SL, also make it possible to clearly separate them, with a significant allocation level (98.08%, or one case in 52). The G test also reveals highly significant differences for the meristic variables (P < 0.0001; Table 5), with the exception of the number of scales on the lateral line and the number of spiny rays on the dorsal and anal fins, which have similar if not identical values for both populations.
3.4 Morphology of the cephalic components
3.4.1 Dentary
In the case of the Adrar barbel (Fig. 3 A, D), the incisura anterior has a sharply rounded crest with a rupture at the level of point (c’). The anterior margin appears to be rectilinear and slightly bilobate. The lower margin is convex in its anterior portion and has four pores. However, in the case of the Bechar barbel (Fig. 3 B, D), the edge of the crest is considerably more rounded, and the anterior margin is visibly bilobate. The anterior portion of the bone is inclined sharply downwards. The lower margin is relatively straight and has four to five pores on its lateral line.
DFA reveals that the first nine ratios are highly significant (P < 0.0001; Table 3) and permit complete segregation between the two populations. Similarly, the three ratios (A/L, Y/L, x’/L) alone are sufficient to allow the two groups to be distinguished, with 98.8% of individuals correctly classified (only one individual was incorrectly classified).
3.4.2 Premaxilla
All of the fifty studied left premaxilla have a similar shape (Fig. 3, PMx). The bone is slightly curved, with a distinct processus articularis superior. Although the ratios G/H and G/L confirm that there is a difference between the studied barbels (Table 3), the premaxilla characteristics less reliably distinguish between the Adrar and Bechar specimens. DFA leads to an a priori classification that is 86% correct, with a total of seven incorrectly classified individuals.
3.4.3 Maxilla
Through the observation of their shape (Fig. 3, Mx), all of the studied maxilla (Adrar and Bechar) have a superior apophysis; which is clearly detached from the body of the maxilla, with a generally concave rear edge. The lower smooth-edged margin has, at the rear, a sinus defining a clear peduncle at the rear apophysis. The articular apophysis has a protuberance, which is projected to the same level as its upper portion.
Despite these similarities, the superior aboral apophysis and rear apophysis form an approximately 90° angle in the case of the Adrar barbel, whereas, in the case of the Bechar, this angle is greater (∼120°). The anterior edge of the superior aboral apophysis is rather smooth, with a strong curvature in the case of the Bechar, whereas in the case of the Adrar, this curve has a rupture at a point of inflexion at which the width “S” of the aboral apophysis can be measured (Fig. 3A, Mx).
DFA applied to the first five ratios reveals significant discrimination, with just one incorrectly classified individual (P < 0.0001; Table 3). In addition, we note that both of the variables P/E and F/L can clearly distinguish between the Djorf-Torba Lake and Adrar foggaras samples, with a correct classification of 98.08% (the same individual remains incorrectly classified).
3.4.4 Pharyngeal bone
All of the pharyngeal bones are falciform, and discrimination between the Adrar and Bechar groups is mainly based on the anterior portion of the bone. This is round and well arched in the first group, whereas the second group has a relatively straight anterior portion, with an abruptly upward-pointing apex. Other observations allow the two pharyngeal bones to be distinguished based on the rear branch of the bone, which is quite narrow in the Adrar and stockier in the case of the Bechar.
All of the studied pharyngeal bones contain nine teeth, implanted on the interior side of the bone, in three rows with a stable arrangement (4-3-2). The dental crowns are well aligned with smooth edges, terminating in a hook.
When DFA is applied to the first three variables (P < 0.0001; Table 3), the Adrar and Bechar populations can be clearly distinguished from each other, with an a priori 96.15% correct classification, i.e. two incorrectly classified individuals.
4 Discussion
The phylogenetic analyses conducted on cyt b make it possible to group the Saharan lineages of L. antinorii, L. lepineyi, and L. pallaryi, as in previous studies on allozymes [11] and the mitochondrial genome [13]. Whereas Doadrio et al. [11] and Tsigenopoulos et al. [16] suggest that specimens from the Tidili River (Ouarzazate, Drâa, Morocco) (accession number AF145927) correspond to L. pallaryi instead of L. lepineyi, our results (Figs. 4 and 5), show that this individual corresponds to L. lepineyi, thus confirming the findings of Machordom and Doadrio [13].
According to Doadrio et al. [11], the L. antinorii lineage, which lives in the Tunisian Sahara, is phylogenetically closer to the Western Sahara species, which explains its grouping with L. pallaryi in the same clade.
When compared to previous studies of the phylogenetics of barbels in North Africa [11,13,16], a new mitochondrial lineage referred to as “Adrar” is revealed and shown to have been differentiated probably during the Saalian glaciation period (Middle Quaternary) 320,000 BP (95% HPD: 110,000–550,000 years BP) (Fig. 5). It is possible that the extremely cold and arid conditions during the Saale–Riss glaciation may have been responsible for a radical decrease in the size of the Adrar population, leading to a major genetic bottleneck and consequently a sharp decline in genetic diversity. It is thus possible to imagine that favorable climatic events approximately 250,000 BP led to the demographic expansion of the L. pallaryi population upstream of the Guir Basin.
According to Avise [71], the climatic oscillations of the Quaternary played a major role in elaborating the current geographic distribution of species, including that of their structure and genetic diversity.
Network analysis (Fig. 6) confirms the separation of these two populations, with a geographic structuration: upstream and downstream from the Guir, the gene flow of which was interrupted due to their geographic separation by approximately 300 km, leading to total reproductive isolation, thus explaining the absence of common haplotypes between the two study sites.
The presence of the dominant haplotype (A109) suggests that the current Adrar population could have descended from a single female. It is likely that only one mutation (indeed, one single mutational event) affected the mtDNA of the A109 haplotype carriers, thereby leading to the birth of a small number of other unique haplotypes (A111, A118, and A119). In addition, the very small number of haplotypes characterizing this population reflects the influence of geographic isolation [72].
Regarding the trees (Figs. 4 and 5), the particular structure of a well-separated branch, including the Adrar individuals alone, is evidence of a possible genetic bottleneck produced by a small L. pallaryi population, which became isolated in the underground waters of the foggaras and was subsequently able to subsist and evolve independently. The very low nucleotide diversity and mismatch curve confirm the hypothesis that the Adrar population had, at a certain time in its history, a very small number of individuals.
In a given population, when the mismatch distribution is more uniform, the haplotypes indeed have a small divergence [73], which can indicate selection or the influence of stochastic events in the population's history [74], such as a founder effect or the influence of a bottleneck, followed by an expansion [75,76].
However, the high number of haplotypes found in the Bechar population could also be evidence of the recent arrival of individuals from several different lineages into the upstream waters of the Djorf-Torba Lake, together with the non-significant impact of fishing on genetic variability. Fishermen try to catch large fish such as carp (Hypophthalmichthys molitrix), while neglecting the barbels (personal observation).
The measurement of haplotype and nucleotide diversities informs about the demographic history of a population [72]. The high value of haplotype diversity combined with the low value of nucleotide diversity leads to the presence of a large number of unique haplotypes, thus suggesting that the Bechar population was formerly subjected to a bottleneck followed by a rapid expansion [77]. The Fu statistic and mismatch distribution (Fig. 7 B) are also indicative of this demographic expansion [37]. According to Simon-Bouhet et al. [72], a polymodal distribution within a population provides evidence of a mixture of diverging evolutionary lineages.
Morphological and osteological analyses confirm the separation of the Adrar and Bechar lineages (Tables 2, 4, and 5; Fig. 3). Both groups can be recognized on the basis of their meristic and metric characteristics, in particular: prepectoral length, head length, and ventral and pectoral fin lengths. The main bone components—dentary, maxilla, and pharyngeal bones—also contribute to the separation of these two lineages.
Some studies have discriminated between fish species and populations based on biometric indices [53,55,57,58,78,79], while others have not been able to distinguish between cyprinidae in morphological terms [80–83]. According to Dynes et al. [84], morphological differences between populations of the same species could be phenotypical, since they are related to environmental conditions, especially diet [85].
Indeed, morphology alone is not always relevant in the identification of species. Confronted by these taxonomic difficulties [86], the genetic study of barbel populations [9,11,87,88] should provide indispensable information for the clarification of their systematics and evolutionary variations. As an example, the three barbel species described by Pellegrin [68–70] in the Figuig oases (Morocco)—Barbus pallaryi, B. lepineyi, and B. figuigensis—would, according to Almaça [89], correspond to different stages of growth within the same B. antinorii species described by Boulenger [90] in the Fatnassa oases (Chott El Jerid, Tunisia). Nevertheless, the results of Doadrio et al. [11] and Machordom and Doadrio [13] do not correspond to the taxonomic propositions of Almaça [89]. According to Doadrio et al. [11], the morphological similarities between the three species (B. antinorii, B. pallaryi, and B. lepineyi) are the consequence of an adaptive response to environmental conditions. It has been shown that the early reproduction of some species of fish can be related to an adaptive strategy (physiological and behavioral) to resist the stress associated with the environmental conditions [91]. Indeed, a reduced size at initial maturity linked to the environment was reported for Ethmalosa fimbriata (Clupeidae) and Sarotherodon melanotheron (Cichlidae) living in the brackish estuaries of the Casamance and Sine Saloum Rivers (Senegal) [92], Tilapia zillii in small ponds [93], and female S. melanotheron held in rearing ponds as compared to natural conditions [94].
In the Guir Basin, the morphological, osteological, and genetic characteristics make it possible to clearly distinguish between the two lineages of L. pallaryi, both upstream and downstream. In addition, the data concerning size and sexual maturity reveals considerable geographic variability between specimens captured upstream in the Djorf-Torba Lake and those fished in the downstream Adrar foggaras. The latter begin reproducing at a highly juvenile stage (females reach sexual maturity at 83 mm; personal observation). This is therefore not a matter of growth stages, as suggested by Almaça [89]. The biological changes affecting the L. pallaryi population of the Adrar are probably related to the ecological conditions of the foggaras. Neoteny is a form of adaption to the difficult conditions of the Western Sahara, in particular drought, climatic aridity, and the relatively high salinity of the water table. These observations lead to the hypothesis that the ecological conditions of these habitats could cause the barbel to adapt its behavior and phenotype.
5 Conclusion
This study on the L. pallaryi, an endemic species of Northwest Africa, aimed to date any possible bottleneck and expansion events as detected through genetic techniques and to test the influence of climatic variations during the Middle Quaternary on the distribution of this species in the Guir Basin (Algeria). In this context, the present study has made it possible to contribute the following new elements:
- • the presence of two populations within this species, which are highly differentiated by their genetic structure and geographic distribution upstream and downstream of the Guir Basin;
- • the discovery of a new “Adrar” lineage that constitutes a highly interesting evolutionary model: on the one hand, its extreme geographic isolation allows it to be differentiated independently, while, on the other hand, this group of fish is probably the most threatened of the Saharan barbel species. In view of the fact that it lives in the underground waters (foggaras) of the Great Western Erg, these characteristics make it of particular interest for the study of evolutionary and ecologically adaptive processes;
Given that the upstream (Bechar) and downstream (Adrar) parts of the Guir are separate areas and that the L. pallaryi populations can be differentiated on the basis of their morphological, osteological, biological, and genetic characteristics, we propose that this species be distinguished at the taxonomic level as a subspecies: Luciobarbus pallaryi pallaryi (Pellegrin, 1919) in the (Adrar) foggaras and Luciobarbus pallaryi figuigensis (Pellegrin, 1939) in the upper basin of the Guir and Zousfana waddies, according to the taxonomic priorities.
Further studies on the genetics of Saharan barbel populations should include additional samples taken from other geographic regions, such as Tunisia and eastern Morocco, in order to gain an even more refined determination of its population structure.
Acknowledgements
We extend our sincere thanks to all of those who contributed to this research: Berraki Arezki, Director for the Control, Maintenance and Operation of the ANBT-Alger infrastructures; Sabiha Aguenini, environmental engineer, ANBT-Alger, Algeria; Benatia Fateh and Boubaker Labed, in charge of postgraduate research and external relations at the University of Biskra, Algeria; Brahimi Souad, researcher a the University of Batna, Algeria; René Rosoux, Director of the Natural Sciences Museum of Orléans, France; Caroline Nieberding, Professor at the Catholic University of Louvain, Belgium. We are also grateful for the assistance provided by Alain Vanderpoorten, Jairo Patino, Laurent Gohy, and Clémence Germain, researchers at Liège University, Belgium. Lastly, we would like to thank Victoria Grace (www.english-publications.com) for editing the manuscript.
This paper is publication BRC 351 of the Biodiversity Research Center (Université catholique de Louvain).
1 In Arabic, “foggara” means “to dig”. The foggara is a slightly inclined underground gallery draining water from the upstream aquifer, via drier terrain situated downstream towards the palm grove. In the Sahara, the foggara has contributed to the development of oases for many centuries. Each oasis comprises an upstream foggara, a ksar (village) in the centre, and a downstream palm grove.