

1 Introduction
Barley (Hordeum vulgare subsp. vulgare), the most drought tolerant of the small grain cereals and a major crop in the Mediterranean region, is considered a model species for physiological and genetic studies, because of its diploid nature, with a relatively small number of large chromosomes and has been widely used as a genetic model [1]. Since selection processes in many breeding programs limit the level of diversity, a wide and representative collection of germplasm is required in order to supply genetic diversity [2]. Cross compatibility and shared genome between wild and cultivated barleys introduces wild barley as a good source for valuable alleles to barley breeders for crop improvement and to enrich the barley germplasm pool available [3]. Recent advances in genetic and genomic techniques and technologies have led to explosive advances in new genetic and genomic approaches for the dissection of various quantitative traits and the determination of their chromosomal locations, which facilitated and advanced the identification of a number of marker–trait associations in various crop species, including barley. Genetic diversity in wild barley and its promising contribution as a source of favorable alleles for a number of agronomic traits such as plant height, grain yield and drought tolerance have been numerously reported [4–11].
Drought tolerance is defined as the ability of a plant to survive, grow, and produce a harvestable yield with limited water supply or under periodic conditions of water deficit [12]. Increased frequency of droughts negatively affect plant development, growth, yield, and ultimately production of crop species. In the light of climate changes, other factors that affect the sustainability of the world's resources and its consequences on food security, development of drought tolerant cultivars is therefore essential for maintaining yields under climate change conditions and for the extension of agriculture to sub-optimal cropping areas [13]. Given the complexity of the genetic control of drought tolerance (polygenic inheritance, low-heritability, and high G × E interactions), marker-assisted breeding has not contributed significantly to crop improvement for drought tolerance. However, progress has been made in the last two decades in the understanding of the genetic basis of drought tolerance in crop plants, which is a prerequisite for the application of marker-assisted breeding in the development of cultivars with improved tolerance. Barley seems to be relatively well adapted to water deficit; therefore, it is regarded as being a model to study and understand the genetic basis and mechanisms of drought tolerance [14–17].
Most quantitative trait loci (QTL) associated with drought tolerance in barley have been identified through yield and yield-contributing traits under drought-stress conditions [18–21]. Although the development of molecular markers and genome sequencing approaches should accelerate positional cloning of genes responsible for drought tolerance, the genomic regions associated with those QTLs are still relatively large and are usually inappropriate for screening in a breeding program. To the best of our knowledge, up to now there is no report available regarding the application of marker-assisted selection for drought tolerance in barley as well as in any other crop species. The limited success of the molecular breeding approaches until now suggests a careful rethinking about new plant genetic and genomic approaches and platforms that may allow us to overcome this limitation and improve our understanding and breeding for drought tolerance [22]. Therefore, considering the drawbacks of classical QTLs analysis, association mapping provides the opportunity to identify QTL with high mapping resolution as well as a lesser research effort. In barley, association mapping has been successfully employed in identifying molecular markers significantly associated with numerous phenotypes in a number of plant species, including salt tolerance, yield and yield stability under drought conditions, spot blotch, drought stress (DS) related traits in wild barley [23–28].
In the present study, we aimed to implement association mapping analysis to identify significant association between molecular markers and six yield and yield-contributing traits under drought-stress conditions.
2 Material and methods
2.1 Plant materials, planting conditions, and stress treatments
Ninety-four barley accessions (Hordeum vulgare ssp. spontaneum) collected from 12 different countries were provided by National Small Grains Germplasm Research Facility, USDA, ARS, Idaho, USA [29]. Drought stress experiments were conducted in 2014/2015 at the Asyut University Experimental Farm at latitude of 27 ° N. Experiments were conducted essentially as described by Abou-Elwafa [29]. In brief, nine seeds were sown in three rows in round plastic pots with a diameter of 25 cm and 40 cm depth filled with 12–13 kg of clay soil. Plants were fertilized three times with 250 ml of NPK liquid fertilizer containing 9% N, 3% P2O5, and 6% K2O in each pot. Sowing dates were staggered so that accessions would experience stress at the flowering stage of development. A well-watered (WW) and severe DS experiments were carried out. The WW experiments were irrigated with about 500 ml of water per pot each day by drip irrigation. The DS experiments were also irrigated as WW experiments until 20 days before anthesis, when water was drastically decreased to 125 ml twice a week.
The following traits were recorded: i) days to heading (DH), date when 50% of plants have begun heading, ii) plant height (PH), height of main stem at maturity, iii) number of tillers/plant (NoT), iv) spike length (SL) in cm excluding the awns, v) thousand kernel weight (TKW) in g, and vi) single plant yield (SPY) in g. Drought tolerance indices (DTIs) were calculated for all studied traits by dividing the trait value under DS by the trait value under the control.
2.2 Genotyping and marker analysis
SSR primers were selected from published linkage map of barley as revealed by Marcel et al. [30]. SSRs were screened by using eight diverse accessions and finally, a total of 76 markers were selected based on clear polymorphic banding patterns (Supplementary Table 2). The SSR markers were identified based on their uniform distribution in the genome, quality of their PCR product and polymorphism level from the public sequences of Karakousis et al. [31], Ramsay et al. [32], and Rostoks et al. [33]. The number of alleles that resulted from each one of the 76 SSR markers was counted, and the frequency of each allele was computed across the whole set of accessions. Markers with an allele frequency less than 5% in the population (rare alleles) were treated as missing data and excluded from further analyses.
2.3 Association and statistical analyses
DNA marker-quantitative trait (SSR-trait) associations were identified using the general linear model (GLM) in TASSEL (http://www2.maizegenetics.net/). The model used to detect SSR-trait associations considers the effect of the genetic marker (M), the environment (E), and the interaction (M × E). The mean squares of M × E were used as an error term for the estimation of the F-statistic for each marker main effect. The mean squares of the residuals were used to calculate the F-statistic for the M × E effect. An SSR-trait association was considered real when the marker main effect was significant at P ≤ 0.01 [34]. The presence of an SSR-trait association depending on the environment was identified when the M × E was significant at P ≤ 0.01. Association analysis was performed using drought tolerance indices of six traits. Analysis of variance (ANOVA) of all studied traits was performed using PROC MIXED (SAS Institute Inc. 2008). The population structure of the 107 accessions was carried out for genotypic data of 71 markers using a model based (Bayesian) clustering algorithm in software package STRUCTURE v. 2.2 [35,36].
3 Results
3.1 Phenotypic evaluation
All measured yield and yield-contributing traits differed greatly across environments reflecting, in part, differences in water availability. The ANOVA revealed highly significant differences (P ≤ 0.05) in all traits between genotypes. A highly significant genotype × environment interaction for all traits was observed (Table 1). As expected, DS led to a significant reduction in days to heading (DTH), days to flowering (DTF), number of tillers/plant (NoT), plant height (PH), spike length (SL), thousand kernel weight (TKW), and single plant yield (SPY) up to 18.26%, 15.46%, 73.92%, 50.25%, 20.18%, 16.23%, and 70.99%, respectively (Fig. 1).
Significance of F values of evaluated traits for the 107 barley genotypes under well-watered and drought-stress conditions.
| DTH | NoT | PH | SL | TKW | SPY | |
| Genotypes (G) | 987a | 1897a | 7,9888a | 5104.6a | 2177a | 3998a |
| Drought-stress (D) | 198.9a | 28.9a | 63.6a | 27.4a | 24.6a | 16.0a |
| G × D | 215.5a | 32.9a | 66.9a | 28.8a | 21.9a | 14.7a |
a Highly significant differences (P ≤ 0.01).
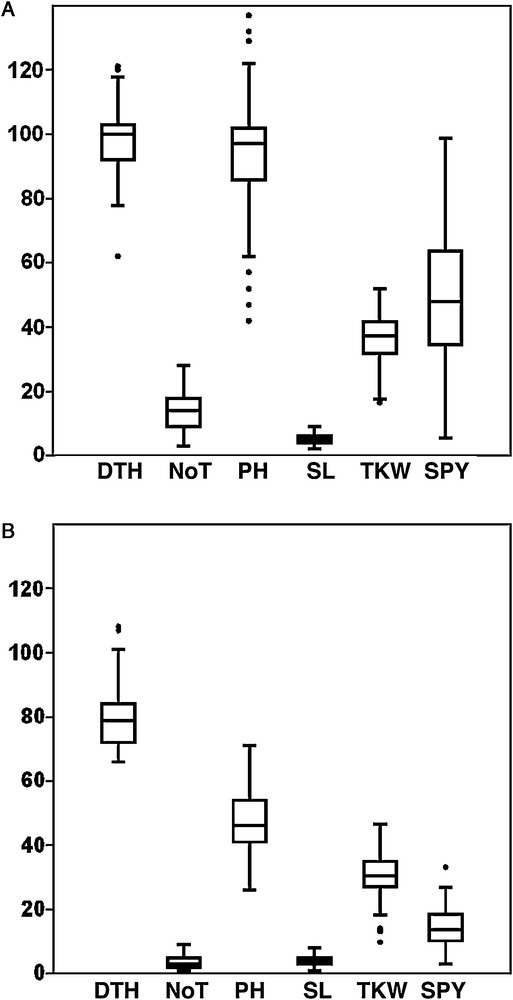
Boxplot for six yield and yield-contributing traits of 107 barley accessions evaluated under well-watered (A) and drought-stress (B) conditions.
3.2 Association analysis and population structure
Association analysis performed using 76 SSR molecular markers with drought tolerance indices (Table 2) of six yield and yield-contributing traits was performed through the general linear model (GLM) in the TASSEL software (http://www2.maizegenetics.net/). The evaluated traits include DTH, PH, NoT, SL, TKW, and SPY. Out of the 76 SSR markers, 43 markers exhibited highly significant associations, with at least one of the six measured traits yielding 83 significant marker–trait associations with an R2 value ranged from 5.08 to 27.84%. Of these 83 marker–trait associations, 26 and 10 associations were significant for marker main effects and M × E interactions, respectively (Table 3). Cluster analysis based on the DICE dissimilarity index and the unweighted neighbor-jointing method performed using the genotypic data of 71 SSR markers from 107 accessions identified 12 main clusters (Figs. 2 and 3).
Drought tolerance indices of six yield and yield contributing traits of 107 barley accessions.
| Accession | DTH | PH | NoT | SL | TKW | PY |
| LW95Z059-16 | 0.830 | 0.250 | 0.742 | 0.667 | 0.908 | 0.199 |
| Igri | 0.814 | 0.700 | 0.438 | 0.800 | 0.830 | 0.287 |
| LP 813.6.98 | 0.788 | 0.188 | 0.549 | 0.833 | 0.672 | 0.142 |
| Babylone | 0.876 | 0.150 | 0.609 | 1.000 | 0.957 | 0.275 |
| Orza - 96 | 0.814 | 0.176 | 0.366 | 0.500 | 0.438 | 0.146 |
| Candesse | 0.718 | 0.095 | 0.500 | 1.000 | 0.882 | 0.232 |
| Beysehir | 0.696 | 0.214 | 0.549 | 0.833 | 0.877 | 0.171 |
| Bombay | 0.825 | 0.120 | 0.506 | 0.400 | 0.806 | 0.141 |
| Catinka | 0.830 | 0.150 | 0.333 | 0.833 | 1.007 | 0.211 |
| Andrea | 0.724 | 0.059 | 0.609 | 1.000 | 0.891 | 0.337 |
| Carat | 0.700 | 0.053 | 0.462 | 0.500 | 1.213 | 0.359 |
| Catskill | 0.774 | 0.038 | 0.598 | 1.333 | 0.971 | 0.292 |
| Bilgi | 0.609 | 0.188 | 0.438 | 1.667 | 0.724 | 0.311 |
| Kyoto | 0.680 | 0.217 | 0.411 | 0.556 | 0.798 | 0.203 |
| Alpaca | 0.660 | 0.133 | 0.500 | 0.571 | 1.060 | 0.311 |
| Steptoe | 0.690 | 0.313 | 0.527 | 0.750 | 0.745 | 0.217 |
| Millie | 0.871 | 0.250 | 0.402 | 0.400 | 0.905 | 0.147 |
| GW 2613 | 0.830 | 0.176 | 0.627 | 1.750 | 1.292 | 0.398 |
| GW 2569 | 0.772 | 0.188 | 0.366 | 0.250 | 0.543 | 0.241 |
| Diamond | 0.686 | 0.042 | 0.425 | 0.750 | 0.679 | 0.271 |
| CIho 1,1650 | 0.732 | 0.038 | 0.304 | 0.400 | 1.176 | 0.260 |
| Alissa | 0.830 | 0.045 | 0.412 | 0.600 | 0.802 | 0.150 |
| Sonate | 0.600 | 0.158 | 0.506 | 0.833 | 0.986 | 0.288 |
| Miller | 0.821 | 0.417 | 0.317 | 0.500 | 0.859 | 0.277 |
| Elbany | 0.714 | 0.111 | 0.402 | 0.250 | 0.585 | 0.142 |
| Theresa | 1.047 | 0.227 | 0.434 | 0.875 | 0.757 | 0.150 |
| BYDV 6 | 1.205 | 0.294 | 0.553 | 1.000 | 0.637 | 0.187 |
| Mascara | 0.840 | 0.250 | 0.446 | 0.667 | 0.692 | 0.249 |
| Laurena | 0.806 | 1.000 | 0.350 | 0.625 | 0.814 | 0.313 |
| Passion | 0.752 | 0.214 | 0.383 | 0.750 | 0.856 | 0.426 |
| Morex | 0.606 | 0.214 | 0.529 | 1.000 | 0.978 | 0.327 |
| Erginel | 1.259 | 0.188 | 0.474 | 0.250 | 0.759 | 0.191 |
| Vanessa | 0.593 | 0.100 | 0.574 | 2.000 | 0.733 | 0.246 |
| Banteng | 0.673 | 0.200 | 0.468 | 1.250 | 0.449 | 0.244 |
| Estrél | 0.804 | 0.273 | 0.535 | 0.375 | 1.104 | 0.464 |
| Madou | 0.767 | 0.125 | 0.436 | 1.400 | 1.125 | 0.343 |
| Existenz | 0.722 | 0.250 | 0.521 | 0.714 | 1.216 | 0.380 |
| Monroe | 0.765 | 0.333 | 0.350 | 0.750 | 0.904 | 0.348 |
| Kamoto | 0.808 | 0.556 | 0.222 | 0.500 | 0.946 | 0.674 |
| IG_132606 | 0.825 | 0.182 | 0.529 | 0.333 | 0.813 | 0.357 |
| Mammut | 0.750 | 0.143 | 0.382 | 0.750 | 0.990 | 0.453 |
| Labea | 0.848 | 0.500 | 0.563 | 0.667 | 0.765 | 0.608 |
| Alraune | 1.102 | 0.500 | 0.382 | 0.333 | 0.724 | 1.645 |
| Tokak 157/37 | 0.990 | 1.667 | 0.303 | 0.250 | 0.783 | 1.258 |
| IG_3,9915 | 1.087 | 1.250 | 0.566 | 0.833 | 0.711 | 0.520 |
| Uschi | 1.050 | 0.600 | 0.532 | 0.800 | 0.533 | 0.684 |
| Petra | 0.871 | 0.500 | 0.825 | 0.833 | 0.727 | 0.379 |
| IG_124017 | 0.831 | 0.500 | 0.402 | 0.750 | 0.426 | 0.368 |
| Tambar 500 | 0.873 | 0.385 | 0.461 | 1.000 | 0.783 | 0.203 |
| Cabrio | 0.852 | 0.625 | 0.308 | 0.500 | 0.524 | 0.076 |
| Jessica | 0.788 | 0.833 | 0.474 | 0.571 | 1.004 | 0.556 |
| Angela | 0.774 | 0.200 | 0.529 | 1.250 | 1.624 | 0.331 |
| IG_4,0107 | 0.980 | 0.357 | 0.450 | 1.200 | 0.652 | 0.181 |
| Ermo | 0.776 | 0.188 | 0.477 | 0.833 | 0.873 | 0.117 |
| Malta | 0.843 | 0.200 | 0.372 | 0.667 | 0.891 | 0.100 |
| Magie | 0.930 | 0.143 | 0.402 | 0.429 | 0.891 | 0.205 |
| Esterel | 0.806 | 0.278 | 0.461 | 1.250 | 0.981 | 0.212 |
| Gilberta | 0.806 | 1.000 | 0.360 | 1.000 | 0.801 | 0.324 |
| HOR 443 | 0.600 | 0.438 | 0.439 | 0.600 | 1.322 | 0.291 |
| Rocca | 0.959 | 0.600 | 0.422 | 1.500 | 1.113 | 0.439 |
| IG_38660 | 0.804 | 0.300 | 0.515 | 0.857 | 2.177 | 0.617 |
| Mombasa | 0.990 | 1.250 | 0.431 | 0.571 | 1.222 | 0.341 |
| AC Alberte | 0.890 | 0.833 | 0.566 | 0.800 | 0.737 | 0.321 |
| CIho 11878 | 0.673 | 0.231 | 0.320 | 0.500 | 1.300 | 0.372 |
| LW 96W139-01 | 0.967 | 0.350 | 0.505 | 1.200 | 1.039 | 0.324 |
| GW 2611 | 0.894 | 0.857 | 0.303 | 0.667 | 0.905 | 0.392 |
| Elektra | 0.856 | 0.278 | 0.350 | 0.750 | 0.730 | 0.542 |
| Affair | 0.840 | 0.500 | 0.563 | 1.500 | 0.484 | 0.303 |
| Gerbel | 0.965 | 0.625 | 0.641 | 1.250 | 0.601 | 0.233 |
| IG_39885 | 0.710 | 0.250 | 0.520 | 0.600 | 1.024 | 0.278 |
| Traminer | 0.832 | 0.150 | 0.500 | 0.750 | 0.513 | 0.261 |
| Dura | 0.782 | 0.077 | 0.480 | 0.800 | 0.695 | 0.417 |
| Fabian | 1.064 | 0.053 | 0.500 | 1.500 | 0.584 | 0.209 |
| Sonja | 0.782 | 0.375 | 0.451 | 0.800 | 1.041 | 0.825 |
| Edda | 0.703 | 0.625 | 0.663 | 0.667 | 1.025 | 0.267 |
| SW 16199 | 1.103 | 0.833 | 0.451 | 0.750 | 0.824 | 0.689 |
| Grete | 0.743 | 0.333 | 0.622 | 1.500 | 0.864 | 0.232 |
| Ogra | 0.841 | 0.125 | 0.467 | 0.750 | 0.869 | 0.293 |
| Reni | 0.774 | 0.083 | 0.708 | 1.667 | 0.719 | 0.356 |
| Nebelia | 0.742 | 0.077 | 0.825 | 0.857 | 0.905 | 0.127 |
| Naomie | 0.814 | 0.333 | 0.681 | 0.571 | 0.334 | 0.188 |
| Angora | 0.849 | 0.167 | 0.620 | 0.857 | 0.700 | 0.217 |
| Finita | 0.717 | 0.250 | 1.193 | 1.750 | 1.327 | 0.431 |
| Kaskade | 0.814 | 1.750 | 0.526 | 1.667 | 0.593 | 1.663 |
| BR 4645 a | 0.840 | 0.118 | 0.532 | 1.667 | 1.880 | 1.455 |
| Marinka | 0.939 | 0.250 | 0.492 | 0.750 | 0.714 | 0.131 |
| Artist | 0.825 | 0.333 | 0.568 | 1.200 | 0.789 | 0.376 |
| Lenta | 0.773 | 0.179 | 0.789 | 1.400 | 1.183 | 0.341 |
| Goldmine | 0.672 | 0.385 | 0.717 | 1.200 | 0.968 | 0.304 |
| Vertikale | 0.761 | 0.556 | 0.576 | 0.800 | 0.826 | 0.177 |
| ID-403 | 0.750 | 0.263 | 0.515 | 0.833 | 1.122 | 0.468 |
| IG_38658 | 1.548 | 0.192 | 0.522 | 0.750 | 0.850 | 0.108 |
| Duet | 0.825 | 0.368 | 0.720 | 0.500 | 0.557 | 0.264 |
| Tessy | 0.764 | 0.500 | 0.609 | 0.286 | 0.439 | 0.230 |
| IG_40094 | 0.804 | 0.833 | 0.641 | 0.857 | 0.769 | 0.275 |
| Cebeco 03248 | 0.785 | 0.389 | 0.554 | 0.833 | 0.740 | 0.190 |
| NSL 01-6132 | 0.667 | 0.556 | 0.620 | 0.714 | 0.593 | 0.144 |
| Vertikale | 0.943 | 0.300 | 0.481 | 0.667 | 0.795 | 0.441 |
| IG_110751 | 1.020 | 0.200 | 0.500 | 0.600 | 0.695 | 0.399 |
| Corona | 0.742 | 0.251 | 0.376 | 0.518 | 0.848 | 0.364 |
| Brunhild | 0.786 | 0.295 | 0.42 | 0.562 | 0.892 | 0.408 |
| Cleopatra | 0.824 | 0.333 | 0.458 | 0.600 | 0.930 | 0.446 |
| IG_39918 | 0.686 | 0.154 | 0.438 | 1.200 | 1.035 | 0.342 |
| IG_119451 | 0.832 | 0.200 | 1.096 | 3.000 | 1.002 | 0.997 |
| BYDV 15 | 0.772 | 0.167 | 0.581 | 0.500 | 0.713 | 0.234 |
| CM 4113 | 0.645 | 0.071 | 0.356 | 0.333 | 0.687 | 0.313 |
| Tapir | 1.136 | 0.182 | 0.787 | 0.400 | 0.974 | 0.400 |
List of significant SSR markers associated with six drought-related traits measured in drought-stressed environment over two growing seasons.
| Phenotypic trait | Marker | Chr. | Position (cM)a |
Prob. b | R2 (%)c | Effect d |
| DTH | GBM1200 | 124.80 | 2H | *** | 10.45 | M |
| GBM1012 | 149.81 | 2H | ** | 9.12 | M*T | |
| GBM1110 | 60.27 | 3H | *** | 10.06 | M | |
| GBM1420 | 152.53 | 3H | *** | 13.23 | M | |
| HVM40 | 22.40 | 4H | *** | 10.10 | M*T | |
| GBMS087 | 41.26 | 4H | ** | 6.85 | M*T | |
| Bmag0751 | 42.87 | 5H | *** | 22.78 | M | |
| GBM1506 | 75.45 | 5H | ** | 8.18 | M | |
| GMS002 | 183.75 | 5H | *** | 11.53 | M | |
| EBmac0602 | 75.42 | 6H | ** | 10.20 | M | |
| GBMS111 | 83.80 | 7H | *** | 9.09 | M*T | |
| Bmag0120 | 97.00 | 7H | *** | 5.08 | M | |
| GBMS183 | 154.36 | 7H | *** | 11.61 | M | |
| PH | GBMS017 | 75.08 | 1H | ** | 9.33 | M |
| Bmag0711 | 79.52 | 2H | *** | 10.78 | M*T | |
| GBMS046 | 49.46 | 3H | ** | 11.04 | M | |
| GBM1110 | 60.27 | 3H | *** | 24.09 | M*T | |
| HVM60 | 73.19 | 3H | *** | 9.46 | M*T | |
| GBMS038 | 131.31 | 3H | ** | 6.54 | M | |
| GBM1420 | 152.53 | 3H | ** | 9.67 | M | |
| HVM40 | 22.40 | 4H | *** | 10.97 | M | |
| EBmac0788 | 97.67 | 4H | *** | 11.11 | M | |
| Bmag0113i | 160.00 | 5H | ** | 10.09 | M*T | |
| GBMS180 | 70.16 | 6H | *** | 11.07 | M | |
| GBMS226 | 62.09 | 7H | ** | 10.19 | M | |
| GBMS111 | 83.80 | 7H | *** | 10.53 | M*T | |
| Bmag0120 | 97.00 | 7H | ** | 11.20 | M | |
| GBMS183 | 154.36 | 7H | *** | 10.40 | M | |
| NoT | GBMS062 | 20.50 | 1H | ** | 13.11 | M |
| GBM1187 | 19.51 | 2H | *** | 9.89 | M*T | |
| Bmag0711 | 79.52 | 2H | ** | 10.56 | M*T | |
| GBM1073 | 8.94 | 3H | ** | 12.34 | M | |
| Bmag0013 | 113.70 | 3H | ** | 21.18 | M*T | |
| Bmag0853 | 144.10 | 3H | *** | 9.73 | M | |
| GBM1420 | 152.53 | 3H | ** | 6.49 | M*T | |
| GBMS119 | 122.09 | 5H | *** | 9.90 | M*T | |
| GBMS180 | 70.16 | 6H | ** | 9.11 | M | |
| GBM1126 | 8.80 | 7H | *** | 12.33 | M | |
| SL | HVM60 | 73.19 | 3H | ** | 10.98 | M |
| GBM1420 | 152.53 | 3H | *** | 9.65 | M | |
| Bmag0740 | 50.86 | 4H | *** | 11.16 | M | |
| GBM1506 | 75.45 | 5H | *** | 26.34 | M | |
| GBMS077 | 144.93 | 5H | ** | 9.76 | M | |
| Bmag0113i | 160.00 | 5H | *** | 9.28 | M | |
| GBMS180 | 70.16 | 6H | *** | 11.19 | M | |
| EBmac0602 | 75.42 | 6H | *** | 9.92 | M | |
| TKW | Bmac0399 | 28.86 | 1H | ** | 11.23 | M |
| GBMS017 | 75.08 | 1H | *** | 12.70 | M | |
| GBMS053 | 120.62 | 1H | ** | 7.95 | M | |
| Bmag0711 | 79.52 | 2H | ** | 10.76 | M | |
| GBM1408 | 89.44 | 2H | ** | 9.64 | M*T | |
| GBMS046 | 49.46 | 3H | *** | 11.22 | M | |
| HVM40 | 22.40 | 4H | ** | 12.90 | M*T | |
| TKW | EBmac0788 | 97.67 | 4H | *** | 27.84 | M |
| EBmac0602 | 75.42 | 6H | ** | 9.87 | M | |
| GBM1022 | 105.26 | 6H | ** | 6.12 | M*T | |
| Bmag0007 | 20.62 | 7H | *** | 12.43 | M*T | |
| GBMS111 | 83.80 | 7H | *** | 9.81 | M | |
| GBMS183 | 154.36 | 7H | *** | 9.37 | M | |
| SPY | GBMS017 | 75.08 | 1H | ** | 7.33 | M*T |
| GBMS053 | 120.62 | 1H | *** | 6.94 | M*T | |
| GBM1408 | 89.44 | 2H | *** | 11.17 | M | |
| GBM1200 | 124.80 | 2H | ** | 8.73 | M*T | |
| Bmag0749 | 147.93 | 2H | *** | 9.35 | M | |
| GBM1012 | 149.81 | 2H | ** | 21.60 | M*T | |
| GBMS046 | 49.46 | 3H | *** | 19.45 | M*T | |
| GBM1110 | 60.27 | 3H | *** | 5.67 | M*T | |
| GBMS038 | 131.31 | 3H | ** | 7.66 | M | |
| GBM1420 | 152.53 | 3H | *** | 9.80 | M | |
| Bmag0740 | 50.86 | 4H | ** | 7.77 | M | |
| Bmag0353 | 65.01 | 4H | *** | 6.55 | M*T | |
| GBM5210 | 72.93 | 4H | ** | 7.33 | M*T | |
| EBmac0788 | 97.67 | 4H | *** | 10.12 | M | |
| GBM5028 | 27.41 | 5H | *** | 6.85 | M | |
| Bmag0113i | 160.00 | 5H | *** | 11.70 | M*T | |
| GBM1212 | 55.10 | 6H | *** | 7.64 | M | |
| GBMS180 | 70.16 | 6H | *** | 6.22 | M | |
| GBM1022 | 105.26 | 6H | ** | 5.41 | M*T | |
| GBM1274 | 123.45 | 6H | ** | 7.84 | M | |
| GBMS226 | 62.09 | 7H | ** | 23.22 | M | |
| GBMS111 | 83.80 | 7H | *** | 22.10 | M*T | |
| Bmag0120 | 97.00 | 7H | ** | 5.09 | M*T | |
| GBM1362 | 123.22 | 7H | *** | 9.76 | M | |
| GBMS017 | 75.08 | 1H | ** | 7.33 | M*T |
a cM map position according to the map reported by Marcel et al. 2007 [30].
b Level of significance: ** P < 0.01 and *** P < 0.001.
c Variation of a trait explained by a marker and M × E interaction effect.
d Main effect of a marker (M) and marker environment interaction (M × E).
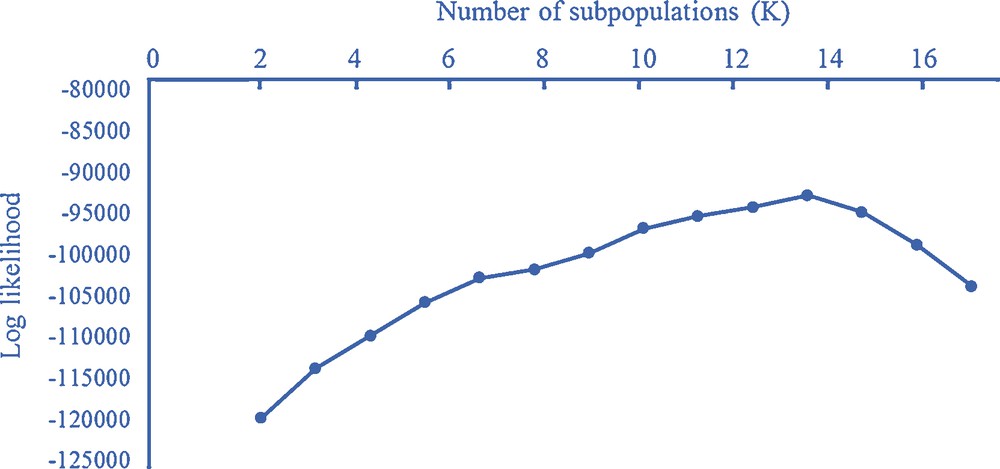
Graph of ΔK values to determine the ideal number of clusters present in 107 barley accessions using 76 SSR markers. Higher values indicate the best number of cluster (subpopulations, K), explaining the data.
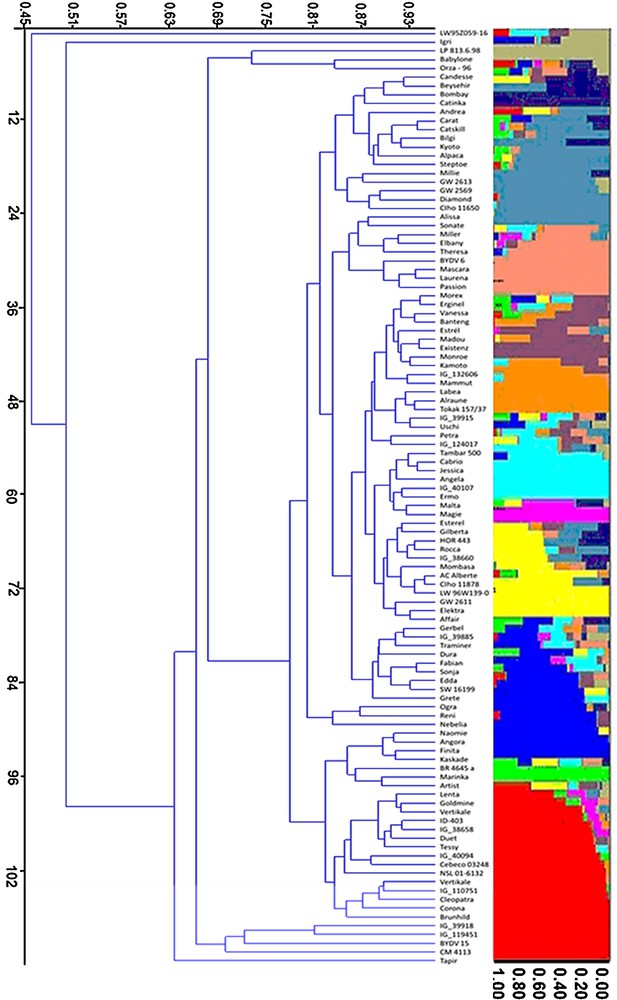
Distribution of 107 accessions within the 12 groups. Each individual is represented by a single horizontal line in colored part right to the diagram broken into K differently colored segments. The length of the colored segments is proportional to each one of the K inferred clusters or subgroups. The part below the diagram represents cluster analysis based on the DICE dissimilarity index and the unweighted neighbor-jointing method.
3.3 Days to heading
Thirteen significant marker–trait associations were identified and located on all chromosomes except 1H. Four of the thirteen marker–trait associations exhibited marker × trait (M × E) interaction effects, while the remaining eight marker–trait associations showed marker main effects. The SSR marker with the maximum phenotypic variance (22.78%) associated with the heading date was Bmag0751 on chromosome 5H at a position of 42.87 cM (Table 3).
3.4 Plant height
Fifteen marker–trait associations were found for plant height on all the seven chromosomes (Table 3). Of these, ten markers showed significant marker main effects (M) and the other five showed significant M × T interactions. The maximum phenotypic variance (R2 = 24.09%) explained by the SSR marker GBM1110 located on chromosome 3H at a position of 60.27 cM (Table 3).
3.5 Number of tillers/plant (NoT)
Ten QTLs located on all chromosomes except 4H were identified to be associated with the number of tillers, of which five revealed significant marker main effects (M) while the other five revealed significant M × T interactions. The highest phenotypic effect (R2 = 21.18%) was recorded for marker Bmag0013 on chromosome 7H (113.70 cM) (Table 3).
3.6 Spike length
Eight marker–trait associations were identified for spike length on chromosomes 3H, 4H, 5H and 6H. All marker–trait associations showed significant marker main effects only. The SSR marker GBM1506 located on chromosome 5H (75.45 cM) exhibited the maximum phenotypic variance (R2 = 26.34%) associated with spike length (Table 3).
3.7 Thousand kernel weight
A total of 13 marker–trait associations were identified on all chromosomes except chromosome 5H. Four marker–trait associations showed a significant M × T interaction while, on the contrary, the remaining 9 marker–trait associations exhibited a significant marker main effect. The explained highest phenotypic variance (R2 = 27.84%) was detected with marker EBmac0788 on chromosome 4H (97.67 cM, Table 3).
3.8 Single plant yield (SPY)
Twenty-four chromosomal regions, as defined by SSRs, distributed throughout the genome on all chromosomes revealed significant trait associations with single plant yield. Eleven marker–trait associations were significant for the marker main effect and thirteen associations were environment-dependent (Table 3). Five markers GBM1012 (chromosome 2H, 149.81 cM), GBMS046 (chromosome 3H, 49.46 cM), EBmac0788 (chromosome 4H, 97.67 cM), GBMS226 (chromosome 7H, 62.09 cM) and GBMS111 (chromosome 7H, 83.80 cM)) exhibited the maximum associations between phenotypic variance and molecular markers as indicated by R2 values (21.60%, 19.45%, 23.22%, 22.10% and 16.10%, respectively) (Table 3).
4 Discussion
In classical QTL analysis, many factors affect the detection of QTLs including the type, the size, and the structure of the population, the number of environments sampled, the calculation method, and the number of molecular markers [25]. Association mapping is a powerful strategy for fine mapping of quantitative traits and is dependent on the structure of linkage disequilibrium of alleles at different loci [37]. In association mapping, the software TASSEL is employed to analyze the association between markers alleles and quantitative traits to identify a QTL associated with a single marker using a fixed effects linear model. Each of the traits-marker associations is performed individually [38]. The advantages of association mapping include flexibility in terms of the type of population to which it is applied [39].
In the current study, we used a limited number of markers (76 SSRs); however we recognized that this is limited genome coverage and for a genome-wide association study, a much larger number of markers should be used in the future. Choice of germplasm is one of the key factors determining the resolution of association mapping in plants. To detect more alleles, germplasm selected should include a wide spectrum of diversity of the genepool with more extensive recombination in the history to allow a high level of resolution [40]. A structured barley population consists of 107 accessions which display enormous differences in morphological characters and agronomic traits and represent a wide range of variability for drought tolerance associated traits was used in this study. This representative set of accessions was evaluated for yield and yield-contributing traits under drought-stress conditions including: days to heading (DH), plant height (PH), number of tillers/plant (NoT), spike length (SL), thousand kernel weight (TKW), single plant yield (SPY). The evaluated yield and yield-contributing traits respond differently to water deficit at the vegetative-reproductive stage. The TASSEL software was employed and identified 83 marker–trait associations (QTL) for the studied traits, which is within the range (11–159) of QTLs identified by the classical QTL mapping in barley [34]. Noteworthy, our results revealed that several chromosomal regions significantly influence more than one trait, suggesting a possible existence of pleiotropic or indirect effects. This is more obvious on chromosomes 3H (marker GBM1420 associated with DTH, PH, NoT, SL and SPY) and 7H (marker GBMS111 associated with DTH, PH, TKW and SPY).
In barley, numerous studies have been published employing linkage mapping in the identification of QTLs responsible for important quantitative traits including yield, yield-contributing traits and tolerance to abiotic stresses. Most of these QTL were detected in balanced populations derived from single crosses, e.g., F2 or doubled haploid (DH). Many of the markers associated with phenotypic traits under drought conditions are located in regions where classical QTLs had previously been identified [19–21,41–43]. Some of the previously identified QTLs by using linkage mapping in barley for different traits are in accordance with the results reported in this study. For instance, using linkage mapping, von Korff et al. [21] identified two major QTLs for grain yield on chromosome 6H (Qgy-tera_6H.a and Qgy-tera_6H.b, R2 = 13% and 17.90%, respectively) which comprise two markers (GBMS180, 70.16 cM and GBM1022, 105.26 cM) significantly associated with SPY in this study, a major QTL on chromosome 6H (71.80 cM, R2 = 13.60%) for TKW colocalized with marker EBmac0602, which exhibited a significant association with TKW, and a major QTL on chromosome 6H (71.80 cM, R2 = 16.40%) for PH colocalized with marker GBMS180 revealed a significant association with PH. Sayed [20] identified two QTLs for plant height and number of tillers on chromosome 2H encompass marker Bmag0711, which is significantly associated with PH and NoT. Further, the author identified two QTLs for thousand grain weight on chromosomes 1H and 6H colocalized with markers GBMS053 and EBmac0602, respectively, which exhibited significant association with TKW. Similarly, three markers located on chromosomes 3H (GBMS046 and GBM1110) and 6H (GBMS180) revealed that significant association with SPY seems to locate with the chromosomal regions of three QTLs identified for grain yield/plant on chromosomes 3H and 6H [20]. Naz et al. [19] identified five QTLs responsible for number of tillers located on chromosomes 1H, 2H, 4H and 5H.
There have been only a few studies on the application of association mapping for drought tolerance in barley. For instance, Inostroza et al. [25] identified twelve SSR-trait associations for plant height under drought-stress conditions on chromosomes 1H, 2H, 4H, 5H, 6H and 7H, and twelve significant associations with plant yield on chromosomes 1H, 2H, 3H, 5H, 6H and 7H, which is in accordance with the data presented here. Besides, Pauli et al. [44] detected five marker–trait associations for heading date located on chromosomes 1H, 2H, 3H, 4H, and 7H, and nine significant marker–trait associations for PH located on all of the chromosomes except 2H. Interestingly, our results is very comparable with those from Lakew et al. [27], who identified 16 significant associations between markers and DTH located on all chromosomes except 1H, twenty marker–trait associations for PH located on all chromosomes, eight significant association between markers and spike length located on chromosomes 3H, 4H, 5H and 6H, 17 significant marker–trait associations for TKW on all chromosomes, except 5H, and 30 significant associations between markers and grain yield/plant on all chromosomes. Comadran et al. [45] performed a similar association mapping study on a structured barley population, which displays a historical survey of barley diversity in Mediterranean environments. The study exhibited significant marker–trait associations with a great proportion of the genetic variations underlying different mechanisms for adaptation to drought-prone environments.
In summary, employing association analysis using software TASSEL 83, significant associations between SSR markers and six yield and yield contributing traits under drought conditions have been evidenced. Furthermore, the data showed that some markers exhibited significant associations with several phenotypic traits, indicating a possible existence of pleiotropic or indirect effects. The results presented here revealed that wild barley is a valuable source for improving yield and yield-contributing traits for drought tolerance through enriching the gene pool of cultivated barley. Association mapping studies on the model plants Oryza and Lycopersicon revealed that most of the genetic diversity in these taxa was found in the gene pool of the wild species [46]. Similar results have been shown for Hordeum [6]. Consequently, it is most likely that at least some of the marker–trait associations (QTLs) detected in this study may be a good source for enriching the barley gene pool and create initial material and varieties with certain distinctive features. Moreover, the results emphasize that association mapping is a powerful tool in improving barley breeding via precise identification of markers significantly associated with phenotypic traits, which is vitally important for marker-assisted breeding.
Disclosure of interest
The author declares that he has no competing interest.
Acknowledgments
The author gratefully acknowledge the National Small Grains Germplasm Research Facility, USDA, ARS, Idaho, USA for providing the accessions used in this work. The author gratefully thanks Ahmed Mousa Salem, Ahmed Mahmoud Ali and Ibrahim Mohamed Ali for their excellent technical assistance.