

1 Introduction
In recent years, many Polymerase Chain Reaction (PCR)-based molecular markers, such as Internal Transcribed Spacer Region (ITS) [1,2], Random Amplified Polymorphic DNA (RAPD) [3–5], and Inter-Simple Sequence Repeat (ISSR) [6–9] markers have been developed and tested in genetic studies of various organisms among populations [4,10]. These techniques have been used for the determination of genetic variation in lichens or lichen-forming fungal species and populations [10]. Molecular markers provide the best estimates for genetic diversity that are independent of the effect of various environmental factors [11]. The tolerance ability of lichen [12,13] and fungi to different environmental conditions is predicted as a consequence of their genetic diversity [14,15]. ITS markers have been used for the identification of photobiont species based on only one locus [2]. These photobiont diversity studies have been carried out at the species level using lichen samples from geographically different locations [10]. Photobiont diversity of populations has also been determined in some of these studies [10]. RAPD markers are useful for studying intraspecific species, because of their low cost and especially because they facilitate the preliminary study, which requires a large sample size from each population [4]. RAPD fingerprinting has also been used for intraspecific genetic variation studies in cultures of the mycobionts and photobionts [16]. ISSR-PCR is a technique requiring a single primer based on SSR (microsatellites) markers. SSRs are common in the genome and changes in the SSRs, such as deletion or insertion, lead to ISSR polymorphism [6]. Like RAPD markers [6], ISSRs also have low cost and have been used to investigate the intraspecific genetic variation of lichen-forming fungi [16]. Xanthoria parietina is an easily observed and readily recognized lichenized species, exceedingly common in the world. It has a large number of morphological and ecological variations [14,17]. Therefore, X. parietina has been preferred as a model organism to examine the partitioning of genetic variation [16]. In this study, ITS, RAPD-PCR and ISSR-PCR techniques were compared, using X. parietina populations from a narrow and transition climate zone (Bilecik, Turkey).
2 Materials and methods
2.1 Collecting and DNA isolation
Freshly collected specimens of X. parietina from 10 locations (Table 1) in Bilecik (Turkey) were stored at −20 °C before DNA isolation. DNA was isolated from the photobiont-free lower cortex of young thallus lobes using the PureLink® Plant Total DNA Purification Kit (Invitrogen, Carlsbad, CA, USA). The quantity and purity of the DNA sample was determined using a NanoDrop Spectrophotometer (Shimadzu, Kyoto, Japan).
Collecting locations and co-ordinates of X. parietina populations.
| Population | Collector | Collecting site | Co-ordinates |
| Pop-1 (XpNo1) | D. Ozakca | Dereboyu Village | N 40° 02′ 45.9″ E 030° 12′ 33.8″ |
| Pop-2 (XpNo2) | I. Poyraz | Orhangazi Quarter | N 40° 06′ 18.3″ E 029° 59′ 12.7″ |
| Pop-3 (XpNo3) | I. Poyraz | Pazaryeri Borough Rubber Factory | N 39° 58′ 41.7″ E 029° 58′ 30.7″ |
| Pop-4 (XpNo4) | I. Poyraz | Bozüyük Toprak Demirdöküm Factory | N 39° 51′ 27.2″ E 030° 13′ 49.32″ |
| Pop-5 (XpNo5) | I. Poyraz | Bozüyük Borough, Belt line | N 39° 53′ 52.1″ E 030° 03′ 11.1″ |
| Pop-6 (XpNo6) | I. Poyraz | Near to Sorgun River | N 40° 06′ 02.1″ E 029° 59′ 47.2″ |
| Pop-7 (XpNo7) | I. Poyraz | Karaköy Village | N 39° 59′ 26.7″ E 029° 59′ 42.8″ |
| Pop-8 (XpNo8) | I. Poyraz & D. Ozakca | Dömez Village | N 40° 04′ 03″ E 030° 08′ 08″ |
| Pop-9 (XpNo9) | I. Poyraz | Tünel Site between Bilecik-Bozüyük | N 40° 01′ 50.0″ E 030° 01′33.4″ |
| Pop-10 (XpNo10) | I. Poyraz & D. Ozakca | Söğüt Borough | N 40° 05′ 36.5″ E 0.30° 12′ 29″ |
2.2 ITS regions analysis
Amplification of ITS fragments from genomic DNA was carried out in a total reaction volume of 25 μL, containing 8 ng of genomic DNA, IX Taq polymerase reaction buffer, 1.5 mM of MgCl2, 0.1 mM of each one of the dNTPs (dATP, dCTP, dGTP, and dTTP), 0.2 mM of ITS forward primer (5′GAAATCATCGAATCTTTGAACGCAG3′), 0.2 mM of reverse primer (5′CGAGGTCAATCATTGGAATTTGG3′) and 1 U of Taq DNA-polymerase (Fermentas. Maryland, USA). ITS primers are fungal-specific. Amplifications were performed in a Techne TC Plus thermocycler (Techne Inc., Burlington, USA) programmed as follows: 3 min of denaturation at 95 °C and 40 cycles of 1 min each of denaturation at 94 °C, 75 s of annealing at 53.5 °C for ITS amplification, and a 75-s extension at 72 °C, followed by a final extension at 72 °C for 7 min. Amplification products were separated on 1.2% agarose gel containing ethidium bromide (0.5 ug/mL). The gel was visualized under UV light and digitally photographed with a Gel Logic 212Pro imaging system (Carestream, Rochester, NY). ITS-PCR products were digested overnight at 37 °C with 10 units of restriction enzymes (AluI, BamHI, EcoRI, HindlII, SmaI, SalI) in a buffered medium used according to the manufacturer's recommendation (Fermentas). The digested DNA samples were electrophoresed on 1.2% agarose gel at 5 V/cm and photographed by using a Gel Logic 212Pro imaging system (Carestream). The molecular weights of ITS-PCR products were estimated using a 100 bp Plus DNA Ladder (Fermentas).
2.3 RAPD-PCR analysis
RAPD analysis was performed according to the method of Williams et al. [18]. The initial primer screening was carried out with 10 primers after screening; 8 primers that amplified clear, reproducible banding patterns were used for further analysis (Table 2). PCR amplifications were performed in 25 μL of a reaction mixture containing 15 ng of template DNA, 1X Taq polymerase buffer, and 1 U of Taq polymerase (Fermentas), 2.0 mM of MgCl2, 1 mM of dNTP, and 1 μM of primer. The amplifications were carried out in a Techne TC Plus thermocycler (Techne Inc.) that was programmed for the initial denaturation step at 85 °C for 15 s and at 92 °C for 2 min, followed by 45 cycles at 94 °C for 1 min, at 32–36 °C for 1 min, at 72 °C for 2 min, and a final elongation at 72 °C for 7 min. PCR reactions for RAPD primers were repeated twice to ensure the reproducibility of the amplified products. The PCR products were separated on a 1.5% agarose gel containing ethidium bromide (0.5 μg/mL) and photographed using a Gel Logic 212Pro imaging system (Carestream). Molecular weights of RAPD-PCR products were estimated using a 100 bp Plus DNA Ladder (Fermentas).
RAPD banding pattern of 10 X. parietina populations.
| Primer name | Sequence | Total bands | Polymorphic bands | Polymorphism (%) |
| P-9 | GGGAAGAGAG | 6 | 5 | 83 |
| P-11 | GGCCGATGAT | 21 | 21 | 100 |
| P-13 | ACCGGCTTGT | 7 | 6 | 86 |
| OPA-01 | CAGGCCCTTC | – | – | – |
| OPA-06 | GGTCCCTGAC | 19 | 18 | 95 |
| OPA-07 | GGTCCCTGAC | 10 | 8 | 80 |
| OPA-11 | CAATCGCCGT | 10 | 8 | 80 |
| OPA-20 | GTTGCGATCC | 8 | 8 | 100 |
| OPC-04 | CCGCATCTAC | – | – | – |
| OPD-07 | TTGGCACGGG | 10 | 10 | 100 |
2.4 ISSR-PCR analysis
The initial primer screening for ISSR-PCR was carried out with 12 primers after screening for all samples; 8 primers that amplified clear, reproducible banding patterns were used for further analysis (Table 3). Amplification of ISSR fragments from genomic DNA was carried out in a total reaction volume of 25 μL containing 10 ng of template DNA, 1X Taq polymerase reaction buffer, 2 mM of MgCl2, 0.1 mM of each one of dNTPs (dATP, dCTP, dGTP, and dTTP), 0.2 mM of primer and 1 U of Taq DNA-polymerase (Fermentas). Amplifications were performed in a Techne TC Plus thermocycler (Techne Inc.) programmed as follows: 4 min of denaturation at 94 °C and 45 cycles of 45 s each of denaturation at 94 °C, 50-s annealing at 45–60 °C for ISSR amplification, and a 1.5-min extension at 72 °C, followed by a final extension at 72 °C for 7 min. The amplification products were separated on a 1.2% agarose gel containing ethidium bromide (0.5 μg/mL). The gels were visualized under UV light and digitally photographed with Gel Logic 212Pro imaging system (Carestream). The molecular weights of ISSR-PCR products were estimated using a 100 bp Plus DNA Ladder (Fermentas).
ISSR banding pattern of 10 X. parietina populations.
| Primer name | Sequence | Total bands | Polymorphic bands | Polymorphism (%) |
| ISSR-1 | AGAGAGAGAGAGAGAGG | – | – | – |
| ISSR-3 | GTGTGTGTGTGTGTGTC | 14 | 12 | 86 |
| ISSR-4 | ACACACACACACACACC | 27 | 27 | 100 |
| ISSR-6 | GAGAGAGAGAGAGAGAC | 10 | 9 | 90 |
| ISSR-7 | GACAGACAGACAGACA | – | – | – |
| ISSR-9 | GGATGGATGGATGGAT | – | – | – |
| ISSR-814 | CTCTCTCTCTCTCTCTA | 7 | 6 | 86 |
| ISSR-819 | CACACACACACACACAG | 7 | 7 | 100 |
| ISSR-829 | TCTCTCTCTCTCTCTCG | 12 | 12 | 100 |
| ISSR-847 | CACACACACACACACARC | 6 | 5 | 83 |
| ISSR-865 | VHVGTGTGTGTGTGTGT | 8 | 7 | 87.5 |
| ISSR-867 | GGCGGCGGCGGCGGCGGC | – | – | – |
2.5 Data analysis
The bands obtained by ITS, RAPD and ISSR techniques were scored as present (1) or absent (0). Faintly stained bands that are not clearly resolved were not considered in the data collection. Bands with the same migration distance were considered homologous. The genetic similarity matrixes for all methods were calculated using the Jaccard similarity coefficient [19] and created a dendrogram using an unweighted pair-group method with arithmetic mean (UPGMA). The dendrograms from the results of each technique were obtained, and these trees were transferred to locations in the Bilecik map using MS Drawing Program.
3 Results and discussion
3.1 ITS regions analysis
In this study, fungal-specific ITS primers were used. ITS region fragments were amplified by PCR from 10 populations, and one obtained an approximately 445 bp ITS band (Fig. 1). Amplified ITS fragments were digested with AluI, BamHI, EcoRI, HindlII, SmaI and SalI restriction enzymes and various sizes were observed, ranging from 100 bp to 300 bp banding patterns (Fig. 2). The dendrogram, created using the observed bands, was transferred to the Bilecik map and compared with population locations (Fig. 3). The data of our ITS analyses showed that the ITS dendrogram partially matches the population locations on the map. The populations were correctly grouped into two main regions, but discrimination of the close populations was not correct.
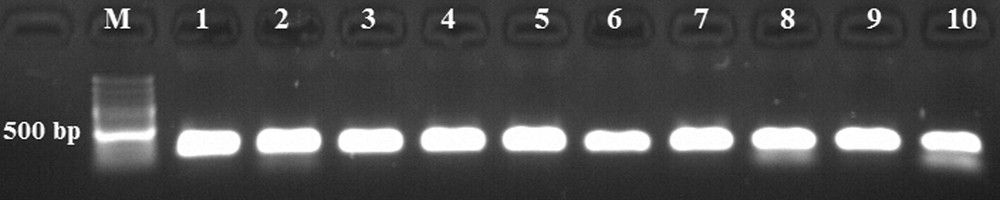
The amplified Internal Transcribed Spacer (ITS) region fragments. M: GeneRuler 100 bp Ladder Plus, 1–10: Xanthoria parietina populations.
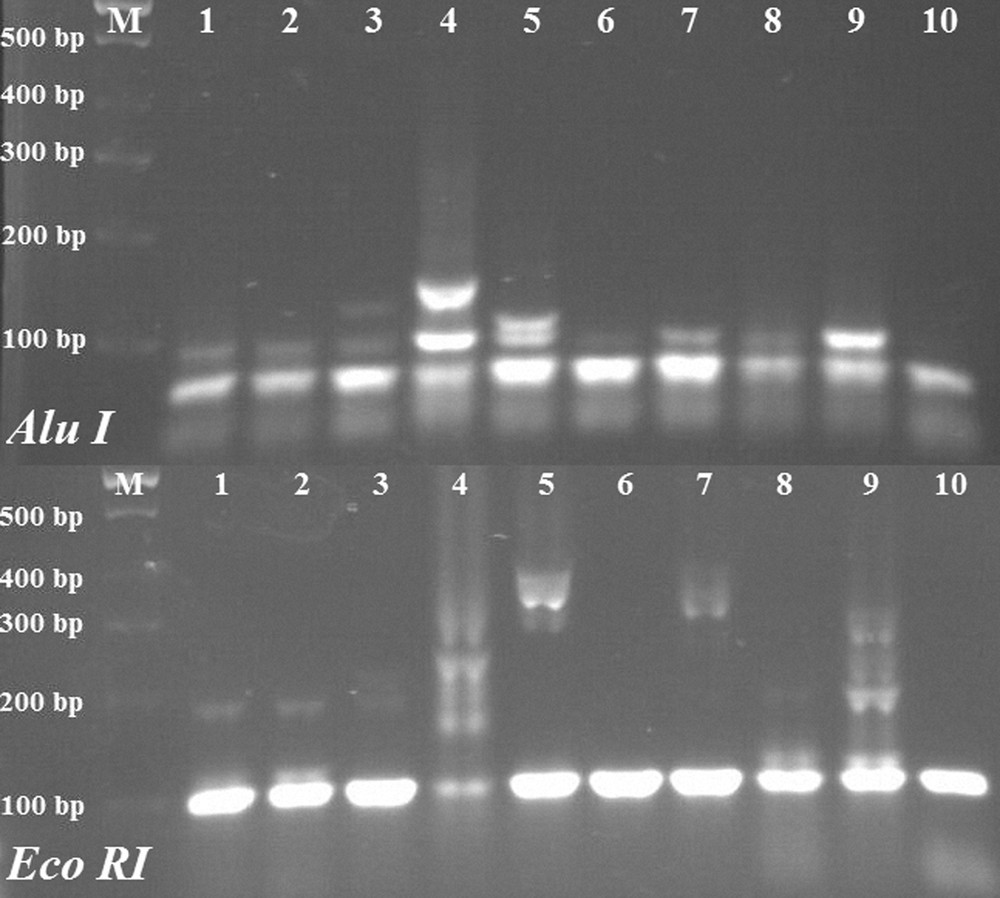
Restriction digestion of Internal Transcribed Spacer (ITS) region fragments with Alu I and EcoRI enzymes and observed banding patterns. M: GeneRuler 100 bp Ladder Plus, 1–10: Xanthoria parietina populations.
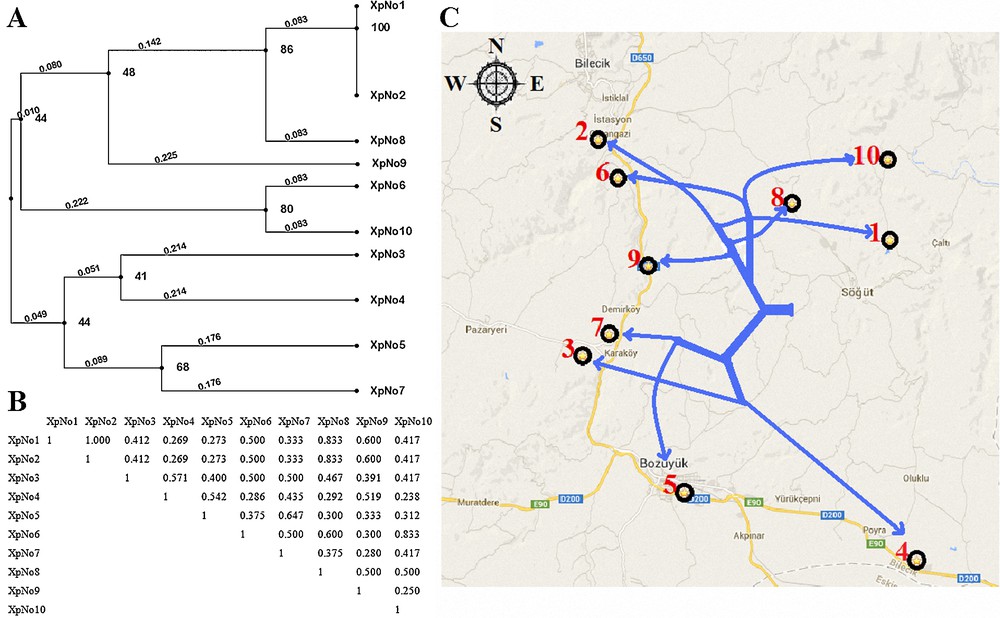
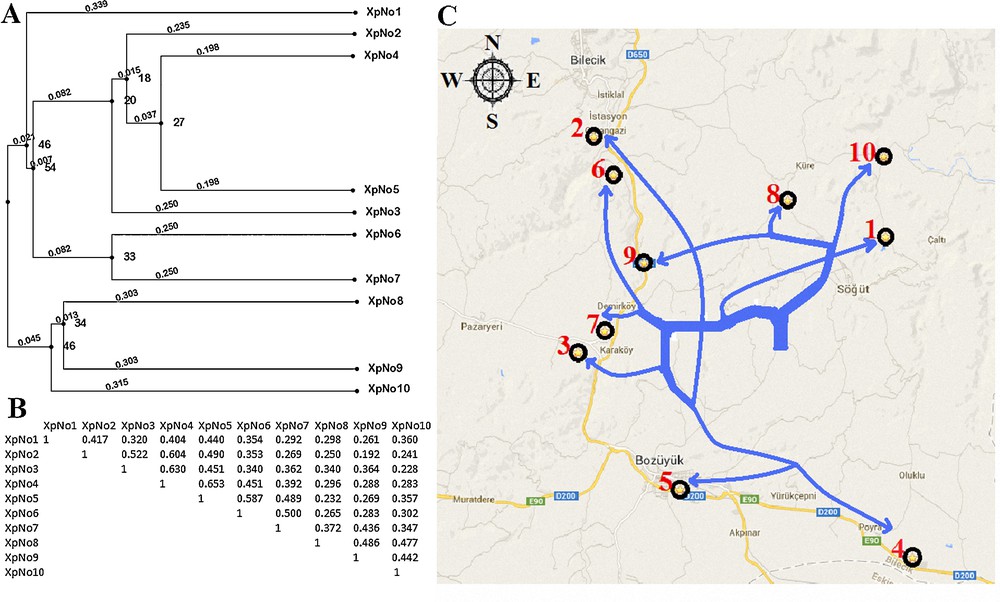
A. Dendrogram of the genetic relationships of 10 Xanthoria parietina populations based on genetic similarity using Internal Transcribed Spacer (ITS) Regions Analysis. B. Jaccard similarity coefficients among X. parietina populations. C. Comparison of the locations on the map according to the dendrogram.
In 2005, Lindblom and Ekman compared the neighbor-joining phylogenetic trees of ITS and inter-genic spacer (IGS) methods in Xanthoria species and demonstrated that the dendrograms obtained with these methods did not match [20]. In 2006, Lindblom and Ekman performed IGS and ITS methods again for determining the genetic diversity of X. parietina populations in central Norway [16]. They demonstrated that pairwise comparisons of populations revealed significant differentiation between populations in different habitats, but not between populations in the same habitat [16]. Bilecik has a transition climate and includes different habitats. On Fig. 3, X. parietina populations were separated into two branches in different habitats as north and south regions. But populations in the same habitat were not separated correctly. The results of our ITS analyses confirmed the results of Lindblom and Ekman [16].
The ITS regions have the highest probability for successful identification of the broadest range of fungi, and ITS markers are a popular phylogenetic marker in certain groups [2]. The lichen-forming fungi have been preferred over the photoautotrophic inhabitants of lichen thalli, as fungal material in ITS analyses. ITS phylogenies are based on only one locus. But genetic diversity at the sub-specific level is best explored with a multi-locus approach such as fingerprinting techniques (ISSR, RAPD, etc.) [10].
3.2 RAPD-PCR analysis
Amplified fragments were obtained in the molecular weight range from 300 bp to 3.0 kb using RAPD markers (Fig. 4). The dendrogram created using RAPD-PCR band data was transferred to the Bilecik map and compared with population locations (Fig. 5). We observed that the RAPD dendrogram matches the population locations on the map. According to the phylogenetic tree on Fig. 5, the population distribution on the map is partially consistent. The discrimination of close X. parietina populations was successfully performed. But the branching of two populations (pop-1 and pop-2) were abnormal and meaningless. Recent studies have shown that RAPD-PCR is suitable for gaining valuable insights into the genetic diversity at the sub-specific level in X. parietina populations [10]. Itten and Honegger [21] performed a genetic diversity analysis in three X. parietina populations using eight RAPD primers and observed high genetic diversity within populations of X. parietina. Our results confirmed the results of Itten and Honegger. They alleged that that the main causes of the high genetic diversity in X. parietina might be the accumulation of mutations and an intense genotype rather than gene (allele) flow [21]. Lindblom and Ekman [14] demonstrated that RAPD distance matrices based on independently performed band scores are always congruent and that differences never affect the conclusions. They presented that RAPD clearly distinguishes X. parietina and X. aureola. Our results demonstrated that RAPD-PCR analysis is a successful method for the genetic discrimination of close populations in the same habitats. Honegger et al. [17] performed genetic diversity analysis of specimens of X. parietina collected from worldwide locations using RAPD markers. Their results demonstrated that two asunder populations from France and New Zealand are genetically close. Therefore, we may say that RAPD-PCR analysis includes some deflections in the genetic discrimination of populations having high genetic diversity in different habitats.
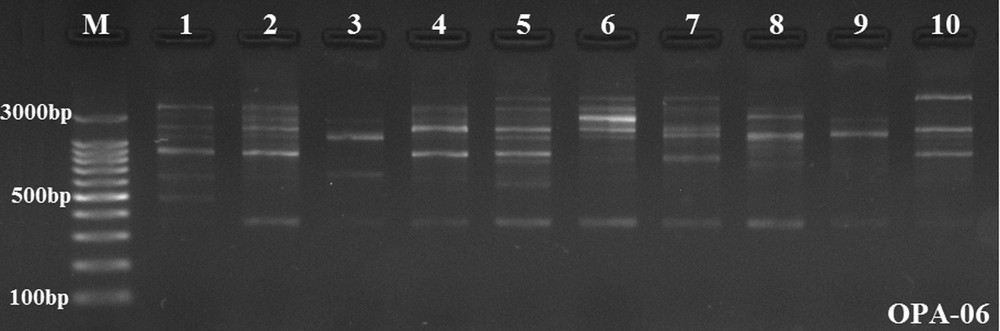
Random Amplified Polymorphic DNA (RAPD) banding patterns in populations of Xanthoria parietina as revealed by OPA-06 primer, M: GeneRuler 100 bp Ladder Plus, 1–10: X. parietina populations.
A. Dendrogram of genetic relationships of 10 Xanthoria parietina populations based on genetic similarity using Random Amplified Polymorphic DNA (RAPD) markers. B. Jaccard similarity coefficients among X. parietina populations. C. Comparison of the locations on the map according to the dendrogram.
3.3 ISSR-PCR analysis
Amplified ISSR fragments from genomic DNA of X. parietina populations of various sizes, ranging from 400 bp to 3000 bp, were observed (Fig. 6). The created dendrogram using ISSR-PCR band data was transferred to the Bilecik map and compared with population locations (Fig. 7). On Fig. 7, it was shown that the results of ISSR-PCR and RAPD-PCR methods are very similar. The branching of population-2 was abnormal and meaningless in phylogenetic dendrograms of both methods. The distribution of the other populations on map according to the phylogenetic tree was relatively consistent. Discrimination of close X. parietina populations was successfully performed with ISSR markers. To date, there has been no study about ISSR fingerprint analyses in populations of X. parietina. A few studies were performed in lichens. Recently, Wongsawad and Peerapornpisal [9] performed ISSR fingerprint analyses in Spirogyra ellipsospora, which is common in northern Thailand. S. ellipsospora is found in a wide range of habitats, as small stagnant water bodies, rivers, and streams. Four Spirogyra sp. and only one S. ellipsospora were used in ISSR fingerprint analyses and a dendrogram was derived from UPGMA analyses. Their ISSR markers separated the five Spirogyra specimens into two distinct clusters. This result corresponds to cluster analysis of the rbcL gene, with fewer differences in the sister clusters [9]. It is known that ISSR-PCR is a successful method in genetic discrimination of close populations in the same habitats. Results of our ISSR-PCR analysis demonstrated the presence of high genetic diversity in X. parietina populations. In addition, the results of the ISSR-PCR method also proved to be similar to those of RAPD-PCR methods. We also observed that both techniques might include some deflections. In contrast to these two methods (ISSR and RAPD), we may say that ITS analysis is a successful method for the genetic discrimination of populations having high genetic diversity in different habitats.
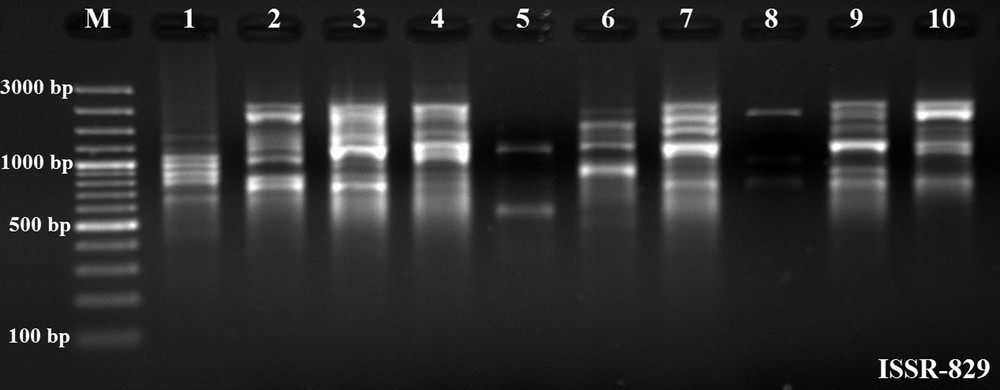
Inter-Simple Sequence Repeat (ISSR) banding patterns in populations of Xanthoria parietina as revealed by ISSR-829 primer, M: GeneRuler 100 bp Ladder Plus, 1–10: X. parietina populations.
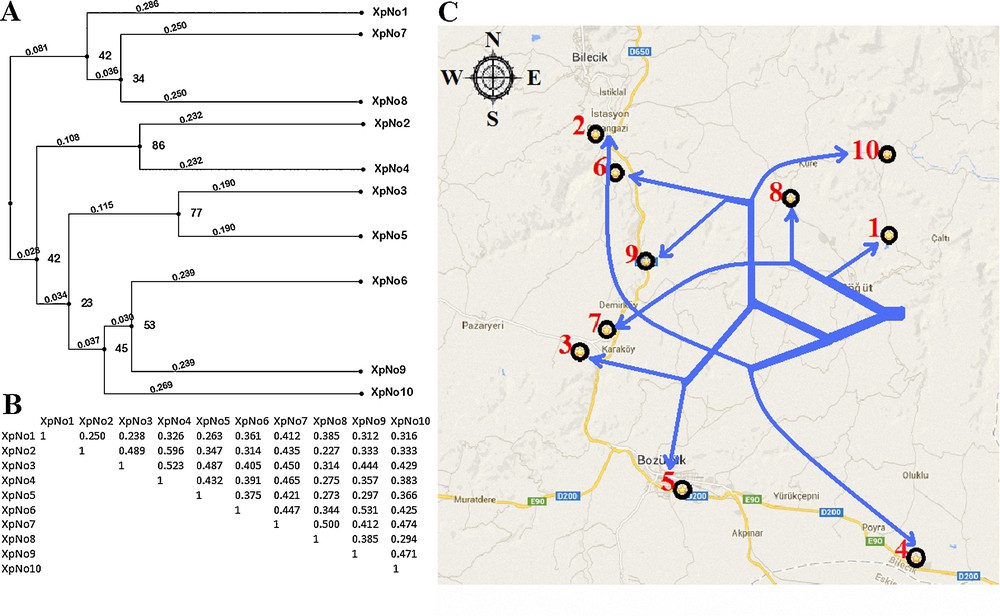
A. Dendrogram of the genetic relationships of 10 Xanthoria parietina populations based on genetic similarity using Inter-Simple Sequence Repeat (ISSR) markers. B. Jaccard similarity coefficients among X. parietina populations. C. Comparison of the locations on the map according to the dendrogram.
4 Conclusion
The results of this study demonstrated that RAPD-PCR and ISSR-PCR methods are more suitable for studies of high genetic diversity species among populations. These two techniques are more sensitive for detecting the genetic differences between closer populations in similar habitats. It has been observed that the discrimination capacity of these two techniques decreases relatively when populations become distant in terms of location. In addition, two asunder populations (pop-2 and pop-4) are genetically closer in the phylogenetic trees of RAPD and ISSR-PCR techniques. These two populations, having similar environmental conditions, are a low possibility. Therefore, this case may be commented as an exception. It has been observed that ITS method is more successful in genetic diversity analyses of more asunder populations. In contrast to ISSR-PCR and RAPD-PCR methods, ITS method provided more clear data in regional genetic discrimination of populations. Consequently, we may say that ITS method is more suitable for genetic diversity analyses of populations in wide geographic areas.
Acknowledgments
The author would like to thank Dr. Dilek Özakça for technical assistance and master pharmacist Ahmet Saraçoğlu for critical reading of manuscript. This study has been supported by the Scientific Research Projects Commission of Bilecik Seyh Edebali University (project No. 2010-02-BİL.03-003).