

1 Introduction
Salinity is a major abiotic stress limiting the growth and productivity of plants in many areas of the world due to the increasing use of poor-quality water for irrigation and soil salinisation. Plant adaptation or tolerance to salinity stress involves complex physiological traits, metabolic pathways, and molecular or gene networks [1]. A comprehensive understanding of how plants respond to salinity stress at different levels and an integrated approach of combining molecular tools with physiological and biochemical techniques are imperative for the development of salt-tolerant varieties of plants in salt-affected areas [2]. Recent research has identified various adaptive responses to salinity stress at molecular and physiological levels, although mechanisms underlying salinity tolerance are far from being completely understood [1,3].
Barley (Hordeum vulgare L.) is the fourth most important cereal crop worldwide, and it has a long history as a model for genetic studies [4]. Both genetic diversity and the adaptation to a broad spectrum of micro-ecological conditions, including water availability, temperature, soil type and altitude have strongly influenced the development of salt tolerance in barley [5]. In order to breed and improve barley cultivars for future needs, it is very important to search for new sources of useful variation and to understand the relationship among cultivated and wild populations, focusing on the centres of barley domestication and diversification. Barley breeding strategies in Egypt include screening of local and exotic materials, crossing blocks, and yield test trials (of exotic plants provided annually by ICARDA, CIMMYT and ACSAD) to support breeding objectives [6].
The breeding process can be enhanced by using the linkage between markers and traits, which enables indirect selection on markers avoiding the phenotypic assessment of traits. Neglecting the heterogeneity of the population structure can lead to spurious association results. Therefore, the stratification of a collection needs to be determined by genotyping the accessions with a sample of neutral DNA markers. The first DNA markers map the barley genome based on SSR/SNP was [7–9]. Marker–trait association analyses have become a valuable tool in functional plant genomics and high-resolution mapping of quantitative trait loci (QTL). Just as in linkage mapping, association mapping is based on linkage disequilibrium (LD), i.e. the non-random combination of alleles at different loci [10]. However, the analysis is based on whole populations rather than specific bi-parental progeny. In theory, association mapping has several advantages over linkage mapping [11]: first, the results refer to a broader genetic background. Second, the genetic resolution of association mapping is much higher, because all recombination events that have accumulated in the population history are taken into consideration. Therefore, LD only extends across short segments of the chromosome. In a given species, the extent of LD may be highly population-dependent because of the variation of recombination frequency along the chromosomes, differences in population history imposed by selection, and other forces of population dynamics [12,13]. The present study was an attempt to gather information on G × E interaction among the important traits in barley, to estimate genetic properties of the association mapping using GLM analysis to account for the confounding of population structure using SSR and SNP markers, and to establish marker–trait associations for each salt-tolerance trait that can be used or genetic improvement of salt tolerance for barley.
2 Materials and methods
2.1 Experimental materials
A total of 60 barley genotypes archived at the Agricultural Research Center (ARC), Egypt, were selected to represent germplasm in Egypt (annually provided by ICARDA and ACSAD). The accessions divided according to their respective subspecies country of origin resulting and grain type-hulled and naked; 30 lines from each type (Table S1). The naked types were provided by The Egyptian/European Project on Sustainable Barley Production under Rain-fed in Egypt.
2.2 Field trial
The collection was evaluated in field trials at three saline affected soil locations (Sakha; N31.3°, E30.9°, Elserw; N31.4°, E31.8°, and Elhosinia; N31°, E32.1° northwest, Egypt (Fig. 1) in 2012 and 2014). The genotypes (G) have been divided into four groups “sets”; 15 (G) per set. Each year (Y) and location (Loc.) was treated as a separate environment (E), 3Loc. × 2Y (E1 to E6). RCBD design with three replications (Rep.) was carried out for each set comprised of 12 experiments in total (4-exp./loc.) Each plot had four rows; it was 2 m long/30 cm among rows. Data were collected on: Days to Heading (DH) and Maturity (DM), Flag Leaf Area cm2 (LA), Chlorophyll content (Chl as SPAD value), Plant Height (PH), Spike Length (SL), Peduncle length (Ped), Number of Tillers/ m2 (NT), Number of Grains/spike (NG), thousand-Grain weigh (GW), Grain Yield GY t.h–1, Biological Yield BY t.h–1, Grain Filling Period (GFP), Grain Filling Rate (GFR) and Harvest Index (HI). The Mean, Mini/Maxi values, Standard Deviation (SD), Variance (S2), Coefficient of Variation (CV), heritability/broad sense (hb) and R2 coefficient of determination were calculated, and the genetic correlations over environment means were estimated between all pair traits. ANOVA was performed using the SAS statistical package for each set [14].
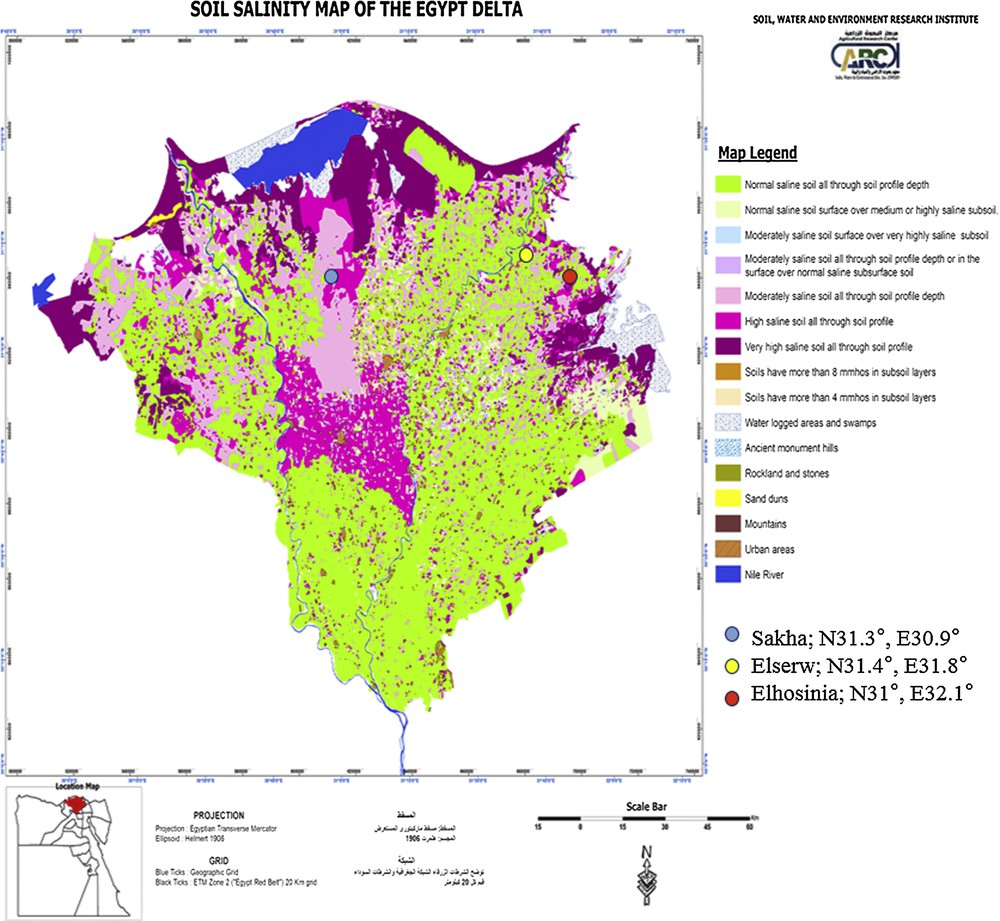
Field trial locations under study affected by salinity in Egypt (Sakha; N31.3°, E30.9°, Elserw; N31.4°, E31.8° and Elhosinia; N31°, E32.1° northwest, Egypt).
2.3 Soil analysis
At the harvesting stage, the samples were taken from upper soil layer (0–30 cm) to carry out the chemical and physical analysis (Table S2).
2.4 Genotyping
A set of 32 SSR and 8 SNP specific markers were selected based on their distribution across the seven barley chromosomes and their response to abiotic stress [7,8] from Grain Genes database (Table 1). DNA was extracted and isolated from Leaves tissues (2-week-old) using CTAB method according to [15]. PCR was carried out in 10 μl reaction vessels containing 10 ng of genomic DNA, 0.3 μl/10 ng of each primer and 5 μl of Go-Taq (Promega, Japan). The amplification was for one cycle at 94 °C for 3 min, 30 cycles (1 min/94 °C, 1 min/55 °C and 1 min/72 °C finally 72 °C/5 min then at 4 °C). PCR products were separated on 2% agarose gel in a 0.1 × TBE buffer. The bands were scored using GelAnalyze software [16].
Polymorphic profile and characteristics of 40 specific Locus (SSRs and SNPs) for a biotic stress.
| Chromosome | Locusa | cM | Size | Type | NA | GD | PIC |
| 1H | EBmac0501 | 64.84 | 151 | SSR | 3 | 0.62 | 0.55 |
| 1H | Bmag770 | 54.60 | 158 | 5 | 0.25 | 0.24 | |
| 1H | Bmac0154 | 87.83 | 130 | 4 | 0.56 | 0.46 | |
| 1H | Bmac0213 | 30.81 | 168 | 5 | 0.56 | 0.49 | |
| 1H | Bmag382 | 81.40 | 109 | 1 | – | 0 | |
| 1H | GMS021 | 26.44 | 169 | 2 | 0.43 | 0.34 | |
| 2H | Bmag0125 | 89.83 | 134 | 3 | 0.59 | 0.51 | |
| 2H | EBmac0415 | 117.86 | 247 | 2 | 0.42 | 0.33 | |
| 2H | Bmag749 | 191.70 | 166 | 1 | – | 0 | |
| 2H | HVTUB | 179.50 | 149 | 2 | 0.19 | 0.17 | |
| 2H | scssr08447 | 132.50 | 177 | SNP | 1 | – | 0 |
| 3H | HvLTPPB | 20.49 | 221 | SSR | 2 | 0.17 | 0.15 |
| 3H | Bmac0209 | 52.39 | 176 | 2 | 0.49 | 0.37 | |
| 3H | EBmac0871 | 57.62 | 180 | 3 | 0.56 | 0.47 | |
| 3H | GMS116 | 70.81 | 138 | 2 | 0.5 | 0.37 | |
| 3H | scssr10559 | 17.89 | 211 | SNP | 1 | – | 0 |
| 4H | Bmac0030 | 58.60 | 155 | SSR | 6 | 0.8 | 0.77 |
| 4H | HVMLOH1A | 102.27 | 175 | 1 | – | 0 | |
| 4H | EBmac0701 | 96.17 | 149 | 3 | 0.61 | 0.54 | |
| 4H | scssr18005 | 52.13 | 176 | SNP | 2 | 0.44 | 0.34 |
| 5H | Bmac0096 | 52.10 | 173 | SSR | 3 | 0.51 | 0.39 |
| 5H | Bmac0113 | 53.12 | 187 | 2 | 0.1 | 0.1 | |
| 5H | GMS001 | 199.97 | 134 | 2 | 0.48 | 0.36 | |
| 5H | scssr02306 | 7.30 | 123 | SNP | 2 | 0.07 | 0.06 |
| 5H | scssr10148 | 120.10 | 178 | 2 | 0.5 | 0.37 | |
| 5H | HvLOX | 122.34 | 150 | SSR | 1 | – | 0 |
| 6H | EBmac0602 | 75.42 | 205 | 3 | 0.46 | 0.42 | |
| 6H | Bmag0009 | 62.21 | 172 | 2 | 0.13 | 0.12 | |
| 6H | Bmac0316 | 7.16 | 135 | 4 | 0.58 | 0.51 | |
| 6H | GMS006 | 57.88 | 154 | 3 | 0.61 | 0.54 | |
| 6H | scssr09398 | 9.83 | 166 | SNP | 4 | 0.67 | 0.6 |
| 6H | scssr00103 | 51.60 | 168 | 2 | 0.11 | 0.1 | |
| 6H | HvWaxy4 | 19.20 | 169 | SSR | 1 | – | 0 |
| 7H | Bmag0011 | 81.78 | 147 | 2 | 0.36 | 0.29 | |
| 7H | EBmac0603 | 35.39 | 149 | 2 | 0.16 | 0.14 | |
| 7H | Bmag0120 | 97.00 | 230 | 3 | 0.64 | 0.56 | |
| 7H | HVCMA | 67.59 | 141 | 2 | 0.14 | 0.13 | |
| 7H | AF022725A | 45.80 | 136 | 2 | 0.23 | 0.21 | |
| 7H | HvID | 182.00 | 182 | 2 | 0.5 | 0.37 | |
| 7H | scssr07970 | 65.90 | 160 | SNP | 3 | 0.63 | 0.56 |
| Average | 2.76 | 0.43 | 0.36 |
a Primer sequences available on GrainGenes: http://wheat.pw.usda.gov/GG2/index.shtml.
2.5 Genetic diversity and AMOVA
Number of allele, gene diversity and polymorphism information content (PIC) for each locus were calculated for markers using Power Marker 3.25 [17]. The genetic structure was analyzed by hierarchical AMOVA implemented in the software of GeneAlEx6.5 [18].
2.6 Analysis of population structure
The population structure implied using the Bayesian model-based software program STRUCTURE was used to determine the number of clusters K = sub-populations [19]. We performed 10 runs; each run was a burn in length of 100,000 steps [20]. The PAST [21] and XLSTAT pieces of software were used to carry out UPGMA and PCA analyses, based on the Nei genetic distance matrix through binary data.
2.7 Association map and linkage disequilibrium analysis
The association between the phenotypes and the markers was evaluated with a general linear model (GLM) in TASSEL.5 [11] during and over seasons. The phenotypic allele effect of SSR/SNP which was associated with 15 associated traits was estimated through comparison between the average phenotypic values over accessions with the specific allele. LD, r2 values were calculated for each chromosome in the two sub-populations and plotted against genetic distance (cM) and (D’), [22] using TASSEL and PowerMarker pieces of software. The correlation of allele frequencies r2 and standardized disequilibrium coefficient (D’) values estimated between all pair of loci were plotted against the genetic distance in cM to determine the map distance across them.
3 Results
3.1 Phenotypic data and genetic correlations
The data related to 15 agronomic-traits of the 60 genotypes is summarized in Table S3. Over the six environments, GY varied from 1.16 to 2.64 t.h–1 and the mean GY was 2.02 ± 0.31 t.h–1; E6 recorded the highest mean values for most traits, compared to the others. The CV% concerning yield and agronomic traits (Table S3) varied from 4.74 in HD to 17.92 in LA, which indicates that there was considerable variation for these traits. ANOVA identified significant differences among G, E and G × E for all traits, showing highly significant P values ≤ 0.01 (Table S4) for the main effects. The heritability (hb) of the 15 traits ranged from 59% for BY to 88% for MD over locations; by using data pooled over the two years and all locations, the highest significant positive correlation was found between BG vs. GY (r = 0.64, P < 0.01), (Table S5).
3.2 Genetic diversity in barley panel
The allele number, gene diversity and PIC were calculated to estimate the genetic diversity in a barley panel. A total of 40 markers (32 SSR and 8 SNP) were used to measure the genetic diversity of the population. Out of them, 27 SSR and 6 SNP showed polymorphism, with a total of 98 alleles; the gene diversity and the PIC values of the 33 polymorphic loci ranged from 2 to 6, 0.07 to 0.80 and 0.06 to 0.77, with an average of 2.76, 0.43, and 0.36, respectively (Table 1). Seven SSR loci (Bmac0030, EBmac0501, Bmac0316, EBmac0701, Bmag0125, Bmag0120 and GMS006); two SNP loci (scssr09398 and scssr07970); SNP showed high PIC and gene-diversity values ≥ 0.51 (Fig. S1).
3.3 Population structure
STRUCTURE analysis results showed that the statistic Δk was used to determine a suitable value for K. Here, the Δk value was much higher for the model parameter K = 2 (Fig. 2), suggesting that the total panel could be divided into two major sub-populations. Sub.P1 contained hulled accessions from ARC, ICARDA and ACSAD, and sub.P2 contained naked types (European and five Egyptian cultivars). Both sub-populations (based on grain type and geographic region) contained 30 accessions; the genotypes with partial membership may exhibit distinctive identities.

Estimation of the number of sub-populations for K ranging from 1 to 10 by calculating ΔK values; STRUCTURE model, the highest point refer to the best k = 2.
3.4 Population differentiation
AMOVA was performed to analyse the distribution of genetic diversity between and within the populations (Table S6). Highly significant (P ≤ 0.001) genetic variance was observed within and among sub-populations, recording a total 77 and 23% of total variance, respectively, with the main genetic variation occurring within sub-populations. For allele frequency, the revealed FST value was 0.235 among the sub-populations. UPGMA and PCA results are presented in Figs. S2 and S3, respectively. The results showed a spatial pattern that corresponds to the geographic region and the grain types. The hulled genotypes from ARC, ICARDA, and ACSAD were grouped into the same cluster, while the naked types (25 European landrace and five Egyptian cultivars) were in the second group.
3.5 Assessment of linkage disequilibrium
Pairwise LD was estimated using the squared-allele frequency correlations (r2) and was found to decay rapidly with the genetic distance; a significant LD was detected across the genome of the 60 barley genotypes and extent of LD varied with different chromosomes (Fig. S4). The proportion of marker pairs exhibiting significant r2 with P values ≤ 0.01 is reported in (Fig. 3A) as a function of the inter-marker distance. The scatter plots of the LD values of r2 and D’ values as a function of the inter-marker distance cM for the entire samples are summarised in Fig. 3B and C. Overall, D’ values are high across inter-marker distances, ranging from −1.00 to 1.00 with an average of −0.70. The significant intra-chromosomal r2 values (P < 0.01) ranged from 0.00 to 0.45 with an average of 0.04 for the whole panel (data not shown). The plot of r2 versus the sum of PIC and GD values for intra-chromosomal loci pairs with r2 > 0.05 are displayed in Fig. 3D.

A; Intra-chromosomal LD (r2) decay of marker pairs as a function of significance p-values; (P ≤ 1.9·10−5), B; and C; scatter plots of the LD significance D’ and r2 of marker pairs as a function of the inter-marker distance (cM), D; plots of LD giving r2 versus the sum of PIC and GD values.
3.6 Association mapping between markers and salt-related traits
Marker–trait associations (MTA) for 15 salt tolerance-related traits were performed with the GLM model (Table S7). A total of 33 marker (27 SSR and 6 SNP) loci with the R2 range of 3–40, significant QTLs were identified on –log10(P) threshold P ≤ 1.9 × 10⁻⁵, and were associated with salt tolerance-related traits and differed from individual to individual over the two years. The association mapping approach in the first year was less than QTLs in the second year. A total of 107, 237 and 187 significant MTA (P ≤ 1.9·10−5) were identified among 1350 marker × trait combinations for the first and second years as well as for the mean over all the years, respectively. The strongest QTL for salt tolerance on 4H–log10(P) was consistently found and co-localises with QTLs for other growth-related traits such as MD, Chl, PH, Ped, NP, BY, GY, and GW, located around 52.10 cM on 4H, with −log10(P) scores close to 11 (MD/2nd year). Another important region was found at 35.39 cM on 7H with highly significant QTL−log10(P) scores (9.57) for NG-related traits (first year). In addition, the region on 1H 87.83 cM had highly significant QTL–log10(P) scores (10.32) for MD during the second year (Fig. 4).

Barley map location of SSR and SNP markers associated with 14 salinity related-traits, showing the marker positions and the estimated map distances, cM, based on the consensus linkage map of Varshney et al. (2007). Significant MTA values are indicated by a star (*).
3.6.1 Growth traits
A total of 18 significant (P ≤ 1.9·10−5) MTA (17 SSRs and one SNP markers) were identified for growth habit on the seven; 1-7H chromosome (Table S7). Two MTA for Chl were detected on 1H, 4H over years, while three MTA for MD were detected on 1H, 4H and 7H; favourable allele effects were 167 and 181 bp, scssr18005 loci on 4H and 226 bp, and Bmac0154 loci on 1H. Two trait associations were detected for PH on 7H and were significant over the two years in all cases. Three MTA were detected on 2H, 4H and 6H. No favourable allele effects were observed on PL, while two MTA with NP were detected on 4H and 7H. Nine significant MTA for GFP were identified on 1H, 2H, 4H and 5H over the two years. Regarding HI, two significant MTA were detected on 2H and 5H over the two years.
3.6.2 Yield component traits
Two MTA for BY with years were detected, which exhibited a positive effect on 4H and 6H (Table S), while two MTA for GY on 2H and 4H proved significant over the years; the remaining five loci exhibited a significant during the individual years. The allele with the highest positive effect was detected on 2H (242 bp, EBmac0415, SSRs loci). A total of eight MTA for GW were detected on all chromosomes, except for 3H and 6H.
4 Discussion
Unravelling the mechanisms underlying salt tolerance in higher plants is challenging, due to the complexity of the adaptive mechanisms of the plants in response to salt stress. The study shows a genetic variation of salt tolerance, and salt association traits that contribute to salt tolerance in specific regions in the barley genome.
4.1 Field assessments
The important economic characteristics are generally quantitative in nature and exhibit a considerable degree of interaction with the environment. In this study, most traits were significantly affected by changes in E, G and G × E; the highly significant environment effect and its high variance component could be attributed to the differences among the test locations in soil characters [23]. The heritability, hb%, exceeded 86% in combined and phenotypic means, reflecting a broad variation in the panel, by providing information on the magnitude of the inheritance of quantitative traits [24]. Although the hb% for many traits might be influenced by environmental conditions, it is mainly affected by main effects and G × E effects during the growth cycle [25,26]. This indicates that the phenotypic expression of one genotype might be superior to another genotype in one environment, but inferior in a different environment; the current study has shown that this also holds true for salt stress tolerance in barley [9,27]. In contrast to plant tolerance to abiotic stresses, which is mostly dependent on monogenic traits, the adaptive mechanisms of the plants exhibit more complexity in response to salt stress, and are thus more difficult to control and engineer [2,28]. This can be explained by the influence of the G, E and G × E, as suggested by the results of the QTL analysis for most agronomic traits [29,30].
4.2 Population structure
Molecular marker studies provide ample evidence that barley represents distinct gene pools. In the present study, STRUCTURE was applied to gain insight into the stratification of the germplasm collection [19]. Two sub-populations were detected among the accessions with significant divergence (P > 0.001). Within this structure, several patterns were quite prominent (e.g., the differentiation between ARC, ICARD, ACSAD and European accession sources or hulled and naked, respectively). AMOVA results revealed high genetic diversity within the 77% sub-population, while the low genetic differentiation among sub-populations of 23% may be due to gene flow that resulted from developing by crossing and their nature. However, the choice of marker plays a role in the structure detected, as shown by groups that appeared clearly using SSR/SNP markers [31]. We presented the landraces with an inferred ancestry corresponding to a different origin; for example, (S_1) represents freshly introduced populations in the region, which can result from seed exchange among the farmers, while the European and the Egyptian naked cultivars (S_2) had a high genetic similarity value, and are also the same grain type [20]. The set of markers (SSR/SNP) employed in this study demonstrates the usefulness of markers for the identification of barley genotypes. However, we need more markers and genotypes [32].
4.3 Linking disequilibrium and association analysis
The extent of pairwise LD significantly varied among the barley chromosomes, suggesting that this factor may affect the resolution of association mapping for QTL located on different chromosomes [29,33]. Running the association analysis with a so-called partitioning trait, i.e. a trait showing a high correlation with the assessed stratification, can best assess the efficacy of a correction for population structure. Several molecular markers influenced more than two examined traits [9,32].
In this study, we have identified QTLs affecting salt tolerance and related traits using an association-mapping approach, while correcting for population structure and relatedness (Fig. 4). Numerous significant maker-trait associations were found in different regions of the barley genome controlling salt tolerance and related traits; among them, 45, 52 and 46 QTLs were detected during the first and second years as well as over the years for 14 associated traits. The results showed a strong QTL on 1H, 2H, 4H and 7H independently of population structure controlling salt tolerance that co-localised with QTL for other traits such as Chl, MD, PH, GFP, BY, GY, HI and GW, which are important factors for salt tolerance improvement in barley. Although only a small sample and limited markers were used, the results are credible because many of the loci that were identified were associated with traits that were common in previous reports of linkage or association mapping [1,9]. These results can be well understood considering the polygenic nature of the investigated traits. Tolerance to abiotic stresses (e.g., drought and salinity) is inherited quantitatively [34].
4.4 Abiotic stress affects productivity
Association mapping has proven to be a powerful approach to dissect the complexity of quantitative traits in plants [12]. From the breeding perspective, stress tolerance can be described as the ability to maintain stable yields under stress environments. Abiotic stress tolerance is a quantitative trait and is controlled by genetic factors, and many genes for abiotic tolerance have been lost during domestication [9]. Association mapping provides valuable information on genomic regions that control quantitative traits, but it also has limitations due to poor sampling of the allelic variation present in the barley gene pool for each one of the loci affecting salt tolerance [30].
Approval
We authors and our institutions have read and are fully aware of the journal policy.
Acknowledgements
This work was supported by the ministry of higher education, Agricultural Research Center, Egypt and the Institute of Genetic Resources, Faculty of Agriculture, Kyushu University, Japan.