

1 Introduction
Nonalcoholic fatty liver disease (NAFLD) is the main cause of hepatic dysfunction in developed countries and is closely related to components of metabolic syndrome such as obesity, dyslipidemia and type-2 diabetes [1]. Excessive accumulation of triglyceride (TG) in hepatocytes is the hallmark of NAFLD. The spectrum of NAFLD ranges from hepatic steatosis or fatty liver to nonalcoholic steatohepatitis (NASH), liver fibrosis, liver cirrhosis, and eventually hepatocellular carcinoma (HCC) [2]. The precise mechanisms of NAFLD remain poorly understood. The “multiple-hit hypothesis” is currently the most recognized theory to explain disease development and progression, the dysregulation in lipid metabolism being involved in the first hit [3]. It was estimated that 30 % of the TG content in NAFLD livers came from de novo lipogenesis, underlying the importance of this pathway in the etiology of NAFLD [4,5]. De novo lipogenesis (DNL) can be triggered by multiple mechanisms, including increased expression of lipogenic enzymes by several specific transcription factors; this is particularly true for members of the SREBP family. One of them, SREBP-1c, controls hepatic DNL primarily by regulation of expression of genes involved in DNL, lipid homeostasis and glucose metabolism [5,6]. Accordingly, hepatic expression of SREBP-1c and its target genes are increased in human fatty liver, compared to healthy individuals [7,8], although DNL is an important determinant of steatosis [9]. The second of the two hits could be due to (1) oxidative stress, (2) proinflammatory cytokines, (3) mitochondrial dysfunction, or/and (4) endoplasmic reticulum stress. Recently, accumulating data have implicated the disruption of endoplasmic reticulum (ER) homeostasis, or ER stress, in both the development of steatosis and progression to NASH [10,11]. ER stress may lead to the activation of various intracellular stress pathways that can initiate or exacerbate insulin resistance (IR) and inflammation and, in some cases, culminate in hepatocyte cell death and liver damage, all of which are important in the pathogenesis of NAFLD. In spite of growing knowledge, several aspects of NAFLD pathogenesis are still unknown.
Considering the difficulty in developing human studies to evaluate the influence of nutrition in the development of NAFLD and associated metabolic abnormalities, animal models constitute a reliable alternative way. Different animal models of NAFLD/NASH have been developed, but few of them replicate the entire human phenotype [12,13]. These models may be classified into three basic categories: those caused by either spontaneous or induced genetic mutation; those produced by either dietary or pharmacological manipulation; and those involving genetic mutation and dietary or chemical challenges. The dietary manipulations used in these last two types of models usually do not resemble the human dietary pattern.
The aim of this study was to determine the long-term impact of high-carbohydrate diet on liver morphology and function in a desert rodent (Gerbillus gerbillus). We therefore evaluated the markers involved in metabolic functions, i.e. lipogenesis, fibrosis, ER stress, histopathological changes, and oxidative stress. In the present study, we developed a model of obesity and obesity-related NAFLD in a desert rodent (G. gerbillus) using a simple carbohydrate-rich diet.
2 Materials and methods
2.1 Animals and diets
G. gerbillus individuals were collected from the semi-desert Algerian region of Beni-Abbes (30°7’ latitude north and 2°10’ longitude west). The authorization to capture the animals in desert region was given by the Ministry of Higher Education (Algeria). G. gerbillus specimens were maintained under controlled temperature (22 ± 1 °C), humidity (50%) with a fixed 12-h light/dark cycle. After two weeks of acclimatation, the adult gerbils of both sexes were randomly divided into two groups. The control group (n = 6) received a natural diet composed of halophile fresh plants, seeds, dry plants… whereas the experimental group (n = 6) received an HC diet (25 % of barley and 75 % of dried dates) corresponding to a daily caloric intake of 22.5 calories/animal. Details of the composition of the high-carbohydrate diet (HCD) are presented in Table 1. After six months of diet administration, the animals were killed by decapitation. The livers and fat pads (mesenteric. genital and perirenal) were totally removed, rinsed with cold 0.9 % NaCl, weighed, and cut. One part of the liver was fixed in 10% neutral buffered formalin for histopathological investigations. The other part was first frozen in liquid nitrogen and then stored at–80 °C for later use in biochemical studies.
Diet compositions according to Nicole Tonelli and François Gallouin, Fruit and seeds comestibles worldwide, 7th edition. MedPharm Scientific Publishers/Taylor & Francis, 2008.
| Nutritional composition | Barley (g/100 g) | Dried dates (g/100 g) |
| Carbohydrates | 63.30 | 65 |
| Starch | 61.59 | – |
| Simple sugars | 1.71 | |
| Glucose | – | 25 |
| Fructose | – | 25 |
| Saccharose | – | 14 |
| Sorbitol | – | 1 |
| Protein | 11.2 | 2 |
| Lipids | 2.1 | 0.5 |
| Water | 12.2 | 20 |
| Fibers | 9.8 | 9 |
| Vitamins | 0.015 | 0.012 |
| Minerals & Trace Elements | 0.956 | 0.862 |
| Calories | 314 kcal | 275 kcal |
2.2 Biochemical analyses
Blood samples were collected after 24 weeks of feeding by puncture from the retro-orbital venous plexus into heparinized or EDTA-containing tubes. The plasma was immediately separated by centrifugation at 3000 g for 10 min and rapidly stored at–20 °C until analysis. Plasma glucose, total cholesterol, triacylglycerol (TG), HDL cholesterol and reliable markers of hepatic function (aspartate aminotransferase, AST; alanine aminotransferase, ALT) were measured by using the corresponding kits for analysis (Spinreact, Spain). Plasma LDL cholesterol concentration was calculated by using the equation of Friedewald. Plasma insulin was measured by radioimmunoassay (INSULIN-CT kit, Cisbio assay, France). Homeostasis model assessment of insulin resistance (HOMA-IR) was calculated according to the following formula: HOMA-IR = fasting insulin (μU/mL) × fasting glucose (mmol/L)/22.5.
2.3 Histopathology
A portion of liver (100 mg) was fixed with 10% formalin for 24 h, dehydrated in graded ethanol, and embedded in paraffin. The samples were cut into 5-μm-thick sections and stained with Masson's trichrome for evaluation by light microscopy for fibrotic deposition.
2.4 Hepatic lipid analyses
Liver total lipids were extracted by the method of Folch et al. [14]. The concentrations of triglycerides and cholesterol in the hepatic lipid extracts were measured using the same enzymatic kits as those used for plasma analysis.
3 Estimation of hepatic oxidative stress
3.1 Liver homogenate preparation
Liver samples from each gerbil were homogenized in Tris/EDTA buffer (50 mM Tris. 0.1 mM EDTA. pH 7.6) to obtain a 10% (w/v) liver homogenate. An aliquot of tissue homogenate was centrifuged at 1,000 rpm for 5 min at 4 °C for the estimation of MDA (malondialdehyde). The remaining volume of homogenate was centrifuged at 9,600 rpm for 20 min at 4 °C. The supernatant was collected and used for the estimation of GSH (reduced glutathione), and for measuring the activity of SOD (superoxide dismutase), CAT (catalase), and GST (glutathione-S-transferase).
3.2 Markers of lipid peroxidation
Lipid peroxidation was assessed indirectly by the measurement of secondary products malondialdehyde (MDA) using a thiobarbituric acid (TBA) method according to the protocol. MDA formed a colored complex in the presence of thiobarbituric acid, which was detected by spectrophotometrical measurement of the absorbance at 535 nm [15].
3.3 Evaluation of antioxidant enzyme activity
3.3.1 Activity of SOD
Superoxide dismutase was estimated using the method described in [16]. Superoxide anions are generated during the oxidation of pyrogallol under test conditions and SOD enzyme inhibits the oxidation of pyrogallol. The enzyme activity is measured by monitoring the rate of decrease in optical density at 420 nm. One unit of enzyme was defined as the amount of enzyme required to produce 50% inhibition of pyrogallol autoxidation under the assay conditions and expressed as U/mg protein.
3.3.2 Activity of catalase
Catalase activity was assayed by the method of Aebi [17]. The rate of H2O2 decomposition was followed by monitoring absorption at 240 nm. The enzyme activity was expressed as millimoles of H2O2 consumed per minute per milligram of protein.
3.3.3 Activity of GST
GST activity was measured using the method of Habig et al. [18]. Briefly, 1 mM CDNB was added to a buffer solution containing 1 mM GSH and an aliquot of the sample to be tested. Upon addition of CDNB, the change in absorbance at 340 nm was measured as a function of time. The extinction coefficient for this reaction is 9.6 mM−1·cm−1.
3.3.4 Concentration of GSH
GSH level was estimated using a colorimetric technique as mentioned by Ellman [19], based on the development of a yellow color when 5,5-dithio-bis-(2-nitrobenzoic acid) (DTNB) is added to compounds containing sulfhydryl groups. Absorbance was recorded at 412 nm. The total GSH content was expressed as nanomoles of GSH per milligram of protein.
3.4 Protein estimation
The protein content was determined using Bradford's method [20], bovine serum albumin being taken as the standard.
3.5 RNA extraction and RT-qPCR
Total RNA was isolated according to [21]. Real-time quantitative RT-PCR analyses were performed with 50 ng of cDNA/3 mM MgCl2/250 nM sense and antisense primers (Proligo, Boulder, CO, USA) in a final reaction volume of 25 μl by using the qPCR TM Core Kit (Eurogentec, Brussels) and the MyiQ real-time PCR detection system (Bio-Rad). Specific primers were designed with Primer Express software (Table 2). The relative quantitation of each gene was calculated after normalization to 18S ribosomal RNA by using the comparative CT method.
Sequences of the primers used for quantitative real-time PCR.
| Genes | primer sequenses |
| FAS | |
| Sense | 5′-tgc tcc cag ctg cag gc -3′ |
| AntiSense | 5′-gcc cgg tag ctc tgg gtg ta-3′ |
| SREBP1c | |
| Sense | 5′-gga gcc atg gat tgc aca tt-3′ |
| AntiSense | 5′-ggc ccg gga agt cac tgt-3′ |
| ACC | |
| Sense | 5′-tgg gca cag acc gtg gta g-3′ |
| AntiSense | 5′-ggt ctt aaa tgc aga gtc tgg gaa-3′ |
| SREBP2 | |
| Sense | 5′-ccc ttg act tcc ttg ctg ca-3′ |
| AntiSense | 5′-gcg tga gtg tgg gcg aat c-3′ |
| HMG CoA synthase | |
| Sense | 5′-gcc gtg aac tgg gtc gaa-3′ |
| AntiSense | 5′-gca tat ata gca atg tct cct gca a-3′ |
| HMG CoA reductase | |
| Sense | 5′-gat tct ggc agt cag tgg gaa-3′ |
| AntiSense | 5′-gtt gta gcc gcc tat gct cc-3′ |
| aSma | |
| Sense | 5′-ttg gaa aag atc tgg cac cac-3′ |
| AntiSense | 5′-gca gta gtc acg aag gaa tag-3′ |
| Col1A1 | |
| Sense | 5′-ccc cgg gac tcc tgg act t-3′ |
| AntiSense | 5′-gctccgacacgccctctctc-3′ |
| TGF-β | |
| Sense | 5′-gcctgagtggctgtcttttgac-3′ |
| AntiSense | 5′-catggatggtgcccaggt-3′ |
| GRP78 | |
| Sense | 5′-gaa agg atg gtt aat gat gct gag-3′ |
| AntiSense | 5′-gtc ttc aat gtc cgc atc ctg-3′ |
| ORP150 | |
| Sense | 5′-tgt cct ctt ggc aga cct gtt g-3′ |
| AntiSense | 5′-ttt tcc tcc gag att cct tgt tc-3′ |
| 18S | |
| Sense | 5′-ggg agc ctg aga aac ggc-3′ |
| AntiSense | 5′-ggg tcg gga gtg ggt aat tt-3′ |
3.6 Preparation of nuclear extracts
Nuclear extracts were prepared as described in [22]. Livers were removed and quickly rinsed in an ice-cold phosphate-buffered saline solution with pepstatin (5 μg/ml), leupeptin (5 μg/ml), and aprotinin (2 μg/ml) as protease inhibitors. The livers were then transferred into a beaker, on ice, containing the homogenization buffer (2 M sucrose, 10 mM Hepes, pH 7.6, 25 mM KCl, 0.15 mM spermine, 0.5 mM spermidine, 1 mM EDTA, 10% glycerol, 0.5 mM dithiothreitol) and minced with scissors. After processing in a Dounce apparatus in fresh buffer on ice, the homogenates were layered on 2 M sucrose cushions and centrifuged at 80,000 g for 35 min at 0 °C. The nuclear pellets were then rinsed in a buffer containing 10 mM of Tris, pH 7.4, 10 mM of NaCl, 3 mM of MgCl2, resuspended in a 20 mM Hepes, pH 7.9, 0.4 M NaCl, 1 mM EDTA, 1 mM EGTA, 1 mM dithiothreitol buffer and incubated 15 min on ice. After spinning 5 min at 10,000 rpm, aliquots of the supernatants were stored at –80 °C. The protein content was determined as described by Bradford, using bovine serum albumin as a standard.
3.7 Statistical analysis
Data were statistically analyzed by performing a nonparametric Mann–Whitney test using GraphPad Prism to compare experimental groups (v. 6.00 for Windows, San Diego, CA, USA). Data were expressed as mean < remove picture pageno 5> standard error of the mean (SEM) and considered significant at P < 0.05.
4 Results
4.1 Body and liver weights, body fat accumulation and biochemical parameters
The administration of a high-carbohydrate diet for 6 months resulted in significant increases in the final body, liver and abdominal fat weights compared with those in the gerbils from the control group (Table 3). The liver and fat indices increased 1.08 and 2.5 times, respectively, compared to the control diet, after a 24-week HC diet. The HCD group showed higher plasma concentrations of triglycerides (P < 0.001) and total cholesterol (P < 0.05). However, the mean plasma HDL cholesterol and LDL cholesterol levels were not statistically different between the two groups. Plasma glucose was not modified in experimental gerbils (P = 0.123), whereas plasma insulin level and HOMA-IR index were significantly increased (P < 0.05) with the HCD compared to the control diet (Table 3). The 24-week feeding of HCD to gerbils did not significantly affect ALT and AST activities (markers of liver function) (Table 3).
Physiological and plasma parameters in control and HCD gerbils after 24 weeks of treatment.
| Control (n = 6) | Experimental (n = 6) | |
| Body weight (g) | 27.68 ± 0.88 | 31.43 ± 0.70** |
| Fat pads (mesenteric, genital and perirenal) (g) | 0.49 ± 0.03 | 1.35 ± 0.15*** |
| Fat to body weight ratio (%) | 1.76 ± 0.10 | 4.35 ± 0.57** |
| Liver weight (g) | 0.98 ± 0.005 | 1.19 ± 0.005* |
| Liver to body weight ratio (%) | 3.51 ± 0.21 | 3.79 ± 0.11 |
| Hepatic triglycerides (mg/g liver) | 82.97 ± 12.07 | 188.4 ± 26.20** |
| Hepatic total cholesterol (mg/g liver) | 41.45 ± 8.20 | 86.86 ± 3.85*** |
| Plasma triglycerides (mg/dl) | 93.91 ± 10.04 | 208 .7 ± 18.48*** |
| Plasma total cholesterol (mg/dl) | 103.1 ± 7.05 | 136.8 ± 9.03* |
| Plasma HDL-c (mg/dl) | 57.07 ± 3.55 | 51.52 ± 5.20 |
| Plasma LDL-c (mg/dl) | 28.81 ± 8.95 | 42.33 ± 8.14 |
| Plasma glucose (mg/dl) | 94.74 ± 3.73 | 107.8 ± 6.78 |
| Plasma insulin (mU/mL) | 48.38 ± 2.21 | 183.9 ± 47.26* |
| HOMA-IR index | 11.34 ± 0.79 | 48.91 ± 12.78* |
| ASAT (U/l) | 32.08 ± 7.02 | 56.84 ± 25.71 |
| ALAT (U/l) | 18.95 ± 2.68 | 24.78 ± 4.17 |
* P < 0.05.
** P < 0.01.
*** P < 0.001 versus the control group.
4.2 Liver TG and cholesterol levels
The liver TG and TC levels are shown in Table 3. HCD feeding significantly increased the hepatic TG levels (188.4 ± 26.20 mg/g) compared with the control group (82.97 ± 12.07 mg/g; P < 0.01). The hepatic TC content in the HCD group was increased two times compared to control animals.
4.3 Histological analysis of the liver tissues
Representative photomicrographs of liver sections are described in Fig. 1. Liver sections of control animals showed a normal liver architecture formed of hepatic lobules. Briefly, each lobule is made up of radialing plates. Strands of cells form a network around a central vein (Fig. 1A). The histological examination of liver tissue of gerbils submitted to the HC diet revealed variable changes. These changes were evidenced by a marked micro and macro steatosis characterizing the NAFLD status (Fig. 1B). Trichrome staining showed a marked collagen deposition within the pericellular space at sites where fatty degeneration of hepatocytes occurred (Fig. 1C). Also, marked mononuclear cell infiltrates in the portal system space (red arrows) were observed (Fig. 1D).
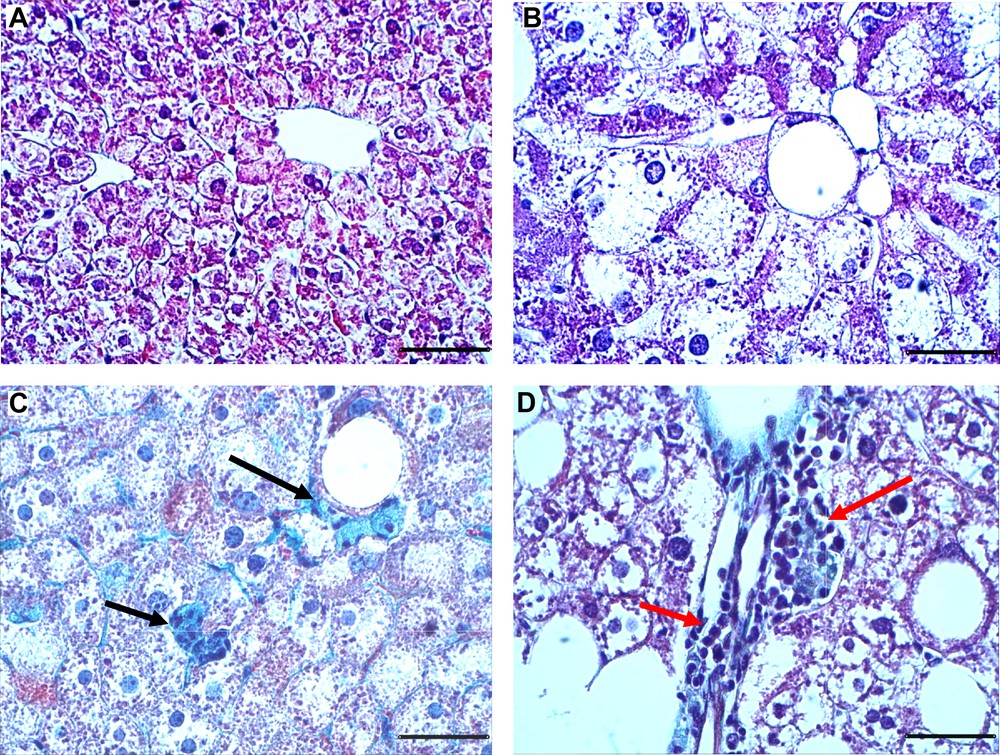
Representative Masson Trichrome stained liver sections from gerbils fed with normal diet (A) or high carbohydrate diet (B–D) during 24 weeks. Trichrome Masson staining was performed to detect fibrotic areas (in green, indicated by arrows). Sections were observed at 400-fold magnification (scale bars: 50 μm).
4.4 Lipid peroxidation of the liver
As shown in Fig. 2A, the level of malondialdehyde (MDA), an index of lipid peroxidation in liver homogenates was significantly increased by 67% in the HCD group (P < 0.05) compared to the control group.
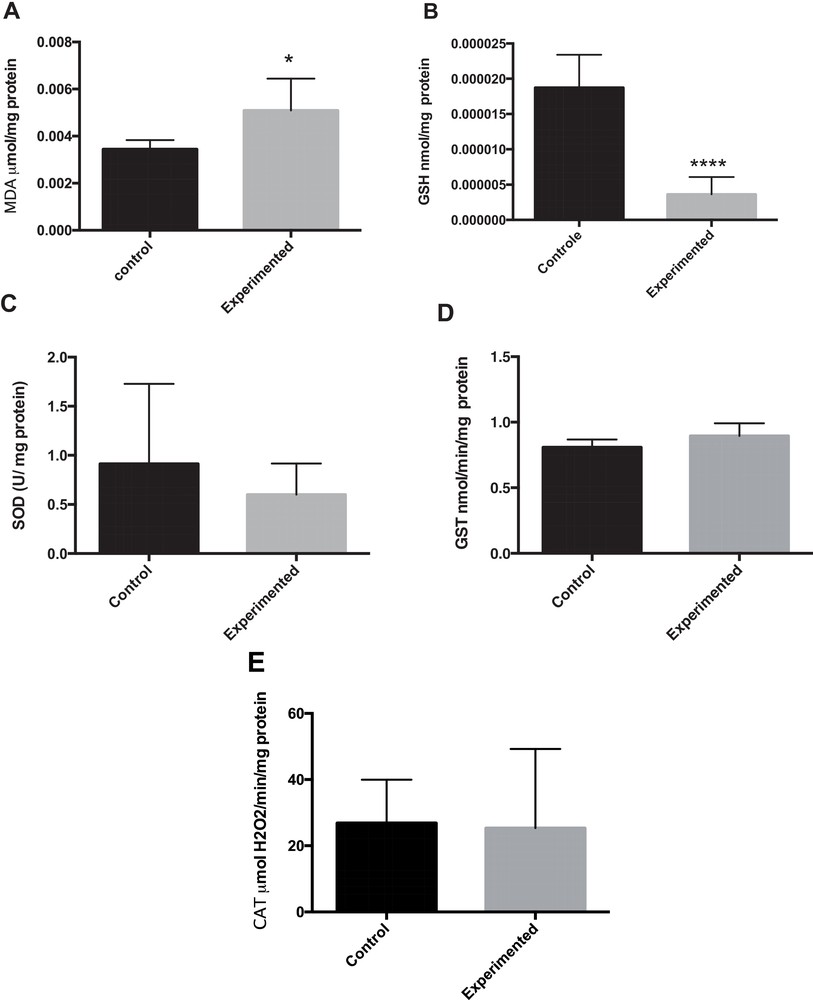
Oxidative stress in liver tissue. The intrahepatic contents in MDA (A), GSH (B), SOD (C), GST (D) and CAT (E) were respectively measured in frozen liver homogenate of control or treated gerbils. * P < 0.05. **** P < 0.0001 versus control group.
4.5 Activities of antioxidant enzymes in liver tissue
The effect of a long-term administration of HCD on activities of liver antioxidant enzymes is depicted in Fig. 2(B–E). GSH (reduced glutathione) levels were statistically significantly lower in the HCD group than in the control group (Fig. 2B). SOD (superoxide dismutase) activities did not yield statistically significant differences due to the large variability observed (HCD: (0.600 ± 0.129 U/mg protein) vs. (0.914 ± 0.331 U/mg protein) in control animals). As illustrated in Fig. 2A and B, the GST (glutathione-S-transferase) and CAT (catalase) activities were unchanged between these two groups.
4.6 Hepatic gene expression in gerbils
4.6.1 mRNA expression of SREBP1c. ACC and FAS
Sterol regulatory element-binding protein-1 (SREBP-1) is a nuclear transcription factor that transcriptionally activates nearly all the genes involved in de novo lipogenesis [23]. Acetyl-CoA carboxylase (ACC) and fatty acid synthase (FAS) are important downstream target genes of SREBP-1 and are the rate-limiting enzymes of palmitate formation. Compared with controls, HCD feeding alone significantly up-regulated the hepatic mRNA expression of SREBP1-c (P < 0.01), FAS (P < 0.001) and ACC (P < 0.01) (Fig. 3A–C).
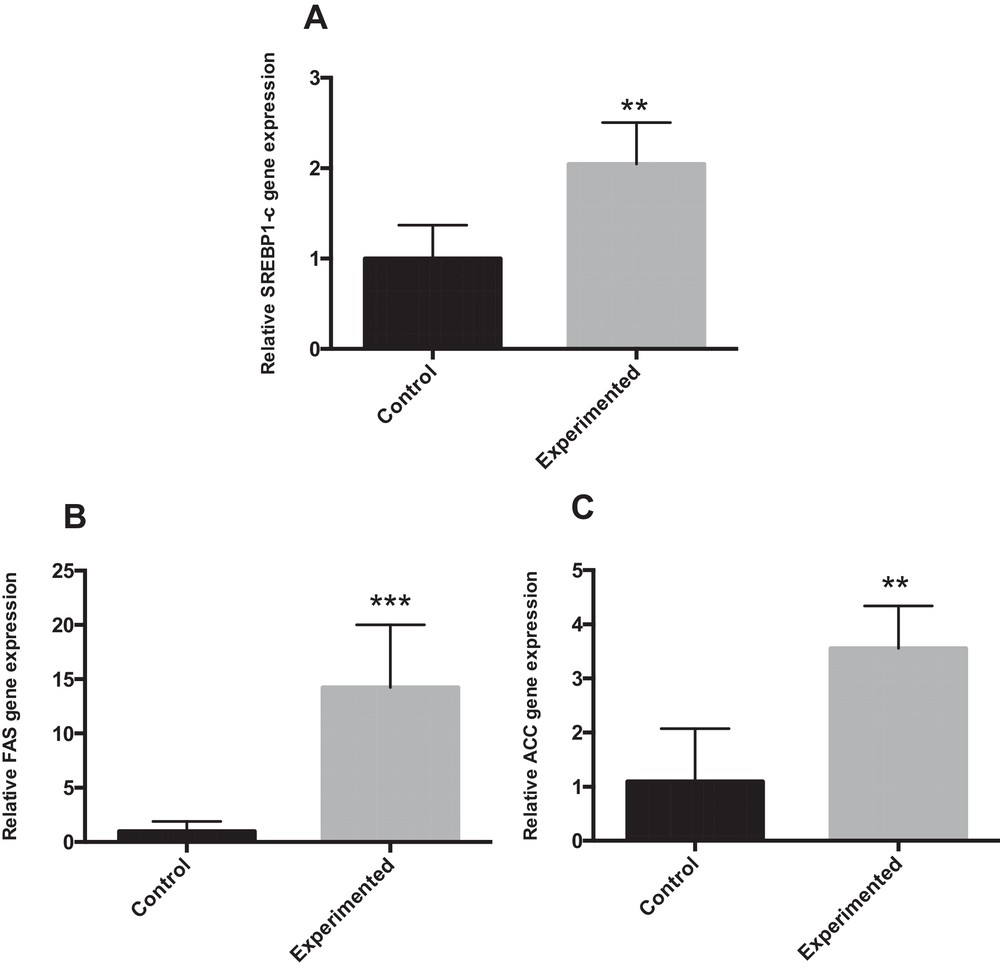
mRNA expression for genes involved in fatty acid synthesis in the liver of gerbils fed normal diet or high carbohydrate diet for 24 weeks. ** P < 0.01. *** P < 0.001 vs. the corresponding values in control gerbils.
4.6.2 mRNA expression of SREBP2, HMG CoA synthase and HMG CoA reductase
SREBP-2 preferentially regulates target genes involved in cholesterol biosynthesis and uptake in the liver, such as 3-hydroxy-3-methylglutaryl-CoA synthase (HMGCS) and 3-hydroxy-3-methylglutaryl-CoA reductase (HMGCR) [24]. The mRNA expressions of SREBP-2 and HMG CoA synthase were significantly increased in HCD gerbils as compared to controls (Fig. 4A–B). However, HMGCoA reductase mRNA expression was not significantly different between the groups, due to the large variability observed, but tended to increase as compared to controls (Fig. 4C).
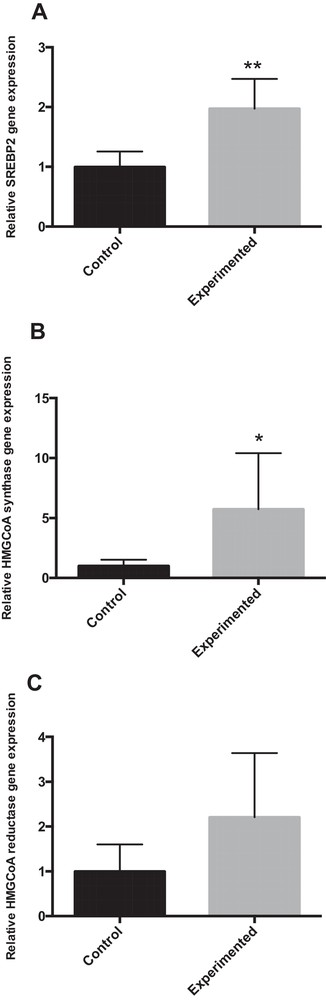
mRNA expression of SREBP2 and SREBP2 (HMGCoA synthase, HMGCoA reductase) target gene involved in cholesterol metabolism in the liver of gerbils fed with normal diet or high-carbohydrate diet for 24 weeks. * P < 0.05. ** P < 0.01 vs. the corresponding values in control gerbils.
4.6.3 mRNA expression of α-SMA, Col1A1 and TGF-β
Our results show that mRNA gene expression for α-SMA (α-smooth muscle actin, a gene related to stellate cell activation) was approximatively two-fold higher in HCD group compared to control group (P < 0.05). Similarly, the hepatic mRNA expression of Col1A1 (collagen 1A1) was up-regulated (1.5-fold) in HCD group compared to control group (Fig. 5B). However, liver expression of TGF-β (transforming growth factor) remained unchanged between the two groups (Fig. 5C).
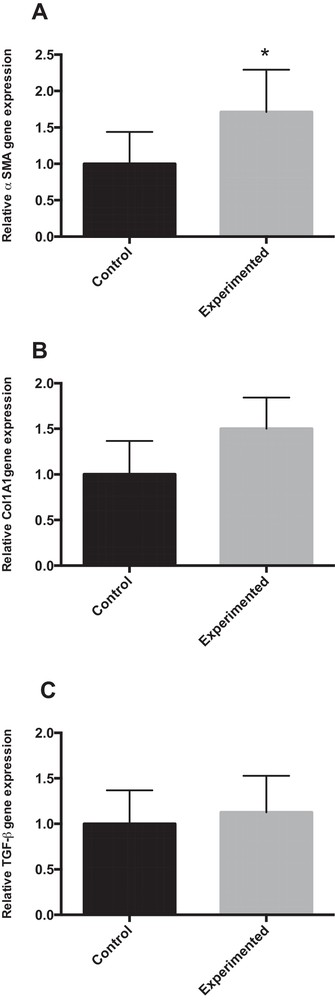
mRNA expression for genes related to hepatic fibrosis in the liver of gerbils fed with normal diet or high-carbohydrate diet for 24 weeks. * P < 0.05 vs. the corresponding value in control gerbils.
4.6.4 mRNA expression of GRP78 and ORP150
Abnormal endoplasmic reticulum (ER) stress contributes substantially to hepatocyte cell death during altered lipid metabolism [25]. To investigate whether ER stress was associated with the pathogenesis of hepatic steatosis, we studied GRP78 (glucose-regulated protein 78) by RT-PCR. GRP78 acts as an apoptotic regulator by protecting or promoting cell death during ER stress [26]. The RT-PCR results indicated that the GRP78 mRNA expression level was elevated in the experiment group, compared with the corresponding control groups (+ 44 %) (Fig. 6A). The 150-kDa oxygen-regulated protein (ORP150) is an anti-apoptotic ER resident chaperone that exerts a protective effect against ER stress-dependent apoptosis [27]. As shown in Fig. 6B, ORP150 mRNA expression was significantly increased in the HCD group compared with the control group (P < 0.05).
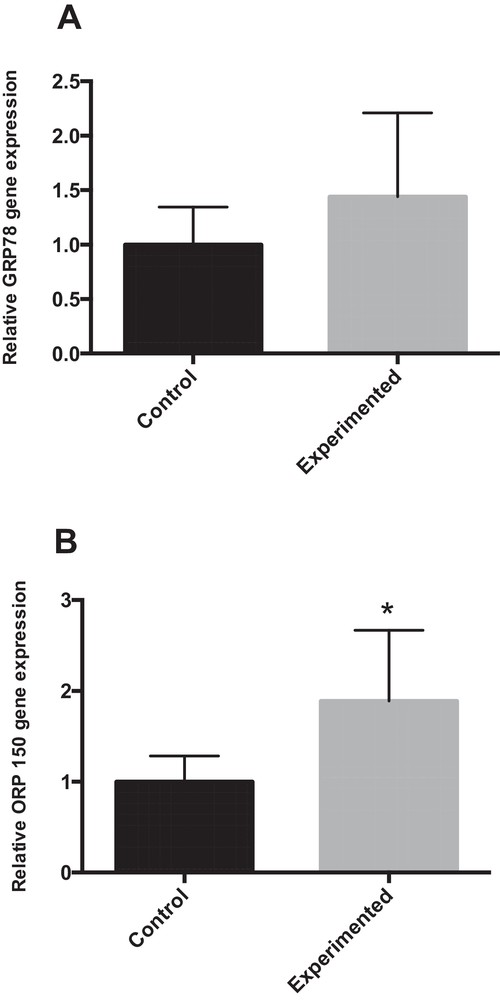
Expression of ER stress markers in the livers of control and experimental gerbils. * P < 0.05 vs. the corresponding values in control gerbils.
5 Discussion
In this study, after 24 weeks of feeding with HCD (dates and barley), gerbils exhibited increased body weight, visceral fat mass, visceral fat/body weight ratio, and liver/body weight ratio when compared with control animals. HCD treatment also caused significant increments in the plasma TC and TG levels, elevated hepatic TG and TC contents, and marked lipid droplet deposition in the liver sections, which are consistent with signs of fatty liver. At this time, the liver enzymes (ALT and AST) levels were normal, suggesting that the presence of NASH does not necessarily correlate with higher levels of these liver transaminases. Indeed, ALT levels are persistently normal in more than one half of the patients with NAFLD and biopsy proven NASH [28]. It is interesting to note that after 24 weeks of dietary treatment, the HCD group exhibited no significant changes (but a 14% increased trend) in the plasma glucose level. In addition, HCD induced hyperinsulinemia and insulin resistance (confirmed by HOMA-IR calculation).
Body fat distribution appears to be even more important than the total amount of adipose tissue, and the visceral fat mass is strongly linked to insulin resistance and NAFLD [29]. Visceral fat-released FFAs are transported to the liver by the portal vein and may contribute to hepatic steatosis, production of triglyceride rich VLDL, and elevated β-oxidation [30].
A large body of evidence supports a complex interaction between NAFLD and insulin resistance [31]. Some studies have suggested that the abdominal adipose tissue plays an important role in the development of insulin resistance [32]. Furthermore, visceral adipose tissue (VAT), a harmful fat deposit, has been considered to induce liver insulin resistance and further induce systemic insulin resistance [33].
This study demonstrates that a high-carbohydrate diet was able to induce obesity-related NAFLD in our experimental model. Animal models in which NAFLD was induced by simple carbohydrate-rich diets (usually fructose) are less numerous, and in most of them only hepatic steatosis was observed [34,35]. Hyperinsulinemia led to increased hepatic synthesis of fatty acids, triglyceride accumulation in the hepatocytes, with subsequent steatosis. Several in vivo and in vitro studies have indicated that hepatic TG deposition may not be harmful; rather, it may represent a protective mechanism against FFA-induced lipotoxic liver injury by storing FFAs in the form of TGs [36].
Increased calorie intake, especially refined sugar and fructose, correlates with increases in dyslipidemia, IR, and nonalcoholic fatty liver disease (NAFLD) [37]. NAFLD is the first step in the hepatic diseases that can evolve into steatohepatitis (NASH), with inflammatory infiltration resulting in cirrhosis, and even hepatocarcinomas [38].
Epidemiologic studies suggested that a diet high in refined carbohydrates (HCD) (50–65% of energy from carbohydrates, high glycemic index, and low in fiber) could promote NAFLD progression [39]. Our work demonstrates that gerbils fed a high glycemic index diet (GI for dates is 70) for 24 weeks had greater hepatic TGs and adiposity than gerbils fed a low glycemic index diet. Our results fit with those of Scribner et al. [40]. In addition, several experiments showed that the high-glycemic index carbohydrate has a close relationship with obesity, IR, and increased plasma and hepatic TGs [40]. The grade of hepatic steatosis seems to be associated with the glycemic index of the diet, regardless of total energy or carbohydrate intake [39]. The underlying mechanism is not fully elucidated, but some hypotheses have been proposed. Foods with high glycemic indices enhance the hepatic influx of glucose. The excess of hepatic glucose exceeds the ability of glycogen production; therefore, this carbohydrate will be used for the synthesis of new TG through DNL within the hepatocytes. An elevated-glycemic index food might augment oxidative stress, which can contribute to NASH development [41].
Similarly, Maersk et al. [42] found that a daily intake of 1 L of a sucrose-sweetened soft drink for six months increased liver lipids in overweight participants compared with the intake of the same amount of milk, diet cola, or water. Carbohydrate-induced accumulation of fat in the liver can lead to nonalcoholic fatty liver disease (NAFLD) [43].
The composition of diet and especially the amount of glucose/starch may influence the health effects of fructose. As fructose is present with glucose in most food products, it is more practical and relevant to look at the effects of fructose and glucose together than at the effects of fructose alone. A larger increase in DNL after eating fructose and glucose together (50:50 glucose:fructose) rather than the same amount of pure glucose has been shown [44]. Eating glucose with fructose is likely to affect fructose's health effects by stimulating the flow of fructose to DNL [45]. This effect could be due to both increased absorption capacity for fructose when co-ingested with glucose and therefore greater availability of fructose carbon atoms going towards DNL and increased blood insulin levels when glucose is present in the diet. Insulin stimulates DNL directly and indirectly by inhibiting other important metabolic pathways for fructose, such as gluconeogenesis.
In the present study, HCD-fed gerbil had severe hepatic steatosis. This HCD-induced elevated steatosis was associated with the significant upregulation of DNL genes, including FAS (an enzyme that catalyzes long-chain fatty acid biosynthesis through the condensation of acetyl-CoA and malonyl-CoA and ACC, as well as SREBP (a key regulator of fatty acid synthesis in the liver gene expression). This evidence is consistent with previous in vivo studies and clinical observations that HCD-induced NAFLD was associated with elevated hepatic DNL [39]. Donnelly et al. [4] observed that patients with NAFLD have elevated fasting DNL compared with healthy individuals. Altering dietary macronutrient contents can induce differential metabolic consequences in the liver [46]. Excessive dietary carbohydrates induced glucose conversion to FA by DNL [46]. It is important to note that diets rich in complex carbohydrates and fibers did not induce clinical DNL in humans, suggesting a potential interaction between digestibility/structure of carbohydrates and DNL [47]. The deleterious effect of our diet is attributed to dry dates that contain essentially simple sugars.
The liver is the major organ involved in cholesterol metabolism. Sterol regulatory element-binding protein-2 (SREBP-2) promotes the expression of target genes involved in cholesterol biosynthesis and uptake in the liver, such as 3-hydroxy-3-methylglutaryl-CoA synthase (HMGCS) and 3-hydroxy-3-methylglutaryl-CoA reductase (HMGCR) [24]. The data from the present investigation (Fig. 4) showed that the SREBP-2 precursor and nuclear active forms as well as the HMGCR and HMGCS target genes were significantly up-regulated by HCD in gerbil.
Previous research has shown that a fatty liver induced by a high saturated fat diet shows signs of endoplasmic reticulum (ER) stress in a rodent model [48]. The endoplasmic reticulum is an important organelle responsible for protein synthesis, folding, assembly and transport in eukaryotic cells. GRP78 is a member of the HSP70 family abundant in the lumen of ER, and plays important roles as a molecular chaperone that removes misfolded proteins in ER lumen. Overexpression of GRP78 has been shown to increase ER stress resistance and to have beneficial effects in several cell types [49]. In addition, the survival response activates genes that encode ER-residing chaperones such as GRP78/Bip, which uses energy derived from ATP hydrolysis to prevent the aggregation of ER proteins, and is considered the classical marker of UPR activation.
To confirm the involvement of ER in fatty liver developed in our experimented gerbils, we studied GPR78 and ORP150 by quantitative RT-PCR, and the data in Fig. 5 show that GRP78 moderately increased in G. gerbillus liver. It was demonstrated that obesity is associated with the induction of ER stress predominantly in the liver and adipose tissues [50]. Previous research has shown that fatty liver induced by a high sucrose diet and high saturated fat diet shows clear ER stress events in a rodent model [48].
In the current study, we observed a coordinated transcriptional upregulation of lipogenesis genes together with ER stress. Lipid accumulation and lipotoxicity are known to positively regulate the ER stress response through a cycle that leads to further toxic insults upon the liver [51].
Abnormal ER stress contributes substantially to hepatocyte cell death during altered lipid metabolism [24]. Thus, modulation of hepatic ER stress becomes crucial in the understanding of the extent of its contribution to the pathogenesis of various hepatic disorders. Induction of ORP150 exhibits protective roles in the prevention of ER stress [27] and dysregulation of calcium homeostasis and apoptosis. Our work showed that the levels of ORP150 in the liver of control gerbils were significantly greater compared with that of experimented gerbils (Fig. 5B), which supports the speculation that ORP150 expression could be beneficial under the local challenging conditions of ER stress.
The induction of ORP150 mediates the amelioration of hepatic ER stress and apoptosis by AMPK in vitro and in vivo. [52] Collectively, these results indicate that chronic HC diet altered, at least partially, endoplasmic reticulum functions and induced stress conditions.
Collagen 1A1 (Col1A1) is the major hepatic collagen subtype associated with NASH in rodents and humans [53]. HC-feeding for 24 weeks greatly elevated biochemical and histological markers of fibrosis. The fibrotic status of the liver is governed by a balance between extracellular matrix (ECM) deposition and turnover. The biochemical (expression of αSMA) and histological evidence of fibrosis (Fig. 1) in HC fed gerbils provide clear evidence that the rate of collagen production exceeds that of its degradation.
Although it has been widely proposed that stellate cells are the main contributor to ECM deposits in the liver, it is possible that other cell types are involved [54]. MMPs are a family of zinc-dependent proteinases that are responsible for the degradation of ECM proteins. MMP dysregulation has been implicated in the pathophysiology of obesity and diabetes.
Overwhelming evidence indicates that the perisinusoidal hepatic stellate cells (HSCs) are the major source of liver fibrosis of any etiology [55]. During liver injury, HSCs transdifferentiate from their quiescent physiologic to the fibrogenic phenotype. Such a transformation is induced by inflammatory mediators (e.g., TNFα) and reactive oxygen species and apoptotic bodies arising from dying hepatocytes, and activated HSCs are characterized by expression of αSMA, a marker not found in quiescent HSCs [56,57].
Activation of HSCs is further characterized by the overexpression of α-SMA, MMP-2, and MMP-9 [58]. Although the role of HSC activation in nonalcoholic fatty liver disease (NAFLD) has not been completely clarified, several studies have reported increased HSC activation in nonalcoholic steatohepatitis (NASH) [59].
Several studies have demonstrated that insulin resistance is associated with advanced stages of fibrosis in NAFLD [60]. Because insulin promotes HSC activation and insulin sensitizers can attenuate hepatic fibrosis in NASH, it has been suggested that insulin resistance plays an important role in NASH-related fibrogenesis [61]. It is understood that oxidative stress induces the activation of HSCs in NASH [62].
In addition to liver fibrosis, it is well-established that oxidative stress also is very important in the development and progression of NASH. It has been shown that chronic oxidative stress, generated through the oxidation of cytotoxic free fatty acids, may lead to cytokine upregulation and depletion of hepatic antioxidant levels [63]. In addition, enhanced lipid peroxidation leads to the generation of reactive by-products, such as MDA, which have been shown to further stimulate cytokine production [64]. In the current study, there was a significant decrease in GSH content and SOD activity in HC-fed gerbils, and a significant increase in MDA levels. These findings are in agreement with those of Leclercq [65], who reported that diets with high amounts of simple carbohydrates induce hypertriglyceridemia, resulting in a reduction of the antioxidant reserves [65].
Most previous studies reported alterations in the expression and activity of antioxidant enzymes in the liver of fructose-fed rodents, although the course of these alterations varied largely. Some authors observed that a fructose-rich diet reduced the antioxidant capacity and caused oxidative damages in the liver [66], whereas others reported the absence of oxidative stress [67] or adaptation to modest oxidative stress [68] in fructose-fed rats. Alternatively, Girard et al. [69] noticed that a fructose-rich diet enhanced the total antioxidant capacity of the liver.
6 Conclusion
In summary, the present study demonstrates that a long-term (24-week) consumption of a high-carbohydrate diet induces adiposity, insulin resistance, up-regulation of de novo lipogenesis, ER stress, oxidative stress, and finally fatty liver. Altogether, these results suggest that G. gerbillus represents a valuable natural model for human diet-induced metabolic disorders and NAFLD.
Disclosure of interest
The authors declare that they have no competing interest.
Acknowledgments
We would like to thank Professor Ahmed Menad for her help and collaboration.