

1 Introduction
Bread wheat (Triticum aestivum L., 2n = 6x = 42, AABBDD), is the most dominant cereal crop species worldwide with approximately 600 Mt of wheat harvested worldwide, of which about 80% is used for human food [1]. Iran is considered as a primary center of wheat genetic diversity, and a recent study indicated Caspian Iran to be the main source of the wheat D genome [2,3]. Bread wheat is the major staple of Iranian diet and energy intake and its yield has always been a major concern for agronomists and wheat producers in Iran. In Iran, since 1942, breeding efforts have led to the development of many cultivars adapted to various climatic conditions and a wide range of temperatures. To enrich the genetic variation of Iranian wheat germplasm, a number of exotic wheat materials have also been introduced into the Iranian wheat germplasm in collaboration with international research centers, such as CIMMYT [4]. However, as the size of the germplasm increases, utilizing such enriched variation available for various quantitative traits is difficult. Therefore, new tools are required for mining quantitative trait variation within germplasm resources very rapidly and efficiently [5].
A new useful tool is the identification of polymorphic markers associated with phenotypic variation for various traits in natural populations or a random set of individuals by means of association analysis [6,7]. This approach presents a number of advantages over conventional QTL mapping for the development of new cultivars via marker-assisted selection [6]. QTL mapping requires a bi-parental mapping population showing segregation usually for a specific trait of interest that is time-consuming and expensive [8]. In contrast, association analysis utilizes ancestral recombination and genetic diversity within a natural population to dissect various quantitative traits [9]. However, population structure caused by natural/artificial selection and complex familial relationships are the main constraints for a successful association analysis that can result in spurious marker–trait associations in human or plant genetics [10,11]. These factors could make it difficult to distinguish the true linkage disequilibrium (LD) between physically linked loci from the LD resulted from unlinked loci causing positively false associations between polymorphic markers and phenotypic variation. Population structure can be inferred by the STRUCTURE software developed by Pritchard et al. [12], which assigns individuals to subpopulations (Q-matrix) using the Bayesian clustering method. The pairwise familiar relationships between individuals (K-matrix) can be estimated based on marker data using various computer programs such as TASSEL, developed by Bradbury et al. [13]. Yu et al. [10] have developed a unified linear mixed model for association analysis that accounts for both Q- and K-matrix (also known as Q + K model), implemented in TASSEL. This method has proven to be a powerful approach that effectively decreases type-I error rates (false positives) and increases the power of the marker–trait association tests [10].
Previous studies have shown that there is a considerable genetic variation within bread wheat germplasm hold by Seed and Plant Improvement Institute (SPII, Karaj, Iran) based on SSRs [4], ISSRs, and retrotransposon-based markers [14,15]. However, detailed analysis of associations between marker polymorphisms and phenotypic variations for such a germplasm remained untapped and uncharacterized. In this study, ISSR, REMAP, and IRAP markers were used to examine the preliminary evidence for associations between molecular markers and quantitative traits variation in a diverse set of 97 bread wheat cultivars and lines. We applied a mixed linear model method incorporating both population structure and genetic relatedness to assess marker–trait associations.
2 Materials and methods
2.1 Plant material and phenotypic data
The plant material comprised 97 accessions including 48 Iranian bread wheat (T. aestivum L.) cultivars and 49 breeding lines provided by the Seed and Plant Improvement Institute, Karaj, Iran (Supplementary Table 1). All accessions were planted at experimental farm of Faculty of Agriculture, Urmia University, Urmia (Iran), during the 2012–2013 growing season. The experiment was conducted on the basis of randomized complete block design (RCBD) with three replications. The experimental plot consisted of a 1-m-long single row with a spacing of 30 cm. During the growing season, the data were recorded on the basis of five individual plants for each plot. Eighteen agronomical traits including plant height (cm), peduncle length (cm), flag leaf length (cm), flag leaf width (cm), flag leaf area (cm2), flag leaf weight (g), stem diameter (mm), number of node, days to flowering, spike length (cm), awn length (cm), spike density, biological yield in row (g), number of spikelets spike−1, number of grains spike−1, grain yield in row (g), thousand grain weight (g) and harvest index (%) were considered in this study based on IBPGR descriptors [16]. Since we were not interested in the variation within accessions due to the highly selfing nature of wheat, the data for each trait were averaged prior to analysis and expressed as plot value per accession. Phenotypic means calculated for each accession were used for subsequent association analysis. Descriptive statistics such as minimum, maximum, mean, standard deviation, environmental coefficient of variation and broad sense heritability were determined for each phenotypic trait.
2.2 Genomic studies
Genomic DNA was extracted from young leaves of 20-day-old seedlings of five plants from each genotype using the method described by Ausubel et al. [17], with minor modifications.
The concentration and quality of genomic DNA was determined by a spectrophotometer and by 0.8% agarose gel electrophoresis. Primer combinations, PCR conditions, electrophoresis and visualization of PCR products for ISSR and retrotransposon-based markers (IRAP and REMAP) have been described by Dashchi et al. [14] and Nasri et al. [15], respectively. In total, 23 ISSR, 9 IRAP, and 20 REMAP primers were chosen to test for associations between markers and 18 quantitative traits in the current study.
2.3 Analysis of genetic structure and marker-trait associations
We used the program STRUCTURE version 2.3.4 [12] to investigate the genetic structure (Q) among wheat accessions on the basis of ISSR, IRAP and REMAP markers. The number of groups (K) was set from 1 to 20, and 10 independent runs were performed for each K. A length of 100,000 burn-in and 100,000 MCMC (Markov Chain Monte Carlo) replications were used for the analysis of the genetic structure. The admixture model with correlated allele frequencies was considered. To determine the optimal number of groups, as described by Evanno et al. [18], an ad hoc statistic ΔK was applied. The neighbour-joining clustering algorithm among accessions was run on the basis of the whole number of markers using the TASSEL 3 software [13].
Prior to the analysis of marker-trait associations, all bands with minor allele frequencies less than 0.05 or major frequencies greater than 0.95 were removed from the analysis. Two statistical models were used and compared:
- • the Q model incorporating the Q-matrix as covariate and performed using a general linear model (GLM);
- • the Q + K model incorporating both the Q- and K-matrices using the mixed linear model (MLM) implemented in TASSEL 3.
The Q-matrix was extracted from the STRUCTURE output from the identified optimal group, i.e. K = 4 for the current studied population. The K-matrix is a matrix of pairwise relatedness between accessions calculated from marker data using the TASSEL 3 software. For all traits, the Q + K model performed significantly better than the Q model. Thus, we concluded that MLM approach can significantly reduce the spurious marker–trait associations (type-I error showing false positives). Hence, only the results obtained from MLM were shown and discussed for this study. Significant associations between a marker locus and a trait (i.e. whether a QTL was associated with a marker or not) was indicated by the P-value, and the magnitude of QTL effects was examined by R2-marker. A false discovery rate (FDR) of 0.01 was used as a threshold for significant association using Bonferroni's correction [19].
3 Results
3.1 Phenotypic analysis
Basic descriptive statistics for quantitative traits are presented in Table 1. The data showed a wide range of variation for all studied traits. The maximum value of environmental coefficient of variation (CV) observed for awn length (20.72%) and grain yield in row (20.41%). The other remaining traits recorded moderate to low CV values, ranging from 19.82% for thousand-grain weight to 1.97% for days to flowering. Broad sense heritability (h2) is a suitable indicator of the trait repeatability and the proportion of trait variation accounted for by genetic factors. The minimum amount of heritability obtained for number of node (17.70%). Twelve out of the 18 studied traits showed a value of broad-sense heritability of more than 65% (Table 1).
Descriptive statistics of the 18 traits studied in 97 wheat cultivars and breeding lines.
| Traits | Abbreviations | Min. | Max. | Mean | Standard deviation | CV | h 2 |
| Plant height (cm) | PLH | 34.25 | 125.37 | 88.74 | 16.09 | 11.08 | 88.74 |
| Peduncle length (cm) | PDL | 10.40 | 59.83 | 36.31 | 8.18 | 19.74 | 43.57 |
| Flag leaf length (cm) | FLL | 15.17 | 31.45 | 24.26 | 3.11 | 12.53 | 40.00 |
| Flag leaf width (cm) | FLW | 1.10 | 2.25 | 1.71 | 0.27 | 9.92 | 67.39 |
| Flag leaf area (cm2) | FLA | 21.48 | 70.71 | 41.94 | 10.19 | 17.86 | 57.96 |
| Flag leaf weight (g) | FLT | 0.09 | 0.38 | 0.20 | 0.07 | 18.62 | 71.11 |
| Stem diameter (mm) | STD | 2.65 | 5.20 | 3.85 | 0.66 | 11.38 | 63.70 |
| Number of node | NON | 3.67 | 5.67 | 4.67 | 0.39 | 10.76 | 17.70 |
| Days to flowering | DTF | 108.33 | 137.00 | 122.75 | 6.58 | 1.97 | 86.32 |
| Spike length (cm) | SPL | 5.75 | 16.18 | 11.47 | 2.31 | 8.73 | 81.69 |
| Awn length (cm) | AWN | 0.00 | 13.40 | 6.60 | 2.94 | 20.72 | 79.56 |
| Spike density | SPD | 8.60 | 24.69 | 15.17 | 3.65 | 14.02 | 71.67 |
| Biological yield in row (g) | BIY | 178.13 | 1283.20 | 716.86 | 220.65 | 19.29 | 66.59 |
| Number of spikelets spike−1 | NSS | 8.33 | 22.33 | 16.61 | 2.41 | 11.06 | 53.98 |
| Number of grains spike−1 | NGS | 8.67 | 91.67 | 46.63 | 24.19 | 15.51 | 89.95 |
| Grain yield in row (g) | GRY | 39.00 | 479.50 | 221.29 | 92.72 | 20.41 | 76.90 |
| Thousand grain weight (g) | TGW | 12.06 | 83.61 | 36.05 | 14.34 | 19.82 | 74.51 |
| Harvest index (%) | HAI | 6.43 | 77.73 | 37.73 | 14.69 | 17.49 | 79.25 |
3.2 Population structure
Genome of studied individuals was surveyed using 9 IRAP, 20 REMAP and 23 ISSR primers. A total of 658 clear and reproducible bands were scored, of which 86% (572) were polymorphic among genotypes. No less common loci with frequency lower than 50% were amplified. The number of total loci per primer ranged from 7 (UBC844) to 18 (wilma-bagy2), with an average of 12.65. The number of polymorphic loci per primer ranged from 5 to 18. The size of the amplified fragments ranged from 75 to 2000 bp.
The results of model-based clustering analyses showed the highest peak at K = 4 (Fig. 1), suggesting that the analyzed wheat germplasm can be divided into four genetically distinct groups or populations (Fig. 2). In general, most of the lines located in population A and B, while most of the cultivars were in populations C and D. Individuals with a cluster membership coefficient higher than 0.8 in a population were assigned to that population, while those with a cluster membership coefficient less than 0.8 were considered as mixed individuals. Based on this criterion, three mixed genotypes were identified in each population of A and B. In populations C and D, 8 and 1 mixed samples were detected, respectively. Overall, 15 mixed individuals (15.5%) were found at K = 4. Cluster analysis using the neighbor-joining method also placed the studied germplasm into four main groups, which was mostly in concordance with the results of the model-based clustering method (Fig. 3).
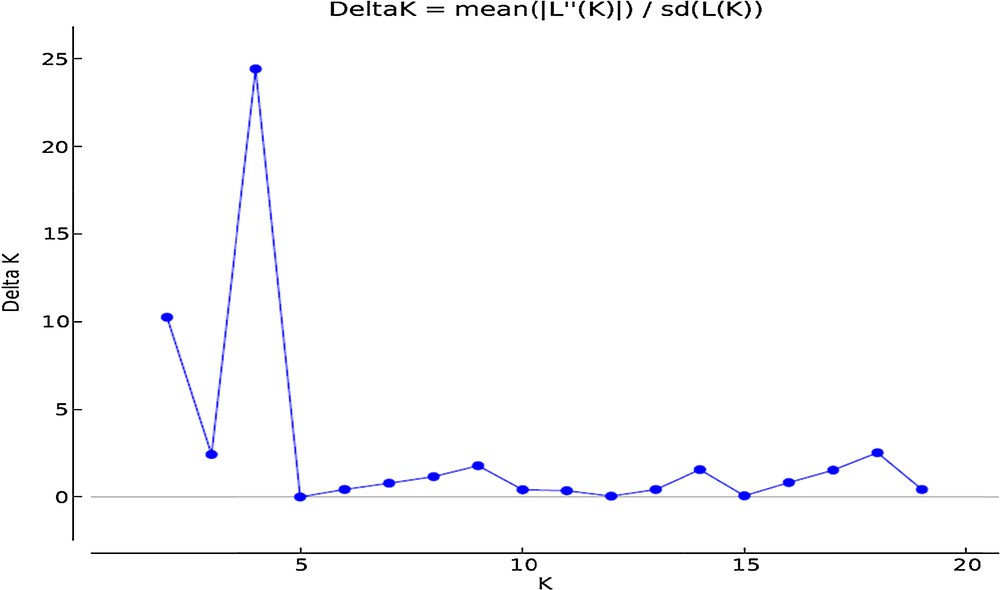
A biplot detected the maximum peak at K = 4 (the optimum number of clusters) based on Evanno et al.’s [18] prediction in the studied wheat germplasm.
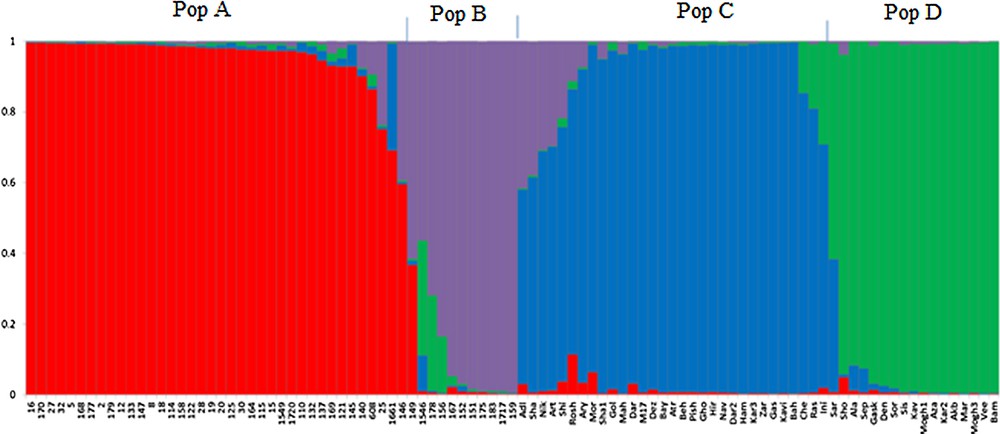
Bayesian model-based clustering of 97 bread wheat individuals using IRAP, REMAP and ISSR markers. Each color shows a sub-population or cluster.
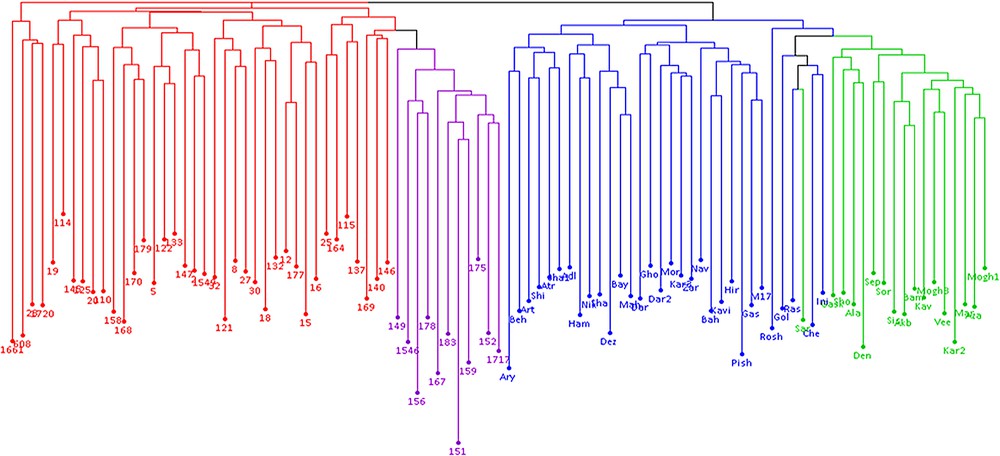
Neighbor-joining dendrogram of 97 wheat genotypes based on ISSR, IRAP and REMAP markers; colors correspond to structure-derived sub-populations.
3.3 Analysis of marker–trait associations
The MLM method was used to identify associations between markers and studied traits. Significant associations between markers and morphological traits along with their corresponding R2 and P-value are presented in Table 2. All markers reported in this table were significant at a comparison-wise error rate of 0.01. Ninety-four loci were identified to be associated with studied traits, consist of 41 ISSRs, 10 IRAPs and 43 REMAPs. The highest number of associated markers (11) was found for the number of spikelet spike−1, while the lowest was for the grain yield in row (2). Locus ISSR16-9 (A12) was associated with three traits (peduncle length, flag leaf area, and flag leaf width). Out of the associated IRAP loci, IRAP2-7 (flag leaf area and flag leaf width) and IRAP5-8 (number of spikelets spike−1 and awn length) was linked each with two traits. REMAP13-10 was linked with three traits (spike density, days to flowering, and spike length). Each associated marker explained a maximum regression from 2% (number of grains spike−1) to 17% (spike density) of the total available variation for the individual associated traits.
List of the markers associated with the studied traits in bread wheat collection.
| Marker | P | R 2 | Marker | P | R 2 | Marker | P | R 2 |
| Plant height | Peduncle length | Days to flowering | ||||||
| ISSR5-7 | 0.001 | 0.10 | ISSR21-3 | 0.005 | 0.07 | ISSR3-2 | 3.00E-04 | 0.08 |
| ISSR6-1 | 4.00E-04 | 0.12 | ISSR6-11 | 0.007 | 0.06 | ISSR18-2 | 0.007 | 0.03 |
| ISSR21-3 | 0.004 | 0.08 | ISSR9-9 | 0.009 | 0.06 | REMAP11-6 | 0.003 | 0.05 |
| IRAP8-14 | 0.003 | 0.08 | ISSR16-9 | 0.008 | 0.06 | REMAP9-14 | 0.006 | 0.04 |
| REMAP8-5 | 0.004 | 0.08 | ISSR21-10 | 0.009 | 0.06 | REMAP13-10 | 0.008 | 0.03 |
| REMAP9-14 | 0.001 | 0.10 | REMAP11-12 | 0.008 | 0.06 | REMAP2-1 | 0.009 | 0.05 |
| REMAP7-5 | 0.010 | 0.04 | ||||||
| Flag leaf length | Flag leaf area | Stem diameter | ||||||
| ISSR12-13 | 0.010 | 0.06 | ISSR16-9 | 0.002 | 0.06 | ISSR23-10 | 0.005 | 0.03 |
| ISSR1-10 | 0.004 | 0.08 | IRAP2-7 | 0.010 | 0.04 | ISSR23-6 | 0.008 | 0.03 |
| REMAP11-2 | 0.007 | 0.07 | REMAP17-10 | 0.006 | 0.05 | IRAP2-9 | 0.004 | 0.03 |
| REMAP10-3 | 0.003 | 0.08 | REMAP15-14 | 0.003 | 0.06 | REMAP10-8 | 0.003 | 0.03 |
| Flag leaf weight | Number of node | Thousand grain weight | ||||||
| ISSR7-10 | 0.004 | 0.05 | ISSR11-10 | 5.00E-04 | 0.10 | ISSR23-1 | 7.00E-04 | 0.09 |
| ISSR1-3 | 0.005 | 0.05 | ISSR11-4 | 0.004 | 0.08 | REMAP3-13 | 0.004 | 0.05 |
| REMAP5-7 | 0.001 | 0.06 | ISSR6-4 | 0.009 | 0.07 | REMAP1-11 | 0.004 | 0.06 |
| REMAP20-1 | 0.007 | 0.05 | REMAP3-10 | 0.006 | 0.07 | REMAP13-6 | 0.005 | 0.06 |
| REMAP14-2 | 0.010 | 0.05 | ||||||
| Flag leaf width | Number of spikelets spike−1 | Spike length | ||||||
| ISSR16-5 | 0.005 | 0.04 | ISSR6-1 | 0.002 | 0.10 | ISSR18-2 | 0.009 | 0.06 |
| ISSR16-9 | 0.002 | 0.06 | ISSR5-12 | 0.002 | 0.10 | IRAP5-13 | 0.010 | 0.06 |
| IRAP2-7 | 0.001 | 0.07 | ISSR16-6 | 0.009 | 0.06 | REMAP13-8 | 5.00E-04 | 0.10 |
| REMAP15-14 | 0.002 | 0.05 | IRAP5-8 | 0.003 | 0.08 | REMAP15-1 | 0.005 | 0.07 |
| REMAP7-5 | 0.004 | 0.05 | IRAP2-13 | 0.009 | 0.06 | REMAP13-10 | 3.00E-05 | 0.10 |
| REMAP15-2 | 0.008 | 0.04 | REMAP15-1 | 0.004 | 0.07 | |||
| REMAP17-7 | 0.008 | 0.04 | REMAP19-1 | 0.003 | 0.09 | |||
| REMAP13-9 | 0.009 | 0.06 | ||||||
| REMAP13-8 | 0.003 | 0.08 | ||||||
| REMAP4-9 | 0.010 | 0.06 | ||||||
| REMAP8-13 | 0.010 | 0.06 | ||||||
| Awn length | Spike density | Number of grains spike−1 | ||||||
| ISSR15-4 | 0.001 | 0.10 | ISSR9-9 | 0.002 | 0.09 | ISSR3-2 | 0.001 | 0.04 |
| ISSR16-5 | 0.004 | 0.08 | ISSR14-4 | 0.001 | 0.08 | ISSR21-12 | 0.006 | 0.03 |
| IRAP7-13 | 0.002 | 0.09 | REMAP13-10 | 4.59E-06 | 0.17 | ISSR3-3 | 0.005 | 0.03 |
| IRAP5-8 | 0.002 | 0.09 | REMAP13-11 | 0.002 | 0.08 | IRAP8-7 | 0.007 | 0.03 |
| REMAP19-13 | 0.002 | 0.09 | REMAP18-2 | 0.008 | 0.06 | REMAP4-1 | 0.001 | 0.05 |
| REMAP20-4 | 0.008 | 0.07 | REMAP15-9 | 7.00E-04 | 0.02 | |||
| Biological yield | Grain yield | Harvest index | ||||||
| ISSR21-9 | 0.009 | 0.06 | ISSR2-6 | 0.009 | 0.04 | ISSR13-10 | 0.002 | 0.04 |
| ISSR13-7 | 0.009 | 0.06 | REMAP4-1 | 0.002 | 0.06 | ISSR2-6 | 0.003 | 0.04 |
| REMAP13-8 | 0.001 | 0.10 | ISSR13-7 | 0.006 | 0.03 | |||
| ISSR21-9 | 0.007 | 0.03 | ||||||
| REMAP10-1 | 0.010 | 0.03 |
4 Discussion
Genetic diversity in wheat was increasingly narrowed down during the second part of the 20th century due to the wide adoption of improved semi-dwarf wheat cultivars and modern breeding practices [20]. Hence, knowledge about the genetic diversity and relationships of genotypes provides useful information to address breeding programs and germplasm resource management [21–23]. However, the high level of polymorphism detected in the studied germplasm may be attributed to the different pedigrees of the genotypes (Supplementary Table 1) and high insertional activity of the retroelements used for designing IRAP and REMAP primers [15]. Both Bayesian-based clustering method and neighbor-joining analysis placed 97 wheat genotypes in four distinct groups, suggesting that retrotransposon-based and ISSR markers provide powerful tools to investigate genetic relationships among wheat cultivars and lines.
A wide range of variation detected for morphological traits in the studied germplasm and molecular markers used in this study provide an opportunity to test preliminary evidence for marker–trait associations. Since mapping information of markers was not available, the extent of disequilibrium among the linked markers remains the challenge in association analysis. However, the MLM method was applied in this study which accounts for both kinship and population structure. A cut-off value of 0.01 for the false discovery rate was used to identify the associated loci. Ninety-four loci (IRAP = 10; REMAP = 43; ISSR = 41) showed significant association (P ≤ 0.05) with QTLs, controlling the studied traits in the association panel (Table 2). Some markers were linked with more than one trait: REMAP13-10 with days to flowering, spike length and spike density, REMAP4-1 with grain yield in row and number of grains spike−1, IRAP2-7 with the flag leaf area and flag leaf width, IRAP5-8 with number of spikelets spike−1 and awn length, ISSR16-9 with the flag leaf area, flag leaf width and peduncle length, ISSR2-6 with grain yield in row and harvest index. Markers associated with more than one trait might be due to the pleiotropic effects of the marker loci or close linkage between the loci controlling the traits. An important advantage of association mapping is that it is highly efficient in detecting multiple QTLs in the same genetic network at the same time, and provides opportunities to understand the pleiotropic effects of some chromosome regions, QTLs or genes [24,25]. The common markers lead to an increase in the efficiency of MAS in plant-breeding programs via simultaneous selection for several traits. Highly significant markers with great R2 values such as REMAP13-10 (R2 = 0.17, associated with spike density) and ISSR6-1 (R2 = 0.12, associated with plant height) would be interesting for further work. Although such results require further validation in mapping populations or different germplasms, the markers showing highest effects provide ideal candidates for future studies and future marker-assisted selection programs. It is noteworthy that the type and number of the markers as well as association analysis with unmapped dominant markers used in the current study may not be enough for identifying markers associated with morphological traits in wheat.
5 Conclusion
A wide range of variation was found for the traits in the studied wheat collection, which allow us to detect marker–trait associations in this germplasm. Also, retrotransposons and ISSR markers revealed high level of insertional polymorphism and genetic variability in this collection. MLM-based association analysis identified 94 loci significantly related to the 18 traits. Markers REMAP13-10 and ISSR6-1 with a large size of R2 values and low level of P-values would be potentially ideal markers to be used in wheat-breeding programs. Also, identified markers linked with more than one trait in the current study may increase the efficiency of MAS in wheat breeding programs via simultaneous selection for several traits.
Acknowledgments
The authors thank Urmia University for financial support of the work as well as Institute of Biotechnology of Urmia University for providing lab facilities.