

1 Introduction
Polygonati rhizoma (PR), the rhizomes of Polygonatum sibiricum Redouté, P. cyrtonema Hua, and P. kingianum Collett & Hemsley, have been used as edible products during famine [1] and by Taoists and Buddhists to survive during breatharianism in China [2]. The three species are perennial herbs belonging to the family Asparagaceae [3]. In the Tang Dynasty (618 A.D.), Zhang Ji, a famous poet, once wrote “if you have more fields, go and plant more polygonati rhizoma” [2,4], which indicates that PR has been cultivated since the time of the Tang Dynasty. PR can be added to many kinds of food and has become popular in China. Polygonatum polysaccharides, its dominant and effective constituents, have many pharmacological functions [5–7]. Modern pharmacology shows that PR enhances immunity [8] and memory [9], reduces blood glucose [10] and fat levels [11], and has antibacterial [12], antiviral [13], antitumor [14], and antiaging effects [15].
Germplasms collection and identification are necessary for resources conservation, improved selection of varieties, and genetic improvement of PR. Until now, only three prescriptive species of Polygonatum rhizomes have been recorded in Chinese Pharmacopoeia by China Food and Drug Administration, and other species, such as the rhizomes of P. macropodum Turcz., P. verticillatum (L.) All., and P. odoratum (Mill.) Druce [16], are yet to be confirmed. As the phenotypic characteristics of the rhizome easily change with its growth, they may be misidentified for PR with similar rhizome traits. Especially, the rhizomes of P. odoratum (polygonati odorati rhizome), another traditional Chinese medicine, are similar morphologically to those of P. cyrtonema, but with different pharmacological values. Besides, the increasing demand for this plant decreases gradually the natural populations of PR, thereby restricting the sustainable utilization of the PR [17]. Increasing presence of fake products of PR in the market due to the globalization of traditional Chinese medicine necessitates a rapid and efficient identification method of PR rhizomes. The three species used as PR differ from P. odoratum in several phenotypic traits of aerial parts: verticillate vs. alternate leaves, cirrhous vs. cuspidate leaf apex, red vs. green leaf sheath. Hence, these morphological characteristics are suitable for precise identification of the content of PR. However, when the rhizomes are in a dormant state [18–20], their identification becomes complicated, time consuming, and even ineffective. Thus, the evaluation of phenotypic traits leads to limited germplasm identification due to the small number of descriptors and to insufficient quantitative traits such as plant height, stem diameter, leaf length, and leaf width.
Methods combining morphological and molecular markers have been widely used for the identification of a number of germplasms, such as yardlong bean [21], mung bean [22], artichoke [23], haploid maize [24], Spanish olive cultivars [25], durum wheat [26], and Curcuma comosa Roxb. [27]. Molecular markers, such as restriction fragment length polymorphism, amplified fragment length polymorphism, random amplification of polymorphic DNA, inter-simple sequence repeat (ISSR), single-nucleotide polymorphism, start codon targeted (SCoT), and others, are powerful tools for the identification of species at the DNA level. Molecular markers are not dependent on the environment and can delineate accurately the plants by describing the genetic relationships among taxa. Of the different methods implementing molecular markers, ISSR and SCoT have been widely used for germplasm identification of different taxa because they require low quantities of plant material, they are simple to operate, and do not require prior information about plant genomic sequences, while providing effective information that can be implemented in genetic breeding, genomic mapping, and species identification. In addition, its operation is not limited in time and space. For example, the ISSR markers have been used to identify Polygonatum sibiricum, P. cirrhifolium (Wall.) Royle, P. filipes Merr. ex C. Jeffrey & McEwan, and P. cyrtonema in China [28,29]. The SCoT markers have been used for evaluating genetic diversity in medicinal Chrysanthemum morifolium Ramat. [30], Dendrobium [31], Tunisian citrus [32], chickpea [33], Chinese Elymus sibiricus L. [34], and Polygonatum germplasms [35]. However, the SCoT markers have never been used for identification of PR species.
The aim of the present study was to test whether the ISSR and SCoT markers can be used to identify the PR species. To that end, we adopted both morphological characteristics analysis and ISSR and SCoT methods to identify PR samples collected from 47 different regions in southern China. The fresh rhizomes were identified based on their morphological characteristics and cultivated to score and analyze morphological characters. The ISSR [36] and SCoT [32,37] markers were developed and implemented for the identification of the specimens. Finally, the identification results by both morphological characteristics and molecular markers schemes were compared.
2 Material and methods
2.1 Plant material
Polygonatum rhizomes were collected from 47 different germination areas in China: Anhui (5), Chongqing (2), Fujian (1), Guangdong (2), Guangxi (4), Guizhou (4), Henan (7), Hubei (2), Hunan (1), Jiangxi (3), Shaanxi (2), Sichuan (2), Yunnan (6), and Zhejiang (6) Provinces. Table 1 shows the information on the preliminary taxonomic classification, the geographic origin, and the phenotypic traits of rhizomes. Approximately 100 rhizomes free of lesions and mildew infection were selected from each region and screened primarily for morphological features such as their thickness, number of nodes, and diameter of tubercle. Fresh tissue samples (0.5 g) were cut out from five rhizomes from each region, rinsed with distilled water, dried with filter paper, and preserved at −80 °C for DNA isolation.
Samples of polygonati rhizoma.
| Serial number | Geographic origin | Morphological traits | Preliminary taxonomic classification | |||
| Rhizome length/mm | Rhizome diameter/mm | Nodal diameter/mm | Rhizome shape | |||
| S1 | Chizhou, Anhui | 12.63 ± 8.85 | 11.54 ± 5.45 | 11.89 ± 3.60 | Beaded | Polygonatum cyrtonema Hua. |
| S2 | Luan, Anhui | 15.44 ± 6.94 | 10.96 ± 2.83 | 16.18 ± 7.58 | Beaded | P. cyrtonema Hua. |
| S3 | Qingyang, Anhui | 17.23 ± 2.73 | 14.57 ± 2.37 | 20.00 ± 4.70 | Beaded | P. cyrtonema Hua. |
| S4 | Jingxian, Anhui | 35.58 ± 7.56 | 30.96 ± 2.18 | 27.87 ± 2.01 | Beaded | P. cyrtonema Hua. |
| S5 | Huangshan, Anhui | 32.27 ± 11.44 | 21.06 ± 4.00 | 23.37 ± 5.18 | Beaded | P. cyrtonema Hua. |
| S6 | Wulong, Chongqing | 21.44 ± 11.17 | 15.39 ± 8.27 | 19.78 ± 10.29 | Beaded | P. cyrtonema Hua. |
| S7 | Qijiang, Chongqing | 7.28 ± 1.83 | 12.34 ± 3.24 | 18.05 ± 4.67 | Beaded | P. cyrtonema Hua. |
| S8 | Zhenghe, Fujian | 11.96 ± 3.26 | 15.01 ± 7.38 | 19.08 ± 5.40 | Beaded | P. cyrtonema Hua. |
| S9 | Shaoguan, Guangdong | 15.55 ± 1.88 | 18.74 ± 3.77 | 17.74 ± 1.85 | Beaded | P. cyrtonema Hua. |
| S10 | Qingyuan, Guangdong | 10.08 ± 5.43 | 9.47 ± 3.38 | 10.34 ± 1.12 | Beaded | P. cyrtonema Hua. |
| S11 | Chongzuo, Guangxi | 29.04 ± 14.43 | 6.01 ± 2.31 | 9.09 ± 1.79 | Beaded | P. cyrtonema Hua. |
| S12 | Hezhou, Guangxi | 21.82 ± 5.76 | 13.53 ± 3.89 | 16.22 ± 8.48 | Beaded | P. cyrtonema Hua. |
| S13 | Yizhou, Guangxi | 16.55 ± 4.98 | 11.51 ± 1.88 | 11.95 ± 3.66 | Beaded | P. cyrtonema Hua. |
| S14 | Baise, Guangxi | 40.80 ± 8.11 | 27.82 ± 4.68 | 23.91 ± 4.03 | Approximately beaded | Polygonatum kingianum Collett & Hemsley |
| S15 | Tongren, Guizhou | 3.76 ± 1.34 | 9.19 ± 4.59 | 12.35 ± 4.01 | Beaded | P. cyrtonema Hua. |
| S16 | Zhenyuan, Guizhou | 30.52 ± 6.66 | 12.13 ± 2.94 | 13.51 ± 1.93 | Beaded | P. cyrtonema Hua. |
| S17 | Dejiang, Guizhou | 7.32 ± 5.18 | 5.64 ± 1.17 | 9.16 ± 2.44 | Beaded | P. cyrtonema Hua. |
| S18 | Guiyang, Guizhou | 16.06 ± 7.05 | 11.52 ± 1.36 | 13.10 ± 5.49 | Beaded | P. cyrtonema Hua. |
| S19 | Lushi, Henan | 28.36 ± 17.86 | 9.96 ± 1.20 | 12.19 ± 2.45 | Cylinder | Polygonatum sibiricum Red. |
| S20 | Nanzhao, Henan | 9.76 ± 0.24 | 8.58 ± 2.97 | 19.19 ± 1.47 | Cylinder | P. sibiricum Red. |
| S21 | Sihecun, Henan | 58.36 ± 15.34 | 8.82 ± 0.79 | 19.43 ± 4.74 | Cylinder | P. sibiricum Red. |
| S22 | Checunzhen, Henan | 42.73 ± 15.95 | 9.93 ± 2.25 | 15.55 ± 3.23 | Cylinder | P. sibiricum Red. |
| S23 | Songxian, Henan | 60.10 ± 20.21 | 23.74 ± 5.24 | 26.12 ± 8.05 | Cylinder | P. sibiricum Red. |
| S24 | Lushan, Henan | 27.59 ± 10.32 | 15.49 ± 6.98 | 16.01 ± 6.33 | Cylinder | P. sibiricum Red. |
| S25 | Sucun, Henan | 114.73 ± 29.23 | 16.21 ± 5.42 | 22.50 ± 3.67 | Cylinder | P. sibiricum Red. |
| S26 | Xianning, Hubei | 9.85 ± 5.10 | 8.09 ± 1.33 | 9.76 ± 5.15 | Beaded | P. cyrtonema Hua. |
| S27 | Yingshan, Hubei | 16.22 ± 3.69 | 7.69 ± 1.75 | 7.51 ± 1.56 | Beaded | P. cyrtonema Hua. |
| S28 | Loudi, Hunan | 9.45 ± 7.14 | 7.87 ± 1.13 | 14.97 ± 3.62 | Beaded | P. cyrtonema Hua. |
| S29 | Xiushui, Jiangxi | 18.82 ± 5.33 | 14.11 ± 0.40 | 16.31 ± 1.54 | Beaded | P. cyrtonema Hua. |
| S30 | Nanchang, Jiangxi | 31.75 ± 9.61 | 28.08 ± 8.10 | 29.62 ± 5.31 | Beaded | P. cyrtonema Hua. |
| S31 | Xinfeng, Jiangxi | 28.43 ± 7.92 | 25.95 ± 5.11 | 26.86 ± 7.14 | Beaded | P. cyrtonema Hua. |
| S32 | Lveyang, Shaanxi | 59.48 ± 24.64 | 8.59 ± 2.66 | 9.72 ± 5.62 | Cylinder | P. sibiricum Red. |
| S33 | Ankang, Shaanxi | 21.67 ± 9.47 | 6.96 ± 1.01 | 9.62 ± 3.24 | Cylinder | P. sibiricum Red. |
| S34 | Yilong, Sichuan | 7.31 ± 3.72 | 6.70 ± 2.53 | 15.22 ± 5.06 | Beaded | P. cyrtonema Hua. |
| S35 | Ya’an, Sichuan | 6.29 ± 1.10 | 4.02 ± 0.46 | 5.81 ± 0.02 | Beaded | P. cyrtonema Hua. |
| S36 | Baoshan, Yunan | 21.56 ± 5.07 | 19.53 ± 2.62 | 15.63 ± 1.36 | Approximately beaded | P. kingianum Collett & Hemsley |
| S37 | Honghe, Yunan | 25.37 ± 6.56 | 12.47 ± 5.79 | 21.97 ± 3.08 | Approximately beaded | P. kingianum Collett & Hemsley |
| S38 | Dali, Yunan | 6.18 ± 2.27 | 6.99 ± 1.91 | 9.81 ± 1.41 | Beaded | P. cyrtonema Hua. |
| S39 | Mengzi, Yunan | 22.71 ± 3.36 | 22.14 ± 1.87 | 31.64 ± 2.86 | Approximately beaded | P. kingianum Collett & Hemsley |
| S40 | Mengzi, Yunan | 21.36 ± 3.33 | 15.88 ± 2.73 | 15.21 ± 2.95 | Beaded | P. cyrtonema Hua. |
| S41 | Yimen, Yunan | 15.28 ± 5.27 | 4.89 ± 0.17 | 6.52 ± 0.89 | Approximately beaded | P. kingianum Collett & Hemsley |
| S42 | Huangyan, Zhejiang | 23.67 ± 7.60 | 14.51 ± 8.06 | 21.58 ± 11.60 | Beaded | P. cyrtonema Hua. |
| S43 | Xianju, Zhejiang | 9.81 ± 4.41 | 8.69 ± 2.34 | 13.59 ± 7.35 | Beaded | P. cyrtonema Hua. |
| S44 | Kaihua, Zhejiang | 7.82 ± 2.46 | 11.36 ± 6.55 | 12.05 ± 5.18 | Beaded | P. cyrtonema Hua. |
| S45 | Tongxiang, Zhejiang | 12.27 ± 6.55 | 4.93 ± 1.06 | 8.66 ± 1.49 | Beaded | P. cyrtonema Hua. |
| S46 | Lishui, Zhejiang | 10.81 ± 5.06 | 11.85 ± 5.26 | 11.82 ± 2.43 | Beaded | P. cyrtonema Hua. |
| S47 | Tiantai, Zhejiang | 11.74 ± 6.24 | 8.43 ± 0.85 | 11.11 ± 0.05 | Beaded | P. cyrtonema Hua. |
Almost 80 rhizomes from each region with similar characters were selected and cultivated in a PR GAP planting base (Buchang Pharma, Hanzhong, China). The experimental plots were located in Zhongchuanba Village, Wulongdong Town, Lveyang County (106°12′30″E, 33°30′9″N; 897 m above sea level). The area of each plot was 1.2 m × 5.0 m, and the spacing between each plot was 1.2 m. The rhizomes were planted in rows; the distance between the rows and that between rhizomes was 25 cm.
2.2 DNA extraction
Genomic DNA was isolated according to the CTAB method [38]. The quality of the extracted DNA was verified by a NanoDrop 2000 (Thermo Fisher Scientific, Waltham, MA, USA), diluted to 20 ng·μL−1 and stored at −20°C for molecular marker analysis.
2.3 ISSR primers screening and amplification
A total of 100 ISSR primers, designed at the University of British Columbia, were synthesized by Shanghai Sangon Biological Engineering Technology & Services (Shanghai, China). All primers were screened for their amplification efficiency and 15 primers (Table 2) with high amplification efficiency and reproducibility were selected.
ISSR primers and SCoT primers used in the experiments.
| System | Number | Sequence (5’-3’) | Ta(°C) | Number | Sequence (5’-3’) | Ta(°C) |
| ISSR | UBC807 | AGAGAGAGAGAGAGAGT | 51.2 | UBC842 | GAGAGAGAGAGAGAGAYG | 56.2 |
| UBC808 | AGAGAGAGAGAGAGAGC | 49.6 | UBC855 | ACACACACACACACACYT | 48.9 | |
| UBC810 | GAGAGAGAGAGAGAGAT | 48.0 | UBC866 | CTCCTCCTCCTCCTCCTC | 58.1 | |
| UBC811 | GAGAGAGAGAGAGAGAC | 49.6 | UBC868 | GAAGAAGAAGAAGAAGAA | 44.8 | |
| UBC834 | AGAGAGAGAGAGAGAGYT | 50.6 | UBC873 | GACAGACAGACAGACA | 47.8 | |
| UBC835 | AGAGAGAGAGAGAGAGYC | 52.3 | UBC880 | GGAGAGGAGAGGAGA | 51.4 | |
| UBC836 | AGAGAGAGAGAGAGAGYA | 53.9 | UBC881 | GGGTGGGGTGGGGTG | 55.8 | |
| UBC841 | GAGAGAGAGAGAGAGAYC | 51.2 | ||||
| SCoT 15 | AAAATGGCTACCACTGCG | 50 | SCoT 39 | ACCATGGCTACCACCGAC | 50 | |
| SCoT 21 | CCATGGCTACCACCGCCT | 50 | SCoT 48 | ACCATGGCTACCACCGTG | 50 | |
| SCoT | SCoT 24 | CATGGCTACCACCGGCCC | 50 | SCoT 63 | ACAATGGCTACCACTGCA | 50 |
| SCoT 32 | CCATGGCTACCACTACCC | 50 | SCoT 72 | ACCATGGCTACCACGGGC | 50 | |
| SCoT 38 | ACGACATGGCGACCAACG | 50 | SCoT 73 | ACCATGGCTACCACGGTC | 50 |
PCR amplification was performed in a 96-well Veriti Thermal Cycler (Applied Biosystems, Foster City, CA, USA) in 20-μL reaction volumes comprised of 10 μL of 2 × Es Taq MasterMix (CWBIO, Shanghai, China), 1.2 μL of 1 μM primer, 1 μL of 20 ng·μL−1 template DNA, and 7.8 μL of ddH2O (CWBIO, Shanghai, China). The PCR amplification procedure was set as follows: initial denaturation at 94°C for 5 min, followed by 35 cycles of denaturation at 94°C for 45 s, annealing at Ta (screened in advance using gradient temperature PCR, Table 2) for 40 s, and an extension at 72°C for 90 s, and a final extension at 72°C for 7 min. All amplification products were separated by electrophoresis on a 1.5% agarose gel in 1 × TBE buffer, stained with ethidium bromide, and visualized under a Molecular Imager Gel Doc system enclosed in Universal Hood II (Bio-Rad Laboratories, Inc., Hercules, CA, USA).
2.4 SCoT primers screening and amplification
In total, 85 SCoT primers were tested for their amplification efficiency and stability. Finally, 10 primers (Table 2) with high amplification efficiency and reproducibility were selected.
Reactions were prepared following the same protocol as that used for ISSR markers (Section 2.1). The SCoT PCR consisted of an initial denaturation at 94°C for 5 min, 35 cycles of denaturation at 94°C for 50 s, annealing at 50°C for 1 min, and extension at 72°C for 90 s, and a final extension at 72°C for 7 min. All the amplified products were separated and visualized as described in Section 2.1.
2.5 Morphological indexes observation
The specific phenotypic traits listed in Table 3 were directly investigated using the method we named VG (visual assessment by a single observation of a group of plants or parts of plants). If more than 95% of plants in each plot showed a specific phenotypic state, we confirmed the trait's state and recorded the data according to the stipulations in Table 3. Common quantitative traits such as plant height (cm), stem diameter (mm), leaf length (cm), and leaf width (mm), which are remarkable and convenient for statistics and analyses, were chosen for direct observations conducted nearly every 20 days after seedling emergence and until the end of the growth period when the aerial parts in each plot withered. Five plants with similar growth were randomly selected through a five-point sampling method and labeled for the observation of morphological indexes. Where appropriate, the plant height was measured with a 5-m-long measuring tape, and Vernier calipers were used for surveying the stem diameter, the leaf length, and the leaf width. For uniformly determining leaf length and leaf width, we measured two leaves located in the middle of the stem of the sampled plants.
Specific traits used in the identification by the morphological and statistical methods employed.
| Traits | Assignment or statistical method | Traits | Assignment or statistical method |
| Plant height | Direct observation | Leaf tip | Circinate: 0; sharp: 1 |
| Stem diameter | Direct observation | Leaf shape | Lanceolate: 0; ovalellipsoidal: 1 |
| Stem color | Purple: 0; green: 1 | Leaf arrangement | Vermiculate: 0; alternate: 1 |
| Leaf length | Direct observation | Petiole color | Red: 0; green: 1 |
| Leaf width | Direct observation |
2.6 Data analysis
2.6.1 Statistics and analysis of ISSR and SCoT data
Each band on the electrophoretogram is a DNA fragment, a molecular marker that represents the binding site of the primer. The band patterns obtained by the ISSR and SCoT PCR using selected primers were collected and characterized according to the mobility and the existential state of the molecular markers, with “1” indicating the existence of a band and “0” indicating the absence of any band. Only reproducible bands were scored, and all strong and weak bands were assigned “1”. Genetic similarities between pairs of accessions were measured by the Dice similarity coefficient [39] using the QUALITATIVE DATA module of NTSYSpc ver. 2.10e [40]. The accessions were clustered based on a genetic similarities matrix using the SHAN module, and the tree was rooted by an unweighted pair-group method with arithmetic means (UPGMA). The clustering result was used to construct a dendrogram following the TREE module, and genetic distances were calculated using Nei and Li's method [41] implemented in NTSYSpc ver. 2.10e. Multidimensional scaling (MDS) [42] using Ward's method and the Euclidean distance was performed using SPSS 20.0 (IBM Corp., Armonk, NY, USA) to validate the clustering based on genetic distance.
2.6.2 Statistics and analysis of morphological data
Data on quantitative traits were analyzed, the results were expressed as the average ± standard deviation, and specific phenotypic traits were recorded (Table 3). All morphological data were processed using a hierarchical cluster analysis (HCA) model [43] for multivariate analysis in SPSS 20.0 (IBM Corp., USA). Quantitative traits data with different magnitudes were first standardized using the Z-score standardization method and then subjected to HCA using Ward's method, which is the most commonly used clustering methodology with significant capacity to produce clusters of roughly the same size. The squared Euclidean distance, the recommended measure of similarity for Ward's method, was used to determine the degree of similarity between the samples [44].
3 Results and discussion
3.1 ISSR data cluster analysis
The cluster analysis of the ISSR data classified the plants with close genetic similarities into two main clusters (Fig. 1a) with the similarity coefficient of 74% (I and II). Clade I, which included the samples from the regions of Henan and Shaanxi Provinces, with a similarity coefficient of 80.4% among them, was comprised of three subclades: Ia–Ic (S33). A relatively high similarity coefficient of 94.7% was calculated between S21 and S22. The remaining samples, all of which originated from other regions, were classified into clade II. At a similarity coefficient of 79.8% among them, this clade comprised seven subclades, IIa–IIg. In clade II, the highest similarity coefficient of 95%, was calculated between S36 and S37. According to the preliminary species identification (Table 1), the samples of Polygonatum sibiricum were classified into a group with a similarity coefficient of 80.4%, and samples belonging to P. kingianum and P. cyrtonema were grouped together with a similarity coefficient of 74.6%. Samples from the same province were clustered into subgroups with similarity coefficients ranging from 74.5% to 91%. Cluster analysis (Fig. 1a) indicated that the samples collected from Anhui, Chongqing, Guangdong, Guangxi, Guizhou, Henan, Hubei, Jiangxi, Shaanxi, Sichuan, Yunnan, and Zhejiang were classified into a subgroup with similarity coefficients of 84%, 84%, 91%, 74.5%, 74.5%, 80.2%, 78.8%, 80%, 80.3%, 85.6%, 78.6%, and 77.2% among them, respectively.
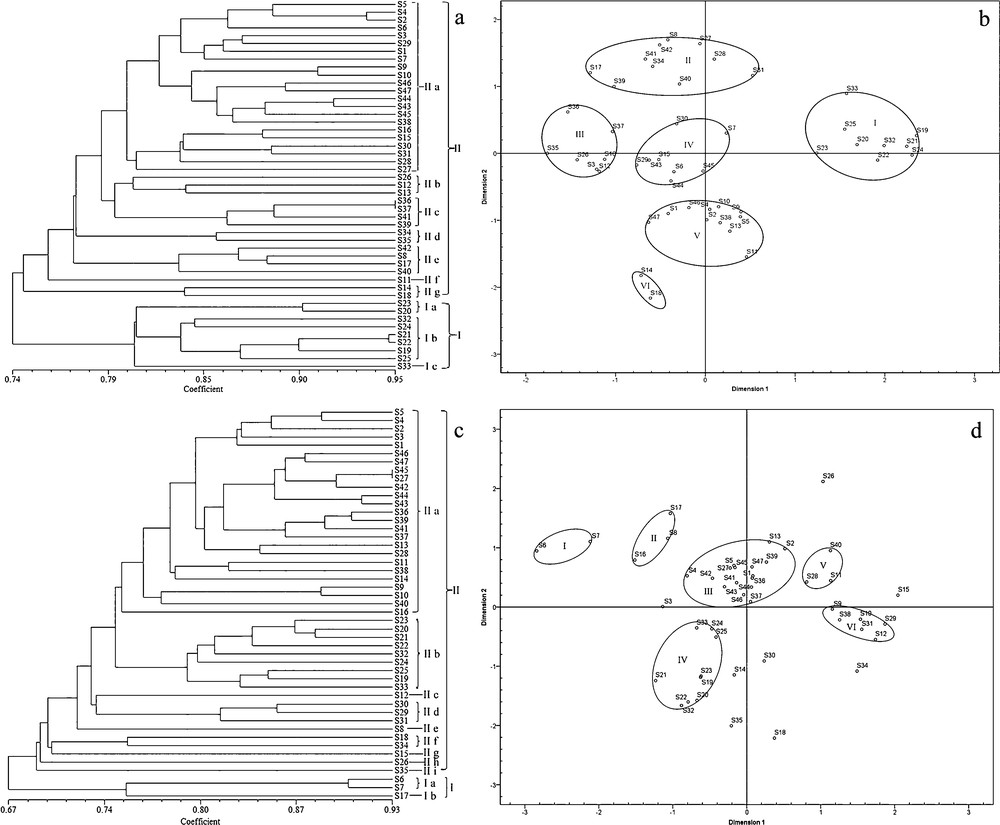
Dendrogram constructed via cluster analysis of ISSR markers (a) and SCoT markers (c) data on samples listed in Table 1 and results of MDS analysis: ISSR data (b) and SCoT data (d).
The MDS analysis based on genetic distances has been used for plant classification, and to some extent, to validate the results of molecular analyses [42]. The samples from all regions were differentiated into six groups according to their genetic distances (I–VI) (Fig. 1b). The samples with close genetic distances were grouped together, in a fashion slightly different than their geographical distribution. This fact may be because a different distribution makes the genetic information of samples of the same species vary. The samples belonging to Polygonatum sibiricum (I) were spatially isolated in the two-dimensional MDS plots from the other samples. The samples of P. kingianum and P. cyrtonema were divided into five small groups (II–VI). Group VI (S14 and S18) showed a spatial distribution with in −0.716 to −0.612 in dimension 1 and −2.162 to −1.825 in dimension 2. The samples in group V were spatially isolated in–0.632 to 0.459 in dimension 1 and −1.547 to–0.797 in dimension 2. Samples of Group IV indicated a spatial distribution within–0.624 to 0.235 in dimension 1 and −0.274 to 0.442 in dimension 2. Samples in group III were spatially isolated within −1.760 to −1.034 in dimension 1 and −0.268 to 0.618 in dimension 2. The remanent samples (II) revealed a spatial distribution within −1.282 to 0.528 in dimension 1 and 1.000 to 1.697 in dimension 2. These results confirmed that ISSR markers could distinguish PR from other species of Polygonatum, thus corroborating previous reports [28,29].
3.2 SCoT data cluster analysis
The similarity coefficient between the samples based on the SCoT data ranged between 67% and 93%. The cluster analysis also classified the samples into two main branches with a similarity coefficient of 67% (I and II; Fig. 1c). Cluster I comprised S6, S7, and S17 with the similarity coefficient of 75.1%; this branch was further divided into two subclades, Ia (S6 and S7) and Ib (S17). The similarity coefficient between S6 and S7 was relatively high, at 89.8%. The samples from other regions were classified into cluster II with a similarity coefficient of 74.5%. Cluster II was divided into nine subclades: IIa–IIi. In cluster II, the highest similarity coefficient of 93% was observed between S27 and S45. According to the preliminary species identification (Table 1), the samples of P. sibiricum were clustered into a group with a similarity coefficient of 78.8%, whereas the samples belonging to P. kingianum were grouped together with a similarity coefficient of 77.8%, and the samples from P. cyrtonema were classified into a group with a similarity coefficient of 67%. The samples from the same province were classified into a subgroup with a similarity coefficient of 67%–90.4%. Cluster analysis (Fig. 1c) indicated that the samples from Anhui, Chongqing, Guangdong, Guangxi, Guizhou, Henan, Hubei, Jiangxi, Shaanxi, Sichuan, Yunnan, and Zhejiang were grouped as sharing a similarity coefficient of 82.8%, 90.4%, 88.6%, 73%, 67%, 79.2%, 71%, 80%, 81.4%, 68.8%, 76.4%, and 79.6%, respectively.
MDS analysis based on the SCoT resolved the samples into six groups (Fig. 1d). Thus, the spatial representation of the data using MDS corroborated the results based on genetic distance among the plants inferred from the SCoT markers.
3.3 Comparison of ISSR and SCoT markers
The two DNA-based markers showed similar genetic capacity for the identification of the PR species. The cluster analyses based on the two types of markers resolved the samples from P. sibiricum into groups with comparable coefficients of similarity (80.4% ISSR and 78.8% SCoT). Similarly, the samples of P. kingianum were resolved in a single clade with a similarity coefficient of 74.6% (ISSR) and 77.8% (SCoT), and P. cyrtonema samples were grouped in a clade with similarity coefficients of 74.6% (ISSR) and 67% (SCoT). Therefore, both the ISSR and SCoT markers are suitable for the identification of PR species. However, the results were not completely unanimous. The ISSR and SCoT-based topologies were incongruent in that the samples of P. sibiricum were resolved within cluster I on the ISSR-based dendrogram or within subclade IIb on the SCoT-based dendrogram. In addition, the similarity coefficients among the samples were slightly different between the two types of markers. These differences may due to the fact the two schemes and binding sites of DNA were different [45].
3.4 Morphological observations and HCA
All the samples were classified into two main populations based on leaf arrangement — those with alternate and those with verticillate leaves (Supplementary Table). The samples collected from 13 regions (S19–S25, S32, S33, S36, S37, S39, and S41) were with verticillate or mostly verticillate leaves. Four of them (S36, S37, S39, and S41) with red leaf sheaths were identified as P. kingianum (Supplementary Fig. S1a). Meanwhile, S24, which was characterized by a curved leaf apex, was identified as P. cirrhifolium (Supplementary Fig. S1b). The remaining samples (S19–S23, S25, S32 and S33) were identified as P. sibiricum (Supplementary Fig. S1c). The leaves of the remaining samples (S1–S18, S26–S31, S34, S35, S38, S40, S42–S47) were alternate or mostly alternate. The leaf apexes in plants from six regions (S6, S7, S15, S17, S34 and S35) were, similarly to P. sibiricum, strongly cirrhous or curved. Those samples were identified as P. alternicirrhosum Hand-Mazz. (Supplementary Fig. S1d). Finally, samples from the remaining regions (S1–S5, S8–S14, S16, S18, S26–S31, S38, S40, and S42–S47) were identified as P. cyrtonema (Supplementary Fig. S1e).
HCA based on morphological indexes further verified the results of morphological observations and divided all sampled plants into 14 groups (Fig. 2). The samples from all the regions were classified into two clusters with a squared Euclidean distance of 25; clade II comprised 19 samples and clade I included the rest of the samples (I). Clade I included samples with alternate leaves, whereas clade II comprised mainly plants with verticillate leaf arrangement. The exceptions were S6, S7, S15, S17, S34, and S35, which have alternate leaves, but because of their cirrhous or curved leaf apexes were classified into the cluster with verticillate leaves by HCA. Cluster I was further subdivided into two subclusters, of which one included samples from a single region (S43, Id), while the samples from the remaining 27 regions were further clustered into two small groups of nine and 19 regions. Moreover, the 1st group (Ic), with nine regions, was further subdivided into two subgroups containing one (S13) sample and eight other subgroups at a squared Euclidean distance of 2. The second group was also subdivided into two subgroups, the first one with eight regions (Ib), and the other one with the remaining regions (Ia) with a squared Euclidean distance of 3. The smaller cluster (II) contained two small subclusters of four regions (IIa), and the other group of 15 regions sharing a node with them at a squared Euclidean distance of 9. The first subcluster with four regions was subdivided into three groups sharing a Euclidean square distance of 2. The second subcluster was subdivided into two small groups, one containing five regions and another 10 regions (IIc), with a squared Euclidean distance of 6. The first group (IIb) was subdivided into two subgroups, and the second group was subdivided into three subgroups, sharing a node with a squared Euclidean distance of 2. Therefore, the analysis of the samples using selected morphological data successfully identified the species of PR.
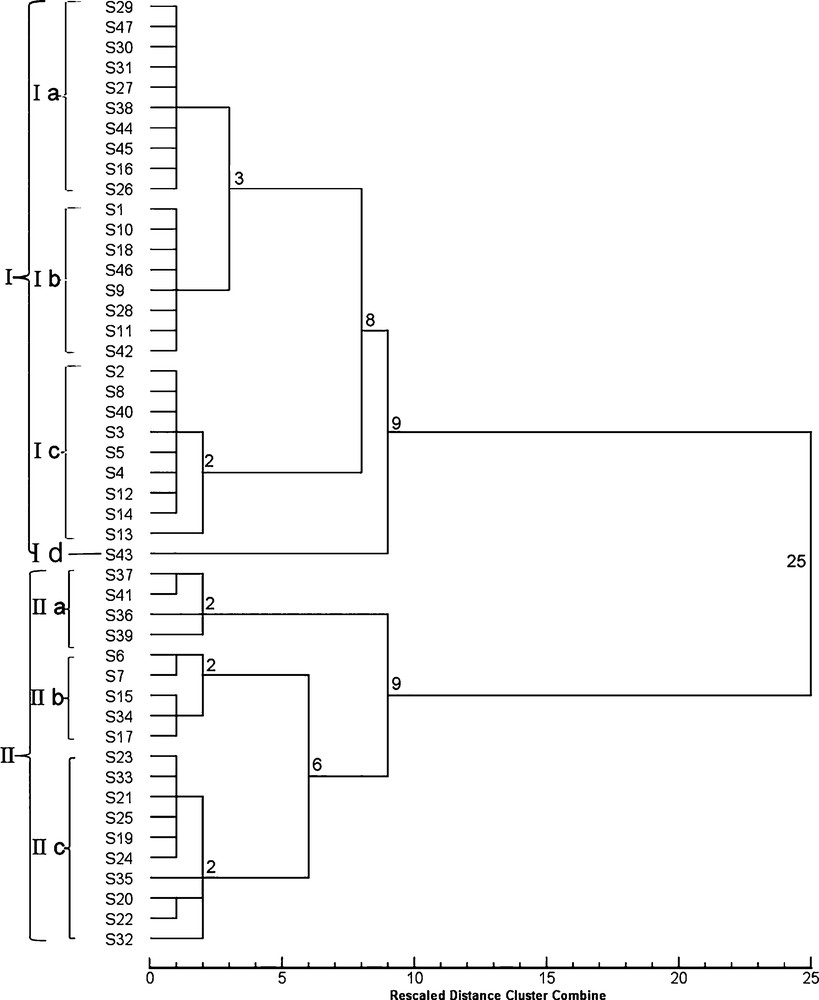
Dendrogram obtained by cluster analysis of morphological data on the samples listed in Table 1.
3.5 Comparison of morphological and molecular markers
Compared with morphological identification, the ISSR marker data assigned the samples (S19, S20, S21, S22, S23, S25, S32 and S33) of cluster I (Fig. 1a) collected from Henan and Shaanxi Province to P. sibiricum, except for the sample S24, which was identified as P. cirrhifolium. In cluster II, S36 and S37 were clustered with S39 and S41, which were all identified as P. kingianum. The samples S6, S7, S15, S17, S34, and S35, identified as P. alternicirrhosum, did not form a single clade, although S34and S35 were grouped together. The analysis of the SCoT markers produced similar results. Clade I included three samples, S6, S7, and S17, which were identified as P. alternicirrhosum, whereas Clade II included S19, S20, S21, S22, S23, S25, S32, and S33, which were all identified as P. sibiricum. The samples S36, S37, S39 and S41, which were identified as P. kingianum, formed a clade.
Consequently, the HCA of morphological data and the cluster analysis of ISSR and SCoT markers using the UPGMA are suitable for the identification of the germplasm resources of PR. The samples of P. kingianum were grouped with those of P. sibiricum, P. alternicirrhosum, and P. cirrhifolium (S24) based on morphological characters. However, the molecular marker-based identification grouped P. kingianum with P. cyrtonema. These results showed that the genetic distance between P. kingianum and P. cyrtonema was smaller than that between P. kingianum and P. sibiricum. This is possibly caused by the geographical distribution of these species. According to the Flora of China [46], P. cyrtonema is mainly located in southern China, P. kingianum is mainly distributed in Sichuan, Guizhou, and Yunnan province in western China, and P. sibiricum is mainly found in northern China. Hence, although many morphological differences exist between P. kingianum and P. cyrtonema, their genotypes showed greater similarity and smaller genetic distance.
The species identification of PR that relies on rhizome traits is uncertain and prone to errors. Furthermore, accurate identification of PR based on morphological characters can be completed only after cultivating the rhizomes for 3–6 months. In contrast, identification using molecular markers is faster. Both ISSR and SCoT markers recovered similar values for genetic distance among the species. Specific qualitative and quantitative characters that were selected for morphological identification in combination with molecular marker identification were efficient in determining the PR species from other species of Polygonatum.
4 Conclusions
Morphological and molecular markers were used in the present study for the species identification of PR samples collected in China. The morphological identification method is simple and most popular among the classical methods of species identification. Using this intuitive method, the samples of PR were identified based on both qualitative and quantitative traits. According to the morphological identification, the samples were classified into two main populations or five species, i.e. (1) P. kingianum, (2) P. cirrhifolium, (3) P. sibiricum with verticillate leaf arrangement, (4) P. alternicirrhosum, and (5) P. cyrtonema, with alternate leaf arrangement. All samples were further divided into 14 subgroups according to the quantitative traits. However, the selected quantitative traits could not be all scored at the time of sampling, leading to incomplete identification. For example, we were not able to collect flowers and fruits of some samples during the sampling period and had to wait 3–6 months until the collected rhizomes developed in cultivation [47]. To overcome this drawback of the morphological method, we adopted molecular marker methods, ISSR and SCoT, for identification of germplasms. The identification based on morphological characters was slightly different from that based on molecular markers. For example, molecular markers grouped P. kingianum with P. cyrtonema rather than with P. sibiricum, as identified by morphological characters. The MDS analysis confirmed the reliability of the molecular markers and revealed shorter genetic distance between P. kingianum and P. cyrtonema, possibly due to their closer geographical distribution. Hence, to reduce the time spent on species identification, both morphological and molecular methods should be combined for the differentiation of germplasms such as those in PR. The experimental data and protocols implemented in this study thus benefit customers who need to verify the species composition of PR.
Disclosure of interest
The authors declare that they have no competing interest.
Acknowledgment
Financial supports from the Huimin Plan of Ministry of Science and Technology (2012GS610102) and the Support Plan Project of the State Ministry of Science &Technology (2015BAC01B03) are acknowledged.