

1 Introduction
Application of fertilizers is an essential practice in agricultural production that determines the quality of soil and its sustainable use [1]. Organic and inorganic fertilizers enhance the soil nutrient availability to plants, besides improving the soil physical, chemical, and biological properties [2–5]. Extensive use of chemical fertilizers in relation to organic fertilizers has led to a decrease in soil organic carbon and soil quality [6–9]. Soil microorganisms are important elements of soil ecosystems; they perform vital functions in the restoration and sustainability of ecosystems [10,11]. They are fundamental to the upkeep of soil function as they are known to help in the formation of soil structure, organic matter decomposition, removal of toxins and biogeochemical cycling of nitrogen, phosphorus, carbon, and sulphur [12–15]. Their diversity is influenced by different fertilizers [16,17]. Long-term application of inorganic fertilizers affects soil quality and productivity, composition of microbial community, and functional diversity [18–21]. Changes in soil microbial structure and activity will affect soil processes such as nitrogen fixation, nitrification and denitrification [22–24]. Soil microbial community structure and function are commonly used as indicators for soil quality and fertility [25]. Inclusion of organic fertilizers reduces the harmful effects of chemical fertilizers and enhances the soil microbial metabolic activities [26]. The functional diversity of soil microorganisms provides vital information about the soil biological quality and is ecologically more relevant [27]. Assessment of metabolic reactions performed by the microorganisms is essential for knowing and managing the ecosystems. It is very essential for optimizing the use of fertilizers and sustaining soil productivity [28,29]. However, the effects of different organic and inorganic fertilizers on soil microbial community structure and functional diversity are not well studied in vegetable production systems. The Biolog® assay is routinely used to monitor the soils, as it is simple and fast [27]. It does not depend on the laborious isolation process; instead it assesses the functional diversity of intact communities [30]. Our objective was to assess the influence of organic sources of nutrients in comparison with that of chemical fertilizers on soil microbial functional diversity in vegetable production.
2 Materials and methods
2.1 Study site
The experimental site was located at the research farm of the ICAR-Indian Institute of Vegetable Research, Varanasi, India (82.52 °E longitude; 25.10 °N latitude). Average rainfall of the area is about 1000 mm, which is spread over 100 days. The temperature ranges from 5 °C to 42 °C. The coldest month is January, while the maximum temperature is observed during May and June.
2.2 Soil characteristics
The soil was silt loam in texture with organic carbon content of 0.44–0.50%. The pH (7.81–7.83) of the soil was slightly alkaline with electrical conductivity 0.410–0.413 dS·m−1.
2.3 Experimental details; Soil sampling and processing
Okra crop (Abelmoschus esculentus) was taken during summer season after the harvest of cabbage (Brassica oleracea), which was grown during the winter season. Land was ploughed, seeds were sown at a spacing of 45 cm × 30 cm and irrigation was given at 7–10-day intervals. Soil samples were collected randomly; aseptically from the treatments from the top 150 mm, at three positions in each plot/replication (size: 10 m × 7 m) at the final harvest stage of Okra using tube auger and samples from each plot were pooled and mixed. After sieving (< 2 mm), 300 g of each sample were stored at 5 °C and subsequently used for microbiological analysis [31]. The present study comprised of eleven treatments, viz., T1–FYM (20 t·ha−1); T2–poultry manure (5 t·ha−1); T3–vermicompost (7 t·ha−1); T4–FYM (10 t·ha−1) + poultry manure (2.5 t·ha−1); T5–FYM (10 t·ha−1) + vermicompost (3.5 t·ha−1); T6–poultry manure (2.5 t·ha−1) + vermicompost (3.5 t·ha−1); T7–FYM (10 t·ha−1) + poultry manure (2.5 t·ha−1) + biofertilizers (Azotobacter 500 g·ha−1 applied as seed treatment); T8–FYM (10 t·ha−1) + vermicompost (3.5 t·ha−1) + biofertilizers (Azotobacter 500 g·ha−1 applied as seed treatment); T9–poultry manure (2.5 t·ha−1) + vermicompost (3.5 t·ha−1) + biofertilizers (Azotobacter 500 g·ha−1 applied as seed treatment); T10–inorganic control (120:60:60 kg NPK ha−1); T11–absolute control (no fertilizers). For the inorganic control, NPK was applied through urea, single super phosphate and muriate of potash, respectively. Half of the N and full dose of P and K were applied as basal, while the remaining amount of N was applied as top dressing after 30 days of planting.
2.4 Functional diversity analysis of soil microbial community
Microbial community analysis was done by using 96 well Biolog® Eco-plates (Biolog® Inc., CA, USA) containing 31 different carbon sources and control well in triplicates (Table 1). The metabolic functional variation of the soil microbial community was assessed by measuring OD values in a colour change reaction involving 31 different carbon sources [32]. The experiment was set up as per the procedure described by Li et al. [32] and Kumar et al. [33]. In brief, 10 g of fresh soil were mixed well in 100 ml of distilled water in a 250-ml Erlenmeyer flask kept on a shaker for 30 min at 250 rpm. The final suspension was diluted to 10−3 and 100 μl of the water extracts were inoculated into each well of the Biolog® Eco-microtiter plate. The plates were incubated at 25 °C. All used materials were sterilized using an autoclave at 121 °C for 1 h. The absorbance of colour of each well resulting from the utilization of carbon sources by the microorganisms was measured at 590 nm with the aid of a microplate reader. The first measurement was taken immediately after inoculation. Then, the microplates were incubated at constant temperature (25 °C) for five days and readings were taken at optical density (OD) 590 nm using Microlog 4.01 after incubation of 0, 24, 48, 72, 96 and 120 h. The average well colour development (AWCD) for 31 different carbon sources was calculated to assess the total microbial activity [32]. The AWCD reflects the overall situation of microorganisms utilizing different carbon sources and it was calculated by using the formula [34]:
Carbon Sources used in the study.
| A1 Water |
A2 β-Methyl-d-glucoside |
A3 d-Galactonic acid γ-Lactone |
A4 l-Arginine |
A1 Water |
A2 β-Methyl-d-glucoside |
A3 d-Galactonic acid γ-Lactone |
A4 l-Arginine |
A1 Water |
A2 β-Methyl-d-glucoside |
A3 d-Galactonic acid γ-Lactone |
A4 l-Arginine |
| B1 Pyruvic acid Methyl ester |
B2 d-Xylose |
B3 d-Galacturonic acid |
B4 l-Asparagine |
B1 Pyruvic acid methyl ester |
B2 d-Xylose |
B3 d-Galacturonic acid |
B4 l-Asparagine |
B1 Pyruvic acid methyl ester |
B2 d-Xylose |
B3 d-Galacturonic acid |
B4 l-Asparagine |
| C1 Tween 40 |
C2 i-Erythritol |
C3 2-Hydroxy benzoic acid |
C4 l-Phenylalanine |
C1 Tween 40 |
C2 i-Erythritol |
C3 2-Hydroxy benzoic acid |
C4 l-Phenylalanine |
C1 Tween 40 |
C2 i-Erythritol |
C3 2-Hydroxy benzoic acid |
C4 l-Phenylalanine |
| D1 Tween 80 |
D2 d-Mannitol |
D3 4-Hydroxy benzoic acid |
D4 l-Serine |
D1 Tween 80 |
D2 d-Mannitol |
D3 4-Hydroxy benzoic acid |
D4 l-Serine |
D1 Tween 80 |
D2 d-Mannitol |
D3 4-Hydroxy benzoic acid |
D4 l-Serine |
| E1 α- Cyclodextrin | E2 N-Acetyl-d-glucosamine | E3 γ- Hydroxybutyric acid | E4 l-Threonine |
E1 α-Cyclodextrin |
E2 N-Acetyl-d-glucosamine |
E3 γ-Hydroxybutyric acid |
E4 l-Threonine |
E1 α-Cyclodextrin | E2 N-Acetyl-d-glucosamine |
E3 γ-Hydroxybutyric acid |
E4 l-Threonine |
| F1 Glycogen |
F2 d-Glucosaminic acid |
F3 Itaconic acid |
F4 Glycyl-l-glutamic acid |
F1 Glycogen |
F2 d-Glucosaminic acid |
F3 Itaconic acid |
F4 Glycyl-l-glutamic acid |
F1 Glycogen |
F2 d-Glucosaminic acid | F3 Itaconic acid |
F4 Glycyl-l-glutamic acid |
| G1 d-Cellobiose G2 Glucose-1-phosphate |
G2 Glucose-1-phosphate |
G3 α-Ketobutyric acid |
G4 Phenylethylamine | G1 d-Cellobiose G2 glucose-1-phosphate |
G2 Glucose-1-phosphate |
G3 α-Ketobutyric acid |
G4 Phenylethylamine | G1 d-Cellobiose G2 Glucose-1-phosphate |
G2 Glucose-1-phosphate |
G3 α-Ketobutyric acid |
G4 Phenylethylamine |
| H1 α-d-Lactose |
H2 d,l-α-Glycerol phosphate |
H3 d-Malic acid |
H4 Putrescine |
H1 α-d-Lactose |
H2 d,l-α-Glycerol phosphate |
H3 d-Malic acid |
H4 Putrescine |
H1 α-d-Lactose |
H2 d,l-α-Glycerol phosphate |
H3 d-Malic acid |
H4 Putrescine |
R = OD value of the control well.
2.4.1 Analysis of functional diversity indices
The functional diversity indices of soil microorganisms utilizing carbon sources were expressed using the Shannon–Weaver (H) and McIntosh indices (U).
2.4.1.1 The Shannon–Weaver index (H)
It is sensitively affected by the species richness of microbial community.
The Shannon–Weaver (H) index was quantified by the formula:
where pi is the ratio of the relative OD value (C–R) of the ith hole to the sum of relative OD values of all the holes of the Biolog® Eco-plates.
2.4.1.2 McIntosh index (U)
It is one of the measurements of the species evenness of the community.
The McIntosh index (U) was calculated using the formula:
where ni refers to the relative absorbance value for each one of the C source wells by subtracting the absorbance value of the control well [33,35].
2.5 Statistical analysis
Variations in soil biological parameters among the different management practices were analysed statistically by analysis of variance (ANOVA), followed by Duncan's Multiple Range Test (DMRT). For multivariate analysis of the Biolog® data, the absorbance values were transformed into AWCD to avoid bias between samples with different inoculums density, and then analysed using the SAS software [36].
3 Results
3.1 Analysis of microbial functional diversity
3.1.1 Analysis of AWCD
After 24 h, the highest values of AWCD was recorded in FYM (10.0 t·ha−1) + vermicompost (3.5 t·ha−1) + biofertilizers (Azotobacter 500 g·ha−1) + poultry manure (5.0 t·ha−1) (0.21) followed by FYM (10 t·ha−1) + poultry manure (2.5 t·ha−1) + biofertilizers (0.19); poultry manure (2.5 t·ha−1) + vermicompost (3.5 t·ha−1) + biofertilizers (0.18) and inorganic control (120:60:60 kg NPK ha−1) (0.16), whereas the lowest value of AWCD was observed in FYM (10.0 t·ha−1) + poultry manure (2.5 t·ha−1) (0.12) (Fig. 1). AWCD values recorded after 24 h did not show any significant (p < 0.05) differences between the treatments. After 48 h, the highest value was recorded in FYM (10 t·ha−1) + vermicompost (3.5 t·ha−1) + biofertilizers (0.24), followed by FYM (10 t·ha−1) + vermicompost (3.5 t·ha−1) (0.22); poultry manure (2.5 t·ha−1) + vermicompost (3.5 t·ha−1) (0.21) and inorganic control (0.18) and the lowest value was observed in FYM (20 t·ha−1) (0.15). Statistically, no significant (p < 0.05) differences were observed between the treatments.
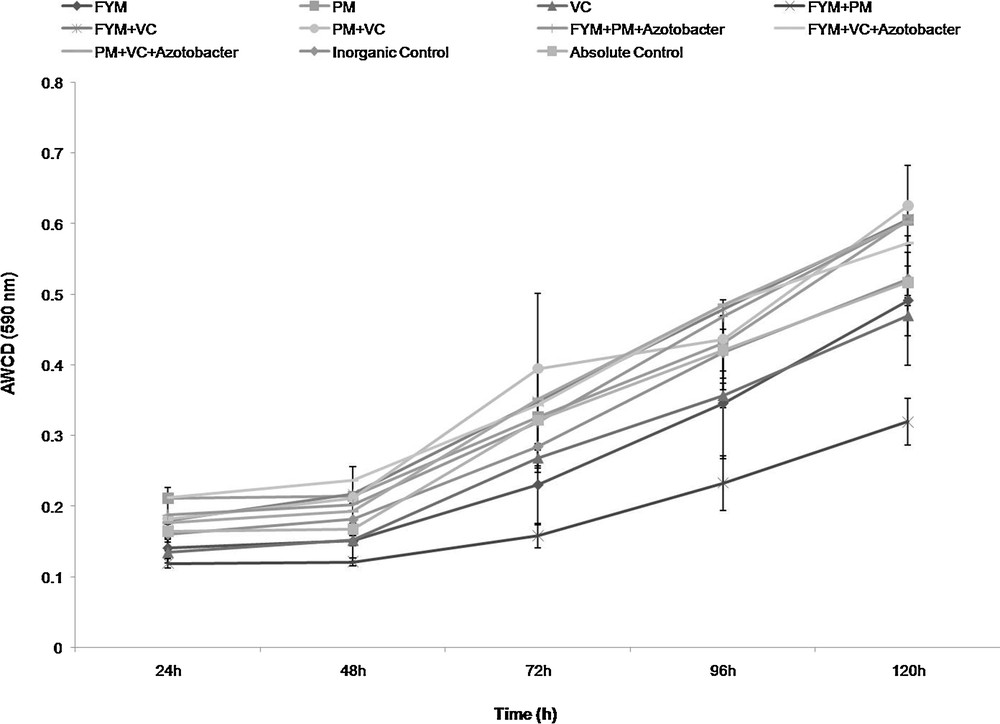
Changes in average well colour development (AWCD) over time of the soil treated with organic and inorganic fertilizers in a vegetable cropping system (FYM: farm Yard Manure, VC: Vermicompost, PM: Poultry manure).
After 72 h, poultry manure (2.5 t·ha−1) + vermicompost (3.5 t·ha−1) + biofertilizers (0.55) recorded significantly (p < 0.05) higher values of AWCD than FYM (10 t·ha−1) + poultry manure (2.5 t·ha−1) and FYM (20 t·ha−1). The FYM treatment (10 t·ha−1) + vermicompost (3.5 t·ha−1), poultry manure (2.5 t·ha−1) + vermicompost (3.5 t·ha−1), FYM (10 t·ha−1) + poultry manure (2.5 t·ha−1) + biofertilizers, FYM (10 t·ha−1) + vermicompost (3.5 t·ha−1) + biofertilizers and absolute control were recorded statistically at par values of AWCD, whereas the inorganic control recorded 0.28. The lowest value was observed in FYM (10 t·ha−1) + poultry manure (2.5 t·ha−1) (0.16) (Table 2). After 96 h, the highest value of AWCD was obtained in FYM (10.0 t·ha−1) + vermicompost (3.5 t·ha−1) + biofertilizers (0.49) followed by FYM (10.0 t·ha−1) + vermicompost (3.5 t·ha−1) (0.48); FYM (10.0 t·ha−1) + poultry manure (2.5 t·ha−1) + biofertilizers (0.47) and inorganic control (0.42), and the lowest value was obtained in FYM (10.0 t·ha−1) + poultry manure (2.5 t·ha−1) (0.23). After 120 h, the highest value of AWCD was observed in poultry manure (2.5 t·ha−1) + vermicompost (3.5 t·ha−1) (0.63) followed by FYM (10.0 t·ha−1) + vermicompost (3.5 t·ha−1) (0.61) and poultry manure (5.0 t·ha−1) (0.61); FYM (10.0 t·ha−1) + poultry manure (2.5 t·ha−1) + biofertilizers and poultry manure (2.5 t·ha−1) + vermicompost (3.5 t·ha−1) + biofertilizers (0.60), and the lowest value was recorded in FYM (20 t·ha−1) (0.49) and inorganic treatment (0.52) (Fig. 1).
The average well colour development (AWCD) and diversity indices of microbial communities based on 72-h data from Biolog analysis of soil under different treatments.
| Treatments | AWCD | McIntosh index | Shannon index |
| FYM | 0.23 (0.10)a | 1.71 (0.51)a | 3.45 (0.29)a |
| PM | 0.33 (0.12)ab | 2.41 (0.54)a | 3.33 (0.33)a |
| VC | 0.27 (0.02)ab | 2.04 (0.07)a | 3.32 (0.21)a |
| FYM + PM | 0.16 (0.03)a | 1.40 (0.24)a | 3.14 (0.07)a |
| FYM + VC | 0.35 (0.09)ab | 2.43 (0.40)a | 3.50 (0.38)a |
| PM + VC | 0.40 (0.18)ab | 3.87 (2.84)a | 2.87 (0.76)a |
| FYM + PM + Azotobacter | 0.32 (0.08)ab | 2.33 (0.34)a | 3.46 (0.24)a |
| FYM + VC + Azotobacter | 0.34 (0.08)ab | 2.31 (0.48)a | 3.67 (0.06)a |
| PM + VC + Azotobacter | 0.55 (0.13)b | 3.12 (0.72)a | 2.42 (1.38)a |
| Inorganic control | 0.28 (0.06)ab | 1.97 (0.38)a | 3.66 (0.13)a |
| Absolute control | 0.32 (0.12)ab | 3.32 (2.48)a | 2.56 (1.56)a |
3.1.2 Analysis of diversity indices
The highest value of the McIntosh index was recorded in poultry manure (2.5 t·ha−1) + vermicompost (3.5 t·ha−1) (3.87), followed by poultry manure (2.5 t·ha−1) + vermicompost (3.5 t·ha−1) + biofertilizers (3.12) and FYM (10 t·ha−1) + vermicompost (3.5 t·ha−1) (2.43) after 72 h. No significant differences were observed between the treatments (Table 2). After 72 h, the highest value of the Shannon–Weaver index was recorded in FYM (10 t·ha−1) + vermicompost (3.5 t·ha−1) + biofertilizers (3.67), followed by inorganic control (3.66) and FYM (10 t·ha−1) + vermicompost (3.5 t·ha−1) (3.50), and the lowest value was observed in poultry manure (2.5 t·ha−1 + vermicompost (3.5 t·ha−1) + biofertilizers (2.42). No significant differences were observed between the treatments (Table 2).
3.1.3 Carbon utilizing pattern
The results showed in Fig. 2 revealed that, carbohydrates and polymer consuming microorganisms were dominant irrespective of treatments in the organic and inorganic vegetable production system. The highest consumption of carbohydrates was recorded in poultry manure (2.5 t·ha−1) + vermicompost (3.5 t·ha−1) and it was at par with poultry manure (5.0 t·ha−1) and FYM (10 t·ha−1) + poultry manure (2.5 t·ha−1) + biofertilizers (Azotobacter 500 g·ha−1). The treatment inorganic control recorded lowest value and it was statistically at par with FYM (10 t·ha−1) + poultry manure (2.5 t·ha−1) and FYM (10 t·ha−1) + vermicompost (3.5 t·ha−1) + biofertilizers. No significant difference was observed between the absolute control, FYM (20 t·ha−1); poultry manure (2.5 t·ha−1) + vermicompost (3.5 t·ha−1); vermicompost (7 t·ha−1) and FYM (10 t·ha−1) + vermicompost (3.5 t·ha−1) with respect to the consumption of carbohydrates by soil microbes. The utilization of phenolic compounds was highest in poultry manure (2.5 t·ha−1) + vermicompost (3.5 t·ha−1) + biofertilizers (Azotobacter 500 g·ha−1) treatment and lowest in the inorganic control. The highest consumption of carboxylic acid was recorded in the absolute control, followed by poultry manure (2.5 t·ha−1) + vermicompost (3.5 t·ha−1); poultry manure (5 t·ha−1); vermicompost (7 t·ha−1) and FYM (10 t·ha−1) + vermicompost (3.5 t·ha−1), and the lowest consumption was recorded in the inorganic control. There was no significant difference between the treatments, except for the inorganic control.
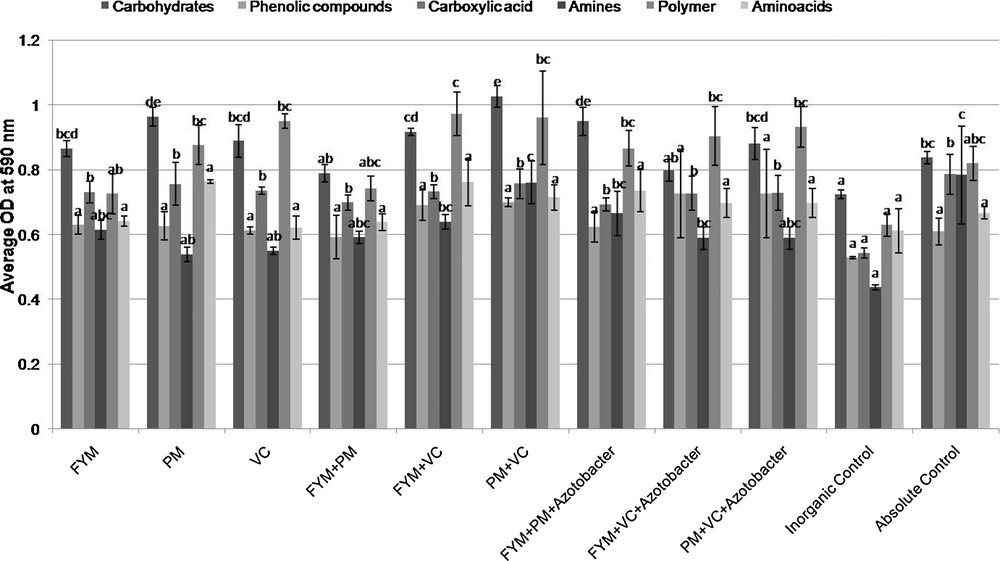
Microbial consumption pattern of six groups of carbon sources of soil treated with organic and inorganic fertilizers in a vegetable cropping system. Same letters on the top of the column represent no significant difference among major groups of carbon sources utilized by microbial community with in the treatments at Tukey's HSD (p ≤ 0.05). FYM: farm yard manure (20 t·ha−1); PM: poultry manure (5 t·ha−1); VC: vermicompost (7 t·ha−1); FYM+ PC: FYM (10 t·ha−1) + poultry manure (2.5 t·ha−1); FYM+ VC: FYM (10 t·ha−1) + vermicompost (3.5 t·ha−1); PC+ VC: poultry manure (2.5 t·ha−1) + vermicompost (3.5 t·ha−1); FYM + PC + Azotobacter: FYM (10 t·ha−1) + poultry manure (2.5 t·ha−1) + biofertilizers (Azotobacter 500 g·ha−1 applied as seed treatment); FYM + VC + Azotobacter: FYM (10 t·ha−1) + vermicompost (3.5 t·ha−1) + biofertilizers (Azotobacter 500 g·ha−1 applied as seed treatment); PC + VC+ Azotobacter: poultry manure (2.5 t·ha−1) + vermicompost (3.5 t·ha−1) + biofertilizers (Azotobacter 500 g·ha−1 applied as seed treatment); inorganic control: 120:60:60 kg NPK ha−1; absolute control: no fertilizers. Masquer
Microbial consumption pattern of six groups of carbon sources of soil treated with organic and inorganic fertilizers in a vegetable cropping system. Same letters on the top of the column represent no significant difference among major groups of carbon sources ... Lire la suite
For amine consumption, the treatments viz., absolute control; poultry manure (2.5 t·ha−1) + vermicompost (3.5 t·ha−1), FYM (10 t·ha−1) + poultry manure (2.5 t·ha−1) + biofertilizers (Azotobacter 500 g·ha−1), FYM (10 t·ha−1) + vermicompost (3.5 t·ha−1); FYM (20 t·ha−1), FYM (10 t·ha−1) + poultry manure (2.5 t·ha−1), poultry manure (2.5 t·ha−1) + vermicompost (3.5 t·ha−1) + biofertilizers (Azotobacter 500 g·ha−1) and FYM (10 t·ha−1) + vermicompost (3.5 t·ha−1) + biofertilizers (Azotobacter 500 g·ha−1) were at par with each other, and the inorganic control recorded the lowest value. FYM (10 t·ha−1) + vermicompost (3.5 t·ha−1) recorded the highest value for polymers, but no significant difference was observed between all other treatments, except FYM (20 t·ha−1) and inorganic control. Poultry manure (5 t·ha−1) recorded the highest value for amino acid followed by FYM (10 t·ha−1) + vermicompost (3.5 t·ha−1); FYM (10 t·ha−1) + poultry manure (2.5 t·ha−1) + biofertilizers; poultry manure (2.5 t·ha−1) + vermicompost (3.5 t·ha−1) and poultry manure (2.5 t·ha−1) + vermicompost (3.5 t·ha−1) + biofertilizers; the lowest value was observed in the inorganic control.
3.2 Biplot analysis
Biplot analysis of 11 treatments showed that organic sources of nutrients (T1–T9) were separated from inorganic sources of nutrients (T10). The six major carbon compounds and majority of organic treatments were distributed in the first and fourth quadrants, the carboxylic acids and amines laid on the first quadrant; amino acids, phenolics, polymer and carbohydrates on the fourth quadrant, the inorganic control was separated from other treatments and laid in the third quadrant. The treatment FYM (10 t·ha−1) + vermicompost (3.5 t·ha−1) was strongly responding to amino acids, phenolics, and polymers (Fig. 3).
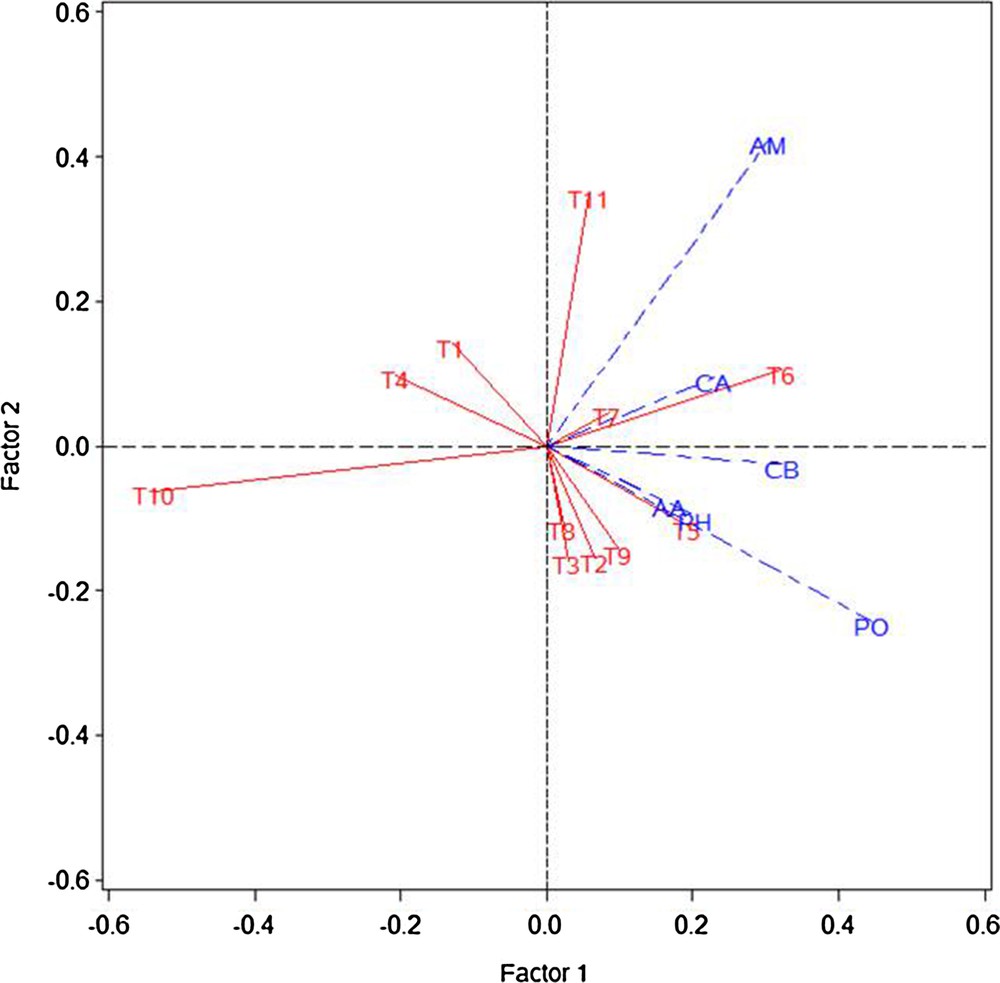
Biplot analysis of Biolog data (72 h) depicting the separation of 11 treatments supplied with organic and inorganic fertilizers in a vegetable cropping system. AM: amines, AA: aminoacids, CA: carboxylic acids, PH: phenolics, PO: polymer, and CB: carbohydrates. T1: FYM (20 t·ha−1); T2: poultry manure (5 t·ha−1); T3: vermicompost (7 t·ha−1); T4: FYM (10 t·ha−1) + poultry manure (2.5 t·ha−1); T5: FYM (10 t·ha−1) + vermicompost (3.5 t·ha−1); T6: poultry manure (2.5 t·ha−1) + vermicompost (3.5 t·ha−1); T7: FYM (10 t·ha−1) + poultry manure (2.5 t·ha−1) + biofertilizers (Azotobacter 500 g·ha−1 applied as seed treatment); T8: FYM (10 t·ha−1) + vermicompost (3.5 t·ha−1) + biofertilizers (Azotobacter 500 g·ha−1 applied as seed treatment); T9: poultry manure (2.5 t·ha−1) + vermicompost (3.5 t·ha−1) + biofertilizers (Azotobacter 500 g·ha−1 applied as seed treatment); T10: inorganic control (120:60:60 kg NPK·ha−1); T11: absolute control (no fertilizers). Masquer
Biplot analysis of Biolog data (72 h) depicting the separation of 11 treatments supplied with organic and inorganic fertilizers in a vegetable cropping system. AM: amines, AA: aminoacids, CA: carboxylic acids, PH: phenolics, PO: polymer, and CB: carbohydrates. T1: FYM (20 t·ha−1); ... Lire la suite
4 Discussion
The use of excessive chemical fertilizers reduces microbial functional diversity in vegetable farming soils [37]. Mader et al. [38] reported that soils under organic farming had enhanced microbial functional diversity in comparison with the soils of conventional farming. Organic materials/crop residues affect the functional diversity of soil microbial communities [39]. The present investigation was carried out to identify the best combination of organic nutrient sources that would help in enhancing microbial activity and soil health in vegetable production systems.
Average well colour development values denote the consumption of carbon sources by the microbial communities. It indicates the microbial activity in the soil samples [30]. The different microbial communities will have different respiration responses to carbon compounds [40]. The AWCD of the soil samples was less in the first 24 h incubation period, but it was steadily improved with an increase in the incubation time. The average utilization (i.e. AWCD) of the C sources increased with the incubation time for all treatments. The different organic and inorganic fertilizer treatments significantly affected the AWCD at 72 h and 120 h (p < 0.005; Table 1). Overall, different organic inputs have stimulated the metabolic activity of soil microorganisms, in terms of the utilization of different carbon sources in comparison with that of chemical fertilizers alone. The best treatments at 72 h and 120 h of incubation time include poultry manure (2.5 t·ha−1) + vermicompost (3.5 t·ha−1) + biofertilizers (Azotobacter 500 g·ha−1) > poultry manure (2.5 t·ha−1) + vermicompost (3.5 t·ha−1) > FYM (10 t·ha−1) + vermicompost (3.5 t·ha−1) = poultry manure (2.5 t·ha−1) + vermicompost (3.5 t·ha−1) > FYM (10 t·ha−1) + vermicompost (3.5 t·ha−1) > poultry manure (5.0 t·ha−1) = FYM (10 t·ha−1) + poultry manure (2.5 t·ha−1) + biofertilizers (Azotobacter 500 g·ha−1) respectively (Fig. 1). Poultry manure and vermicompost are good sources of nutrients [41–43] and might provide more substrates for utilization by the microorganisms, due to this maximum metabolic activity that was observed in the present investigation.
The McIntosh index (U) is used to define the evenness or homogeneity of soil microorganisms. In the present investigation, the highest values are recorded in different organic treatments in comparison with the inorganic control. Zhong et al. [44] reported that application of organic manure, organic manure + NPK significantly enhanced the McIntosh index. However, in the present investigation, no significant differences were observed between different organic and inorganic treatments (Table 2). Zhang et al. [45] reported the lowest Mcintosh index when no fertilizer was applied. No significant influence of straw manure in combination with chemical fertilizer, pig manure in combination with chemical fertilizer.
Shannon indices infer the metapopulation species diversity. The different organic treatments had higher Shannon indices of carbon substrate utilization compared with inorganic treatment. Shannon index followed gradual increasing trend up to 72 h of incubation, and thereafter the values started to decline. Conversely, in the following treatments, FYM (10 t·ha−1) + poultry manure (2.5 t·ha−1); FYM (10 t·ha−1) + vermicompost (3.5 t·ha−1); FYM (10 t·ha−1) + poultry manure (2.5 t·ha−1) + biofertilizers (Azotobacter 500 g·ha−1); FYM (10 t·ha−1) + vermicompost (3.5 t·ha−1) + biofertilizers (Azotobacter 500 g·ha−1); poultry manure (2.5 t·ha−1) + vermicompost (3.5 t·ha−1) + biofertilizers (Azotobacter 500 g·ha−1); inorganic control, and absolute control, the values increased up to 48 h and declined afterwards (Fig. 3). No significant differences were observed among measures of carbon source utilization evenness between different treatments (Table 2). This could be because all treatments included in the present study have resulted in the same level of species richness. Lee et al. [46] reported that the application of organic matter to soil by way of different amendments increase the microbial activities in terms of higher Shannon index in organic treatments than the chemical fertilizers; however no significant differences were observed in the present study between the organic and inorganic treatments. The results of the present investigation also corroborate the findings of Lee et al. [46] and Mader et al. [38].
Biplot analysis showed the separation of organic and inorganic treatments, indicating the stronger influence of organic inputs on the functional diversity of microorganisms than in the inorganic treatment. Kumar et al. [33] reported that the use of organic sources of nutrients improves organic carbon content of soils and enhances the AWCD, McIntosh and Shannon indices values. Different utilization pattern of six major carbon sources was observed between the organic and inorganic treatments. The lowest utilization values were noticed in the inorganic control (Fig. 2). This might be due to organic nutrients providing more utilizable carbon sources than the inorganic nutrients, since inorganic fertilizers do not directly supply carbon, their continuous use has led to lower microbial biomass as well as soil organic carbon content [33,47].
The present investigation led to the identification of the best combination of organic nutrient sources, i.e. poultry manure (2.5 t·ha−1) + vermicompost (3.5 t·ha−1) for enhanced metabolic activity of soil microorganisms and thereby improving soil health in vegetable production systems. This is the first report on functional diversity of soil microorganisms with respect to vegetable production systems in the Indo-Gangetic plains. Organic treatments, particularly FYM (10 t·ha−1) + vermicompost (3.5 t·ha−1), resulted in the dominance of amino acids, phenolics, and polymer utilizing microorganisms in comparison with inorganic treatments. Biolog® Eco-plate technique helps to understand the impact of organic and inorganic fertilizers on the functional diversity of microbial communities.
Disclosure of interest
The authors declare that they have no competing interest.
Acknowledgements
The authors are thankful to the authorities of the ICAR-Indian Institute of Vegetable Research, Varanasi and Division of Crop Production, ICAR-National Rice Research Institute, Cuttack, for providing the facilities for undertaking this study.
Vous devez vous connecter pour continuer.
S'authentifier