


 CC-BY 4.0
1. Introduction
Soils are the basis of 16 of the 24 ecosystem services listed in the Millennium Ecosystem Assessment (MEA, 2005). These services can be related to three major functions of the soil: water flow management, nutrient cycling and carbone storage with effect on climate, and support to primary production, which depends largely on the two previous functions (Kibblewhite et al., 2007). Physical characteristics of the soil determine the service of protection against erosion, water infiltration and retention at various potentials in pore spaces and the transfer of rainwater to water tables (Lavelle and Spain, 2001). The recycling of organic matter is done by two complementary processes, mineralization and humification. Mineralization, carried out at more than 90% by soil microorganisms, releases in assimilable mineral forms part of the nutrients contained in decomposing organic matter, such as nitrates, ammonium, phosphates or sulfates for example, and makes them available to the plant and living organisms in the soil. The complexity of biological processes and the diversity of organisms involved in this process allow for synchronization between the flow of released nutrients and their use by plants, an essential conservation mechanism compared to the mediocre rate of use of chemical fertilizers, which often does not exceed 50% for nitrogen, as an example (Fixen et al., 2015). The portion of organic matter that is not mineralized is preserved in the soil by two complementary chemical and physical protection systems. Chemical protection is achieved through the accumulation of recalcitrant compounds, macromolecules rich in aromatic compounds that are more difficult to degrade than carbohydrates with smaller molecules such as cellulose or proteins. Another part of the protection is physical in nature, when organic matter particles, micro-fragmented largely by the action of invertebrates, are associated with mineral particles in compact soil aggregates and thus protected from attack by microorganisms that no longer have physical access to them (Chevallier, 2011). Soils also shelter a significant proportion of global biodiversity (Orgiazzi et al., 2016; FAO et al., 2020; Anthony et al., 2023), probably more than half of it.
It is known that soil management methods profoundly affect the production of these services, with positive or negative externalities depending on the practices (Gairola et al., 2024). The adoption of intensive agricultural methods combining the exclusive use of synthetic chemical fertilizers, mechanical tillage and chemical control of weeds and crop pests has considerably reduced the provision of soil ecosystem services to the sole benefit of production. The spectacular global increase of 250% in 40 years in food production, accompanied by a decrease in its price to 40% of the initial level, has been accompanied by the degradation of at least 1/3 of the planet’s soils (MEA, 2005), the destocking of 133 Gt of carbone equivalent to 15 years of anthropogenic emissions (Sanderman et al., 2017) and a generalized decrease in diversity, with, for example, a decrease in the density of macroinvertebrates of more than 60% in annual crops in temperate regions (Lavelle, Mathieu et al., 2022). Let us add to this assessment that, beyond the year 2000, the progressive depletion of soils gradually erased the observed benefits, and in 2020, the price of food returned to its 1960 value (MEA, 2005; FAO, 2025).
Agricultural economics has, until now, paid little attention to environmental and social externalities. The only accounting element of a farm’s operation is most often production, paid at a fixed price by the national or international market. Under these conditions, environmental damage associated with aggressive practices is not penalized, and the care taken by producers who use gentle practices to maintain good environmental quality is not compensated.
The idea of such compensation is, however, widespread and even enshrined in the constitutions of various countries (Engel et al., 2008; FAO, 2011; Salzman et al., 2018). Its practical implementation is limited to a few experimental situations, if we exclude the numerous projects aimed at remunerating the protection of areas where water supplies for many cities or carbon storage are generated.
A major obstacle to the implementation of targeted policies is the very measurement of services. Payment systems, for example, for carbon storage, are complex and require a level of expertise that makes transaction costs high. Only a few wealthy farmers or large agribusinesses can implement them, and small producers, who generally manage the land more amicably, are not affected by these subsidies. However, we know that such policies, even when implemented at a low subsidy level, have surprising effects (Schomers et al., 2015).
Strongly connected to all the microbial and faunal elements of soil biodiversity, macroinvertebrates form an abundant community everywhere and of a great diversity. Defined simply by the fact that they are visible to the naked eye, they are divided into 15 major taxonomic units, between superfamilies and orders (Table 1). They include social insects (ants and termites), many non-social insects (Coleoptera, Diptera, Dermaptera), Myriapoda Chilopoda, Diplopoda, several groups of Arachnida, earthworms (Crassiclitellata) and terrestrial Gastropoda and a few less frequent invertebrates. These groups are found everywhere, except for termites confined to intertropical regions, with frequencies that vary from 9 to 71% depending on the group. The species, genera and even families, however, differ greatly from one site to another, even if the functions assumed are comparable within the same group. Rarer units are found locally: Arachnids (Solifuges, Palpigrades, Uropyges), the very primitive Onychophora of tropical rainforests, the Mermithidae Nematodes parasites of Orthoptera whose cycle phase passes through the soil, the pseudo-social Embioptera, cicada larvae and spectacular Gryllotalpidae with powerful burrowing forelegs. The diversity and abundance of these soil inhabitants are familiar to farmers who have names for them, whatever the region.
General biology and frequency of soil macroinvertebrate taxa in 3684 sites of the Macrofauna database (Lavelle, Mathieu et al., 2022)
| Common english name | Taxonomic classification | Taxonomic level | Main habitat | Feeding habits | Respiration | % frequency in DB |
|---|---|---|---|---|---|---|
| Earthworms | Crassi clitellata | Order | Litter and soil | Detritivores, geophagous | Skin | 70.7 |
| Beetles | Coleoptera | Order | Litter Rhizosphere | Predators, detritivores, fungivores | Trachea | 65.4 |
| Ants | Formicidae | Family | Soil and litter | Predators granivores, fungivores | Trachea | 53.3 |
| Spiders | Araneae | Order | Litter and soil | Predators | Trachea | 49 |
| Centipede | Chilopoda | Order | Leaf and woody litter | Predators | Trachea | 35.8 |
| Milipede | Diplopoda | Order | Leaf and woody litter | Detritivores | Trachea | 33.4 |
| Fly larvae | Diptera | Order | Litter and soil | Predators, detritivores, fungivores | Trachea | 27.2 |
| Termites | Termitoidea | Epifamily | Soil, decaying logs | Detritivores, herbivores, wood feeders | Trachea | 26.6 |
| Woodlouse | Isopoda | Order | Litter | Saprophagous | Gills | 19.5 |
| Stink bugs | Homoptera Hemiptera | Order | Litter | Phytophagous | Trachea | 19.3 |
| Snails and slugs | Pulmonata | Order | Litter | Herbivorous, saprophagous | Lung | 18.2 |
| Cockroaches | Blattaria | Order | Litter | Detritivores | Trachea | 13.8 |
| Cricket | Grylloidea | Super family | Litter | Detritivores | Trachea | 12.7 |
| Caterpilar | Lepidoptera | Order | Litter | Detritivorous | Trachea | 12.1 |
| Earwings | Dermaptera | Order | Litter | Predators, saprophagous | Trachea | 8.9 |
| Others | Cicadoidea, Opilionidae, Scorpions, Pseudoscorpions… | 15.2 |
In this review, we explain the essential role of macroinvertebrates in the ecological functioning of the soil. We then summarize a set of field data that demonstrate the strong link between these communities and soil-based ecosystem services. We finally present a simple and inexpensive method that synthesizes the state of their communities into a single numerical indicator. We propose making this indicator available to farmers so that they can use it as a marker of the environmental externalities of their practices and benefit from possible subsidies that recognize the environmental benefits produced by their work.
These invertebrates exhibit a wide variety of feeding habits, habitat preferences, locomotion abilities and breathing patterns in the soil, making them excellent natural indicators of living conditions in this environment.
2. Living in the soil
To understand the importance of macroinvertebrate populations in soil function, it is important to consider the specific conditions of the soil as a living environment. Living in the soil means facing at least two very strong constraints: the compact nature of this environment that is difficult to penetrate, and the nature of the available food resources (Lavelle and Spain, 2001).
2.1. Moving in a compact environment
Soils are compact environments, although porosity can occasionally reach high values, of more than 50% for example, in the upper 5 to 10 cm of Amazonian forest soils populated by active fauna. Porosity, however, decreases rapidly in depth as biological activity decreases, and the installation of pastures in the same Amazonian site can make it drop to less than 20% in the upper first centimeters (Barros et al., 2001). This porosity is however composed of a sizeable proportion of micropores inaccessible even to soil microorganisms, and the low connectivity of habitable pores limits the usable space and movements in the soil matrix. In such a context, two adaptive strategies are defined: moving by digging and thereby accessing available food resources, or entering dormancy when available resources in contact with the organism are exhausted, and waiting for favorable conditions to resume activity. The first strategy is that of burrowing organisms, the engineers of the soil ecosystem, mainly earthworms, termites and ants, which move and arrange the soil by digging galleries and macropores. For other organisms that inhabit the mineral soil and are unable to dig, the option is to use the porous spaces created by the engineers. This is the case for example of the mesofauna, 0.1 to 2 mm in size, mainly comprised of Acari and Collembola, which take advantage of the porous spaces created by earthworms or roots to colonize deep soil layers (Loranger et al., 1998). For microorganisms unable to move to new food sources, once the one in contact with them has been exhausted, the option is dormancy until bioturbation gives them new opportunities to resume activity and encounter new food sources. It is thus measured that in the soil, up to 75% of bacteria are inactive (Couradeau et al., 2019), and the turnover time of bacterial biomass is measured in months and even years, when the generation time can be less than an hour in optimal laboratory conditions (Lavelle and Spain, 2001).
2.2. Feed on poor or unpredictable high-quality food
The second major constraint of the soil relates to the quality and availability of food resources. We can roughly distinguish two main types of resources: (1) necromass of plant, animal or microbial origin and (2) soluble resources, i.e. the energy mediators produced by engineer organisms (Lavelle, Spain, et al., 2016).
(1) Necromass. Plant necromass is a diverse set of leaves, stems, branches and roots. Although this set covers a very wide diversity of compositions and structures, two general characteristics make its digestion problematic for most organisms. The first is the overall composition in various elements that imposes stoichiometric limitations on the use of these resources (Yu et al., 2025). It is frequently observed that the high value of the C:N ratio, for example, forces the user organism to find a complementary source of nitrogen, or to implement physiological mechanisms for the elimination of excess carbon when simple elimination by aerobic respiration is not sufficient (Swift et al., 1979). This constraint is well known to farmers who bury straw at a high C:N ratio, with the consequence of immobilizing the nitrogen available in the soil and a temporary competition between the plant and the microflora that decomposes the straw.
In addition to this chemical limitation, a second one is the inclusion of nitrogen from plant cells in tannin-protein complexes that very few organisms can digest. These tannins, whose function is to limit herbivory when the leaf is alive, are contained in vacuoles whose contents are released when the plant dies. It is estimated that more than 80% of the nitrogen in dead leaves or roots is blocked in this form Toutain (1987). Another chemical limitation is the presence of lignin, a naturally poorly digestible compound.
There may also exist a physical limitation: the mechanical resistance of the compounds to the processes of comminution and fragmentation necessary for seeding the fungi that will carry out the first stages of decomposition.
Animal necromass, which represents a relatively small proportion of resources, presents fewer limitations.
Microbial necromass, the subject of recent abundant literature (Liang et al., 2019; Sokol et al., 2022), is characterised by chemical markers that allow it to be identified and quantified. However, a doubt remains: are these markers exclusive to necromass or can they also characterize living biomass and/or microbial metabolites, such as mucilage polysaccharides and enzymes for example?
The fragmented, transformed necromass of any origin, associated with mineral elements in soil aggregates, constitutes the organic matter of the soil. This is an abundant resource, but its use is made difficult by a highly dispersed distribution at the scale of microorganisms, or by its low concentration in soil for invertebrates that feed on it. Added to these disadvantages is the location in aggregates that offers physical protection, and the chemical quality impoverished in easily assimilated elements during the various stages of its transformation.
(2) Soluble resources. The other major resource for soil organisms is the largely soluble products secreted by roots (root exudates), earthworms (intestinal mucus) or termites (saliva). These compounds, grouped under the term energy mediators (Lavelle, Spain, et al., 2016), are used by soil engineering organisms, roots and macroinvertebrates, to stimulate the activity of soil microorganisms by priming effects (Lavelle and Spain, 2001). Microorganisms, once taken out of the dormancy in which they can be immersed for months or even years, digest the compounds that neither the roots nor the invertebrates can assimilate, in a system of mutualistic digestion (Lavelle, Lattaud et al., 1994). These resources of very high energy value and digestibility are abundant. Up to 20% of the products of photosynthesis are injected into the soil at the root tips, while earthworms add to the ingested soil between 5 and 18% of intestinal mucus composed of low molecular weight glycoproteins (Martin et al., 1987). The disadvantage of these resources is the extreme localization, both in time and space, of their production, which makes them sporadic resources (ibid.).
2.3. Self-organized soil
Soil communities are thus roughly divided between microorganisms unable to move in the compact universe of the soil, which forces them to long periods of dormancy, and invertebrates and roots, capable of moving in the litter layers if not in the mineral soil, and even for some of them carrying out bioturbation, but with insufficient enzymatic equipment to digest most of the available resources (Lavelle, Lattaud et al., 1994; Lattaud et al., 1998). Complementarity and association of these two groups are the basis of the functioning of the soil as a self-organized system in which macroinvertebrates occupy a strategic place (Figures 1 and 2, Lavelle, Spain, et al., 2016).
Soil as a self-organized system of biological entities. Organisms of increasing sizes, from microorganisms to micro invertebrates (microfoodwebs), ecosystem engineers and ecosystems (horizontal axis) create structures of different sizes (vertical axis) and organize soil at different nested scales from 1 (microbial aggregates inhabited by microbial communities) to 5 (landscape viewed as a mosaic of different ecosystems). Most soil-based Ecosystem services are perceived and delivered at the landscape (5) scale.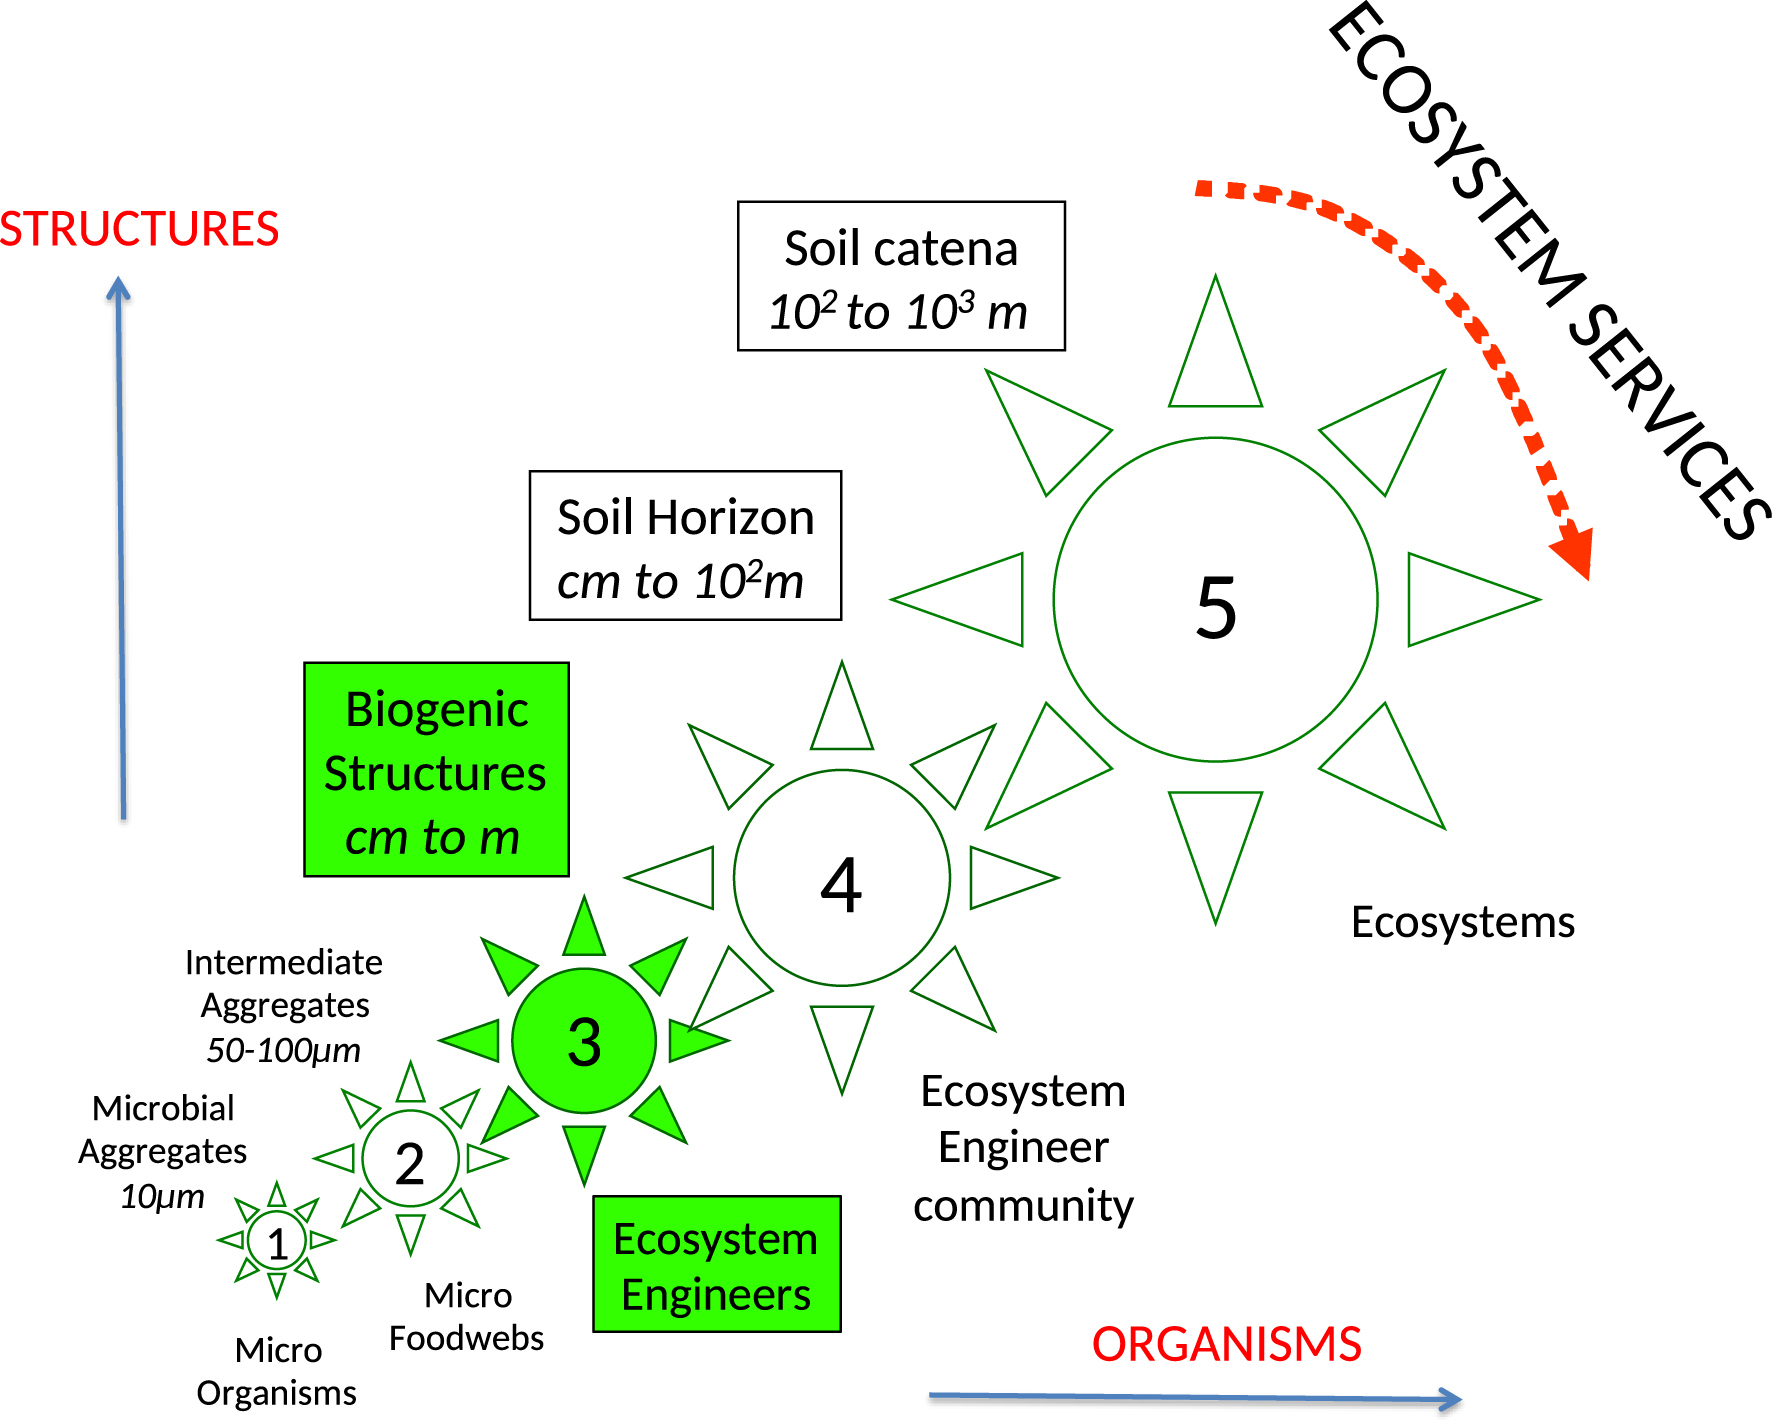
Interactions among self-organized units across scales and the delivery of ecosystem services. Ecosystem engineers select and activate microbial communities in their functional domains (1). A mutualist digestion system (2) releases energy (3) used by ecosystem engineers to build biogenic structures and organize soil physical structure (4) with resulting effects on water services (infiltration and storage) (5). The combination of mineralization processes during the digestion process and sequestration of organic compounds in biogenic structures affects soil organic matter dynamics (6), and hence, nutrient cycling and climate regulation (7). Note that additional scales such as biome and biosphere may be added when ecosystem services are considered at a global scale.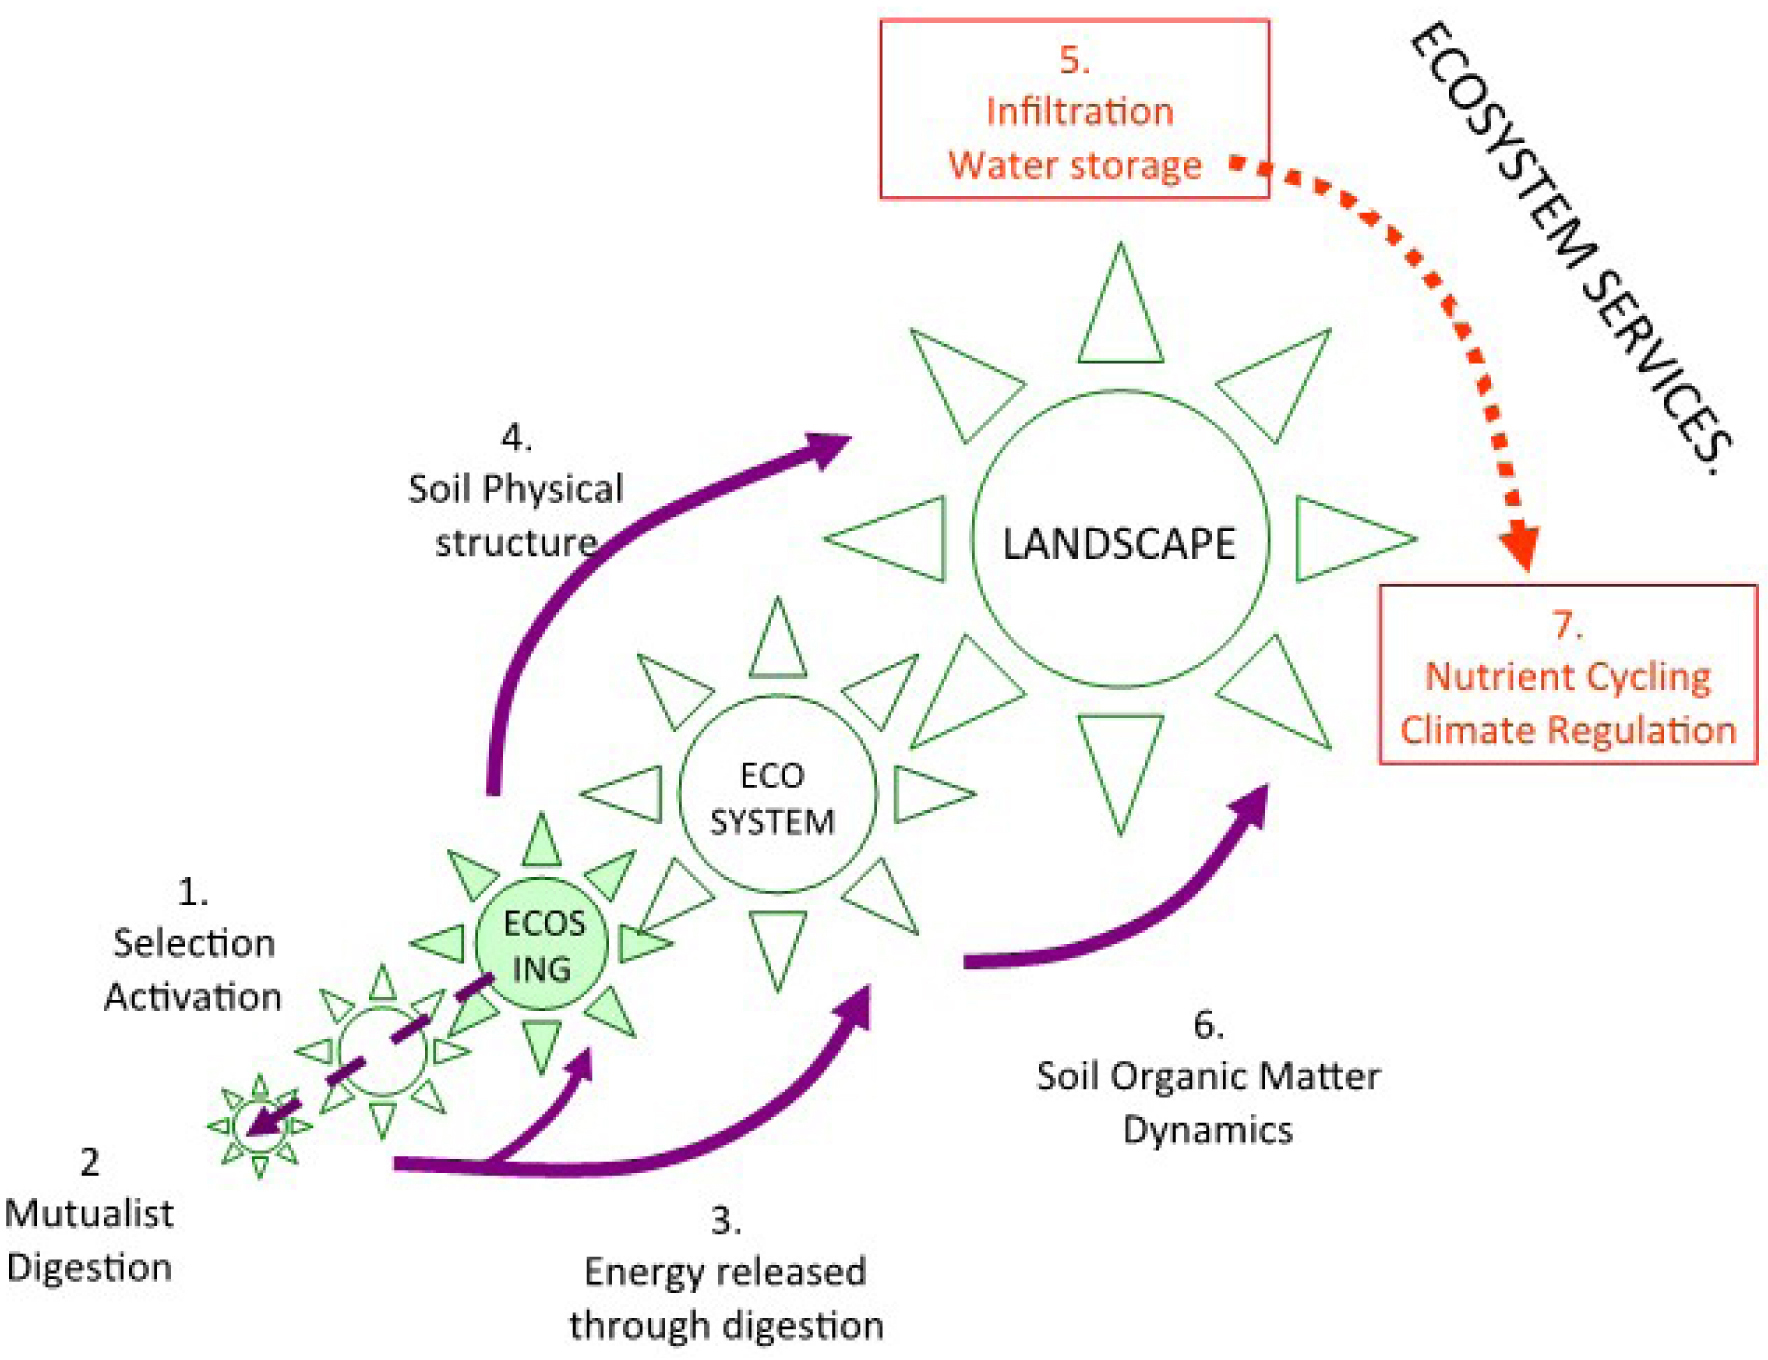
3. Macroinvertebrates as indicators
The role of macroinvertebrates and the characteristics of their populations make them natural indicators with great potential. The fact that all major groups, except for termites, are present everywhere, even if with different species, genera and families, and are recognized by most soil workers, will facilitate the collection of data by many people. Practical tools for the quantitative analysis of populations and the development of numerical indicators are available.
There are two ways of using them as indicators: at the species level, with indicator species, or at the population level with synthetic indicators.
3.1. Indicator species
Healthy soils may host up to several hundred macroinvertebrate species. Ants, Coleoptera and Arachnida are usually the most speciose groups, but earthworms and termites may also be interesting indicators (Lobry de Bruyn, 1999; Sanabria, Dubs et al., 2016; Duran-Bautista et al., 2020; Dufrêne and Legendre, 1997). The IndVal evaluation, which measures the indicative power of species for a given ecosystem attribute, allows to identify indicator species (Dufrêne and Legendre, 1997). Several studies have successfully tested this method, opening the way to interesting uses of community data. For example, in a set of 75 plots distributed among five land use types of the Colombian Eastern Plains, 91 ant species were collected using the ISO/TSBF (Anderson and Ingram, 1993; ISO, 2011) hand sorting method. Of these, 52 were found in improved pastures, 45 in semi-natural savanna, 39 and 38 respectively in rubber and oil palm plantations, and 20 in annual crops (Sanabria, Lavelle et al., 2014). Improved pastures had the highest number of unique species, found only in this land use system (11), followed by rubber plantations (10) and semi-natural savannas (9). In the same plots, measurement of a complete set of soil physical and chemical variables, macroinvertebrate communities, accumulation of carbon in soils and vegetation and greenhouse gaz (GHG) emissions allowed to elaborate synthetic indicator proxies of soil-based ecosystem services (ES) (Lavelle, N. Rodríguez et al., 2014). Fifteen species showed a significant indicator value: five as indicators of general biodiversity (soil macroinvertebrate communities); five of macroaggregate morphology, a proxy to water infiltration and storage in soil; one of water regulation (negatively linked to soil compaction); three to soil nutrient provision (based on general soil chemical properties); and one to climate regulation as evaluated by a set of carbon concentrations in soil and biomass and GHG emissions. Interestingly, no species appeared to be indicative of multiple ES.
Another similar study on termites of 38 farms, located in deforested regions of Amazonia, in the Colombian Caqueta department and Brazilian Para state, shows interesting results. Forty-eight species were collected in total, 12 in Colombia and 45 in Peru. Nine species were common to both regions. Eleven species exhibited significant indicative power. Two species in Colombia were indicators of chemical fertility and soil aggregate morphology. In Peru, nine species had significant indicative power: two for hydrological functions linked to soil physical properties; one for soil aggregate morphology; and six for soil biodiversity as measured by macroinvertebrate community patterns. Four species were indicative of more than one ES proxy.
Participatory workshops conducted with farmers showed some knowledge of the species encountered and their relationship with soil ecosystem services, hydrological functions, chemical fertility and the diversity of macroinvertebrate populations (Duran, 2020). Peruvian farmers were able to recognize four of the seven species presented and indicate seven relationships with soil-based ES, five of which corresponded to significant effects recognized by the IndVal method. In Colombia, all seven species presented were known to farmers, and three of them were associated with chemical fertility, while the IndVal method was unable to confirm the significance of these relationships.
3.2. Synthetic indicators of macroinvertebrate communities
Other unpublished field studies logically showed that the ability of farmers to recognize soil invertebrates improves when considering broader taxonomic groups like families and orders. In subsequent work, we then tested the hypothesis that community compositions assessed at taxonomic levels such as order, would allow the prediction of associated ES at broad geographic scales. If this hypothesis were verified, it would show good correspondence between scientific knowledge and that of farmers.
A simple and inexpensive manual sorting method proposed nearly 40 years ago has been popularized in the Tropical Soil Biology and Fertility program (Anderson and Ingram, 1993). It has been further adopted as a standard by ISO (2011). The unit sample is a block of 25 cm on each side, extended to a depth of 30 cm. The block is extracted with a metal frame if this facility exists, and separated into four different layers, surface litter, 0–10, 10–20 and 20–30 cm. The recommended number of repetitions is five, spaced 30 m apart if the terrain allows, to avoid autocorrelation of the data. A study on sampling carried out in France even showed that, from three repetitions, the definition is sufficient to compare communities from contrasted land use types (Ruiz et al., 2032).
This simple and inexpensive method has been adopted massively. Today, the Macrofauna database which groups the data obtained with this method has more than 10 000 sampled sites, distributed across more than 60 countries, covering all terrestrial biomes and ecosystems except for cold or hot deserts (Mathieu et al., 2022).
A principal component analysis (PCA) of an intermediate version of the database, with 3694 sites, gave the following general results (Figure 3). The “average” community sampled in all these sites comprised 712 individuals per m2 belonging to five different orders. The first factor of the PCA ordered communities according to the abundance of all groups, with a major effect of social insects and litter invertebrates. The second factor opposed sites with dominant social insect populations to other non-social taxonomic groups. Specific tests showed significant effects of all the environmental parameters tested: vegetation cover (11% of the total explained variance), latitude (8.6%), altitude (5.2%), soil texture (3.2%) or temperature (2.3%) (Lavelle, Mathieu et al., 2022).
Projection of (left) macroinvertebrate group densities and community parameters in a plane defined by factors 1 and 2 (F1 and F2) of a principal component analysis of macroinvertebrate community data of the Macrofauna database. ANT, ants; ARAC, Arachnida; BLA, Blattaria; CHILO, Chilopoda; COL, Coleoptera; DEN, total density per square metre; DERM, Dermaptera; DIP, Diptera larvae; DIPLO, Diplopoda; EWM, earthworms; GAST, Gastropoda; HEMI, Homoptera Hemiptera; ISO, Isopoda; MYR, Myriapoda; ORTH, Orthoptera; OTH, other; RT, taxonomic richness (number of orders found in the sampling); TER, termites; and (right) average global mean density of different groups and species richness. Lower box: Percentage of variance explained by different environmental factors (after Lavelle, Mathieu et al., 2022).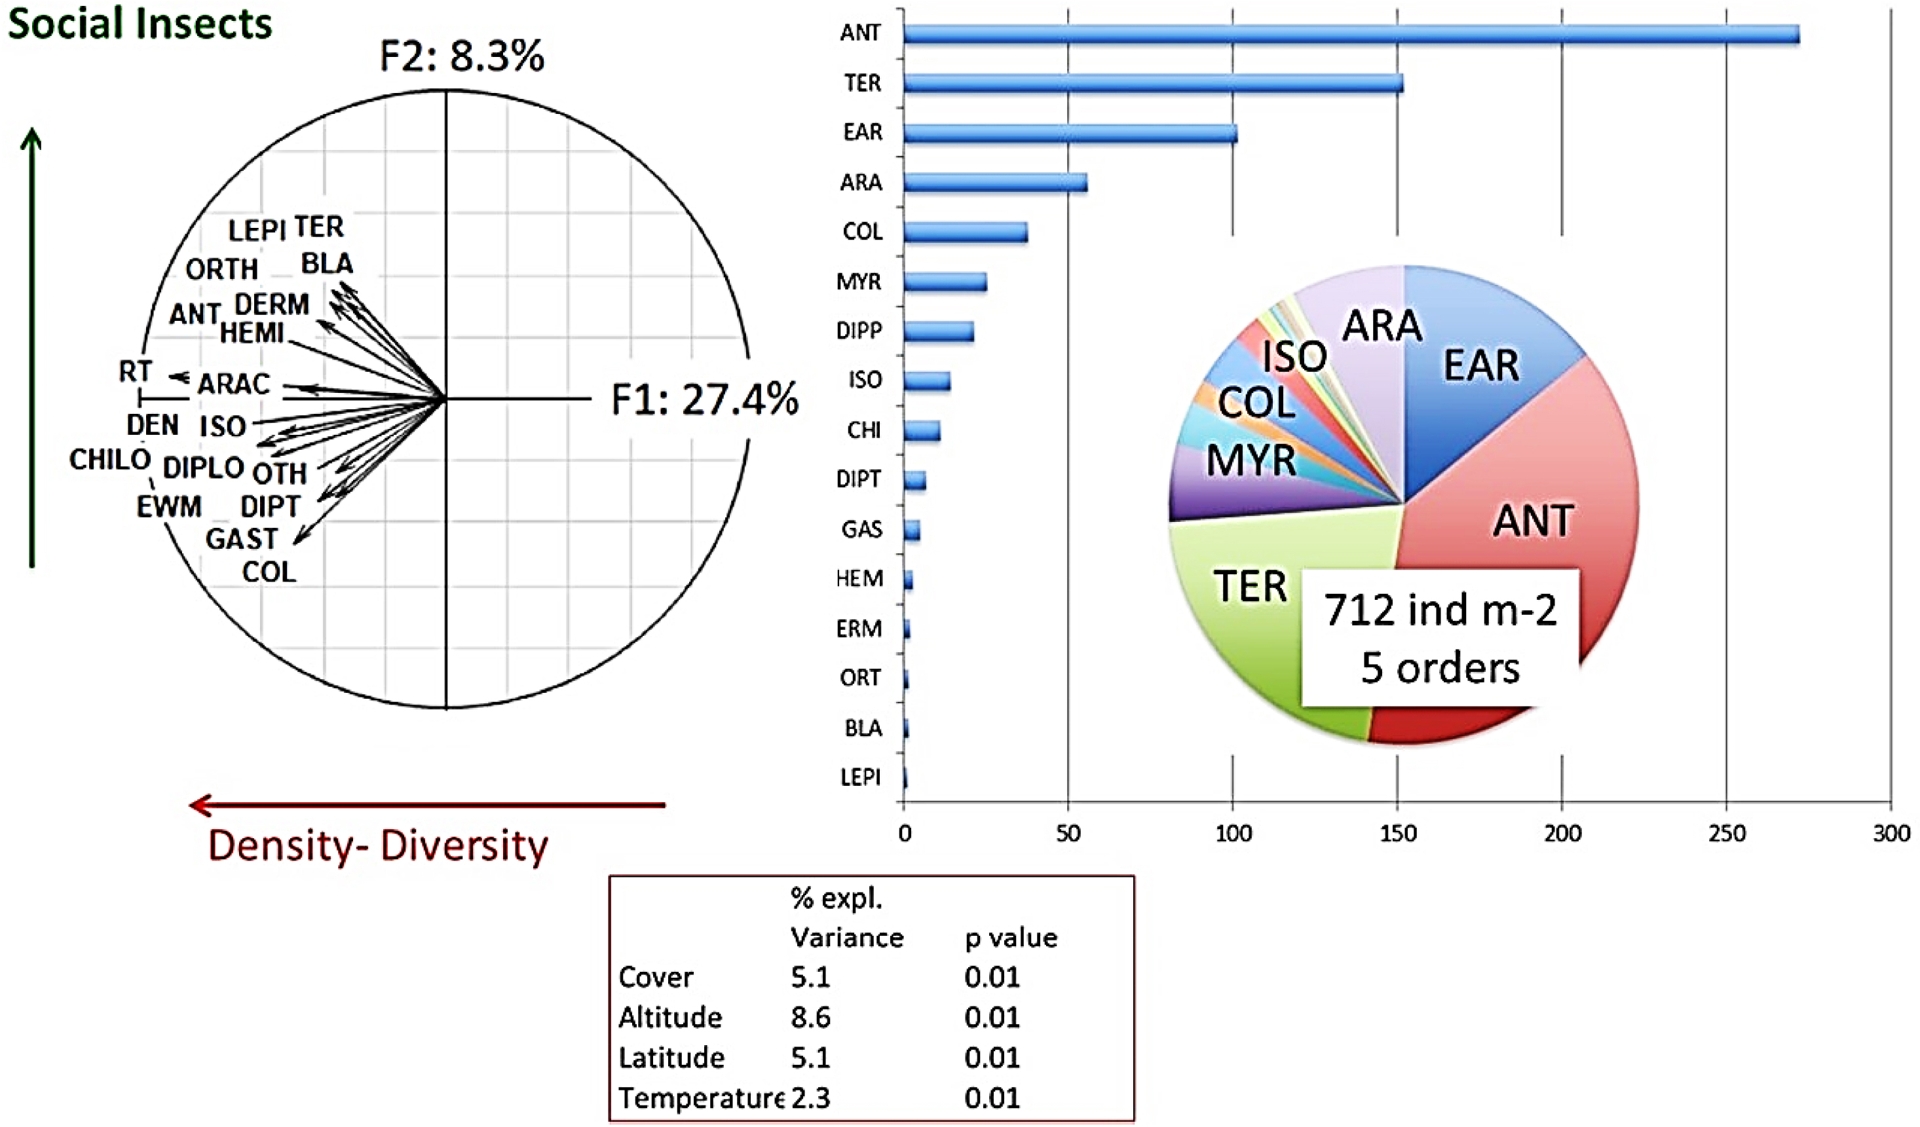
The abundance data of macrofauna groups in the different types of land use at a given site can be synthesized into an indicator calculated from three metrics produced by the PCA analysis: the % of variance explained by each of the first two axes, correlations of the variables (the densities of the different taxonomic groups) with the factorial axes and coordinates of the points along these axes. This indicator is calibrated to vary from 0.1 to 1.0 depending on whether the population is abundant and diverse (Velasquez, Lavelle and Andrade, 2007). This indicator has proven to be very sensitive to the types of cover and land use, as shown in the example of the study carried out in the eastern llanos of Colombia (Lavelle, N. Rodríguez et al., 2014). In this site, the indicator had the highest values in pastures that associated the African grass Brachiaria humidicola with the legume Centrosema. Although having a higher average, the difference with the natural savanna and the oil palm plantation was not significant, unlike the rubber plantation, and especially the transitional rice, soybean and corn cropping systems, which showed the lowest average of 0.28 against 0.74 in the improved pasture (Figure 4).
Macrofauna indicators in different types of land uses in Colombian Orinoquia (left) and coefficient of matrix correlation (Rv) among tables of data for the different indicators of ecosystem services, and associated p-values (*p < 0.05; **p < 0.01; ***p < 0.001) (right).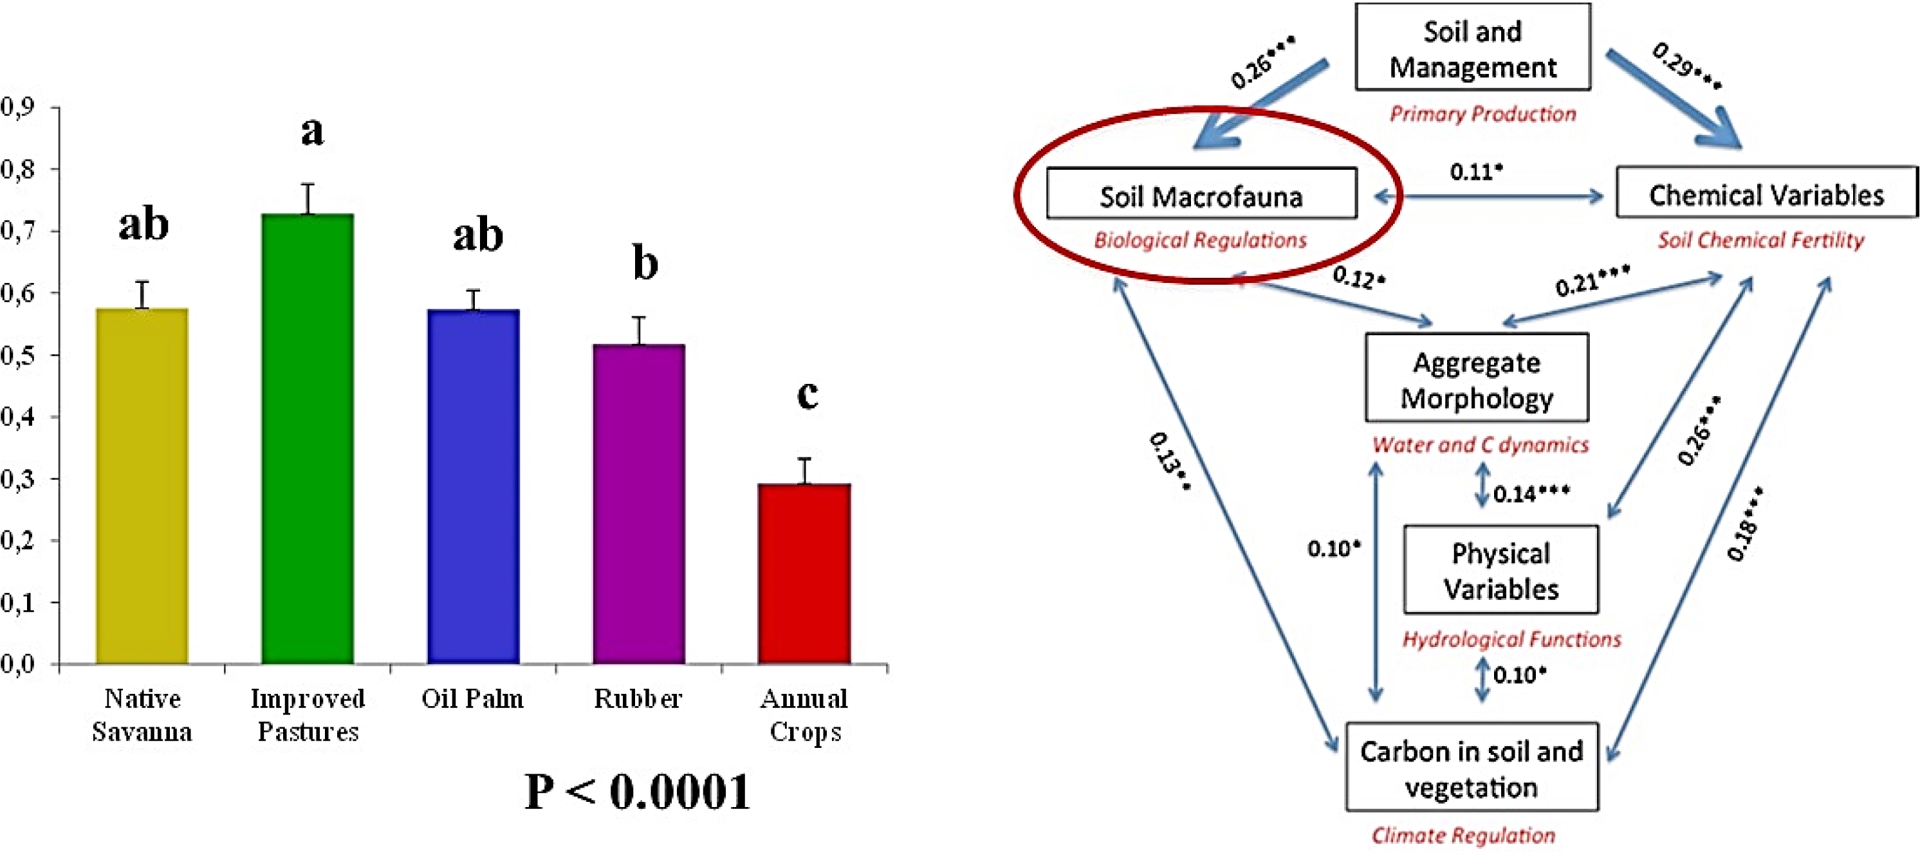
In this site, the measurement of the chemical and physical parameters of the soil and the carbon accumulated in the soil and vegetation and emissions of greenhouse gases has allowed the construction of synthetic indicators, with the same methodology used for macrofauna. The matrix correlations between the data tables thus constituted are all significant at the p threshold value of 0.01. This result, and others similar (Lavelle, Dolédec et al., 2016; Galindo et al., 2022; L. Rodríguez et al., 2021; Velasquez and Lavelle, 2019), confirmed, on the one hand, the group behavior of bundles of ecosystem services, which all vary in the same direction (Raudsepp-Hearne et al., 2010). On the other hand, they suggest using the macrofauna indicator as a proxy for all the others, with the additional advantage that it can be evaluated at a low cost by local field operators.
3.3. Building a global indicator
The numerous studies comparing macroinvertebrate populations in different types of use of a same locality always showed a pattern similar to the one obtained with the full set of data: axis 1 of the PCA that compares communities of different types of local land uses systematically classifies them according to the abundance of all groups and taxonomic richness (Hurtado et al., 2024). Axis 2 separates the sites where social insects dominate. A global indicator was therefore created from the 3694 sites compiled in the Macrofauna database. This indicator was applied to communities sampled in ten regions with contrasting characteristics: partially deforested sites in the Brazilian and Colombian Amazon; agroecosystems and forest remnants in the Colombian Andes; tea plantations and associated systems in China; or temperate forests in France (ibid.). The values thus calculated were compared to those obtained by applying the same method to local datasets. Highly significant correlations between the two sets of indicators supported the use of a single formula to evaluate a soil macroinvertebrate community regardless of the site. We can thus evaluate the quality of the macrofauna population with the formula:
| \begin {eqnarray*} \text {I macrofauna} = 0.014* \mathop {(}19.2*\mathrm {EWM} + 17.5*\mathrm {ANT} +\, 20.9*\mathrm {TER} + 9.8*\mathrm {BLA} + 20.4*\mathrm {COL} +\,17.5*\mathrm {ARAC} + 20.1*\mathrm {DIPLO} +\,21.8*\mathrm {CHILO} + 13.5*\mathrm {HEMI} +\,8.9*\mathrm {DERMA} + 15.5*\mathrm {LEPI} +\,16.7*\mathrm {GAST} + 21.9*\mathrm {OTR} +\,31.8*\mathrm {DEN} + 31.8*\mathrm {RT} \mathop {)}+0.1, \end {eqnarray*} |
The indicator varied greatly between and within plant cover types (Figure 5). Tropical environments had the highest values, between 0.61 ± 0.16 and 0.55 ± 0.12 in natural forests and savannas respectively, and 0.51 ± 0.19, 0.49 ± 0.15 and 0.48 ± 0.14 in tree-related crops, pastures and non-tree crops, respectively. Temperate soils had their highest values in grasslands (0.38 ± 0.14) and forests (0.35 ± 0.14), and lower values in bush and dry forests (0.3 ± 0.14) and annual crops (0.31 ± 0.13). However, beyond these significant differences among means, variability within groups is very high, and minimum and maximum values in each group are rather close, since local conditions and management options have high impacts.
Variations of the global indicator of soil macroinvertebrate communities in tropical and temperate regions, as a function of plant cover (source Macrofauna database, https://datadryad.org/downloads/file_stream/1355027). Blocks with a different letter are different at p < 0.05.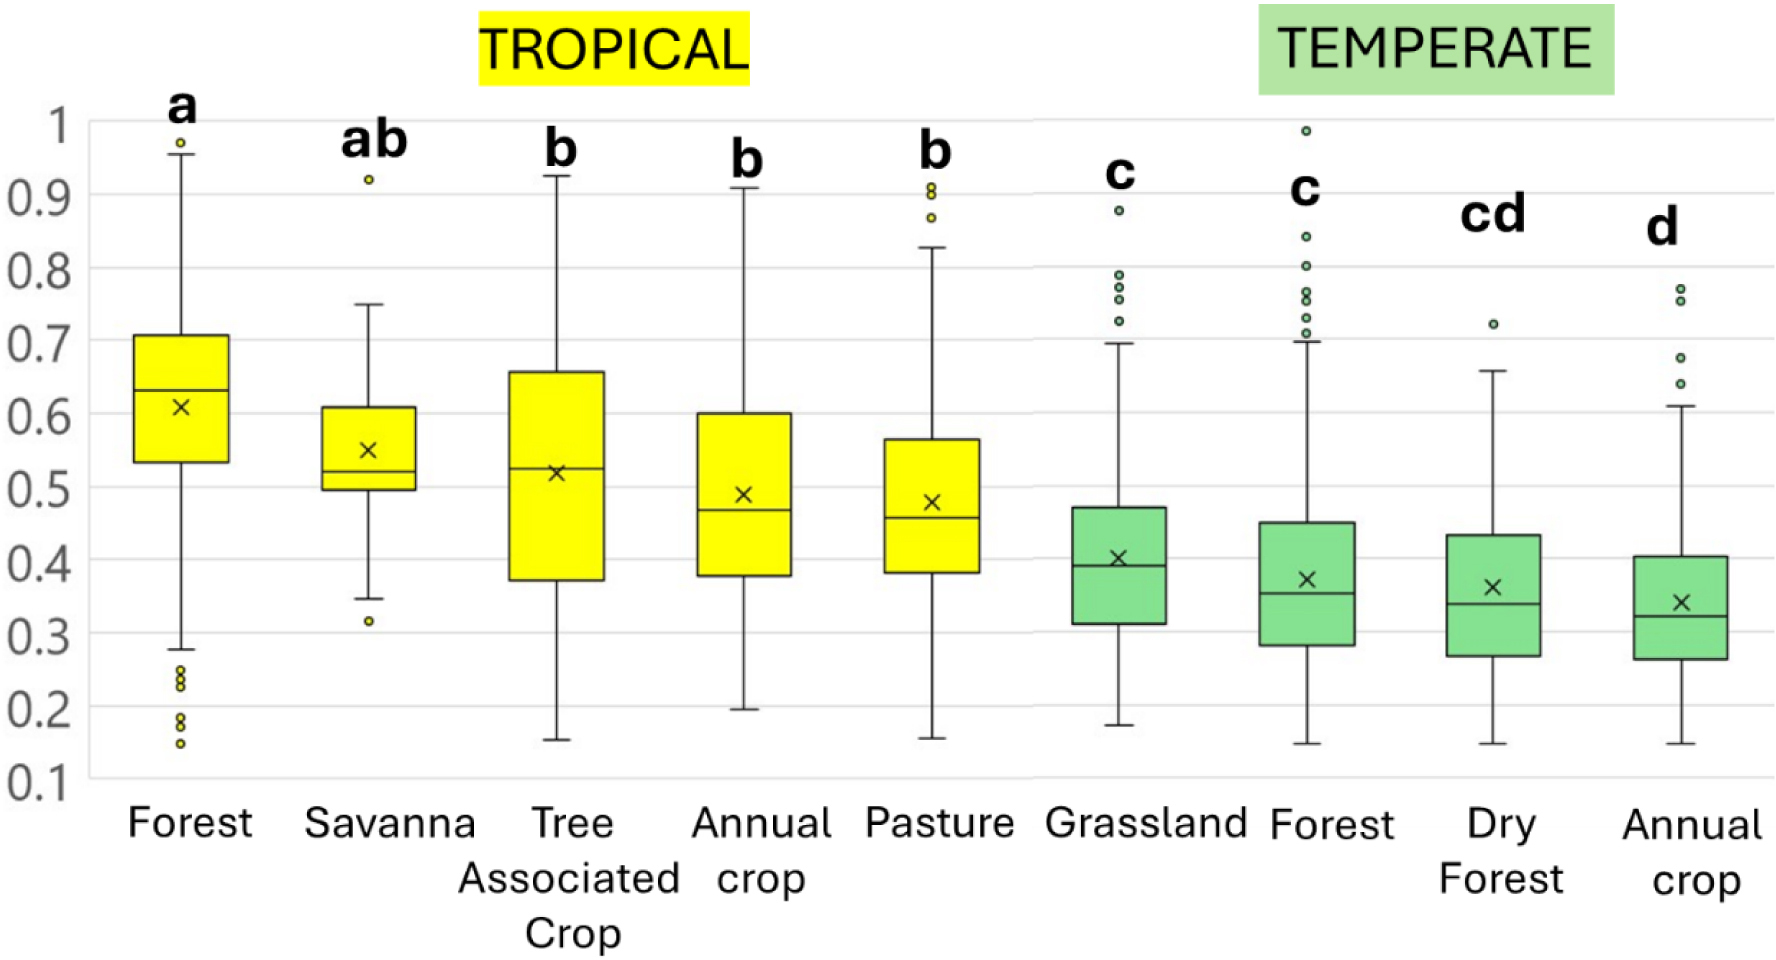
4. Conclusion
Macroinvertebrate communities are at the heart of soil processes for their globally mutualistic interaction with the microflora and their powerful physical, biochemical and community engineering effects (Lavelle, Spain, et al., 2016). They have the particularity of being divided into 15 main groups, potentially present everywhere except termites, and which perform similar functions although represented by families, genera and species that are sometimes very distant taxonomically.
The relatively limited number of these taxonomic units means that most field operators recognize them and can name them. Farmers’ workshops conducted in the Amazonian regions confirmed this knowledge.
In all sites where the link between this indicator and indicators of soil ecosystem services was jointly measured, very high correlations were noted (Velasquez and Lavelle, 2019). The global indicator proposed in this study is thus a first-rate tool available to populations far from laboratories. They will be able to use it to assess the agroecological quality of their land. In addition, they will be able to compare plots subjected to various practices and measure any progress obtained from the adoption of more environmentally friendly practices. Payment policies for ecosystem services based on this tool for their evaluations will have the considerable advantage of allowing all producers, especially small producers, to value the positive externalities of practices that respect soils and their biodiversity.
To achieve this objective, a few more steps are necessary. Firstly, producing a practical guide and making the tool easier by automating the calculations with a smartphone application will facilitate the operator’s work. Second, training offered by technical assistance institutions will allow, if necessary, to issue a diploma attesting to a correct mastery of the tool. Third, on the public policy side, additional knowledge is needed to calibrate the progress measured with the indicator and assess associated properties such as increased infiltration and water storage or carbon storage in the soil.
Declaration of interests
The author does not work for, advise, own shares in, or receive funds from any organization that could benefit from this article, and has declared no affiliations other than their research organization.