1 Introduction
The biological study of the European eel (Anguilla anguilla) is interesting in the framework of the marine water, lakes and freshwater. The European eel is original due to its life cycle; it has a marine stage, a transition period between the sea and the continent and a continental stage. Eels are also interesting because they are exploited at all stages of their development, and due to their presence in a wide geography, from Morocco to Norway through the western coast of Europe.
In the set of the European countries, a global diminution of the hunting of elvers is being noticed. The studies by Moriarty [1] and Dekker [2] brought attention over the important decay of captures in the last 20 years. It is still not known if the constant diminution in captures is a result of an overexploitation of the species or a consequence of an environmental degradation. An evaluation of this resource and its physical, biological and economic environment is required.
This paper focuses on the Adour River basin because it suffers the same tendency and the fishery of elvers constitutes the basis for the economy of local professional fishermen; thus, it is necessary to study, understand and quantify the migratory flux, in order to define a sustainable exploitation rate and to design an adequate resource-management strategy.
Besides, the Adour River is considered excellent for experimentation, a privileged place of study and a benchmark whose results can be translated to many other rivers, due to the features it presents: it is a fluvial system with several tributaries, of considerable length, and with diversity of landscapes; in the zone before the estuary, where the fishing activity concentrates, the Adour River benefits from an environmental variability, both in terms of current dynamics (very strong tide effects) and also in terms of turbidity properties and light penetration.
Some central questions are the mechanism of elvers migration, their progression upstream (by taking advantage of the flood tide), and their continuous displacement up and down the water column. The elver fishing is conditioned by these characteristics (of course, during the period when its abundance is enough to justify exploitation).
Several studies [3–22] have already described the entrance of elvers in the ‘Adour’ estuary and the migration phenomenon details. De Casamajor et al. [3–6] also evaluate the stocks of elvers in different years and seasons. These works have required an interdisciplinary collaboration of mathematicians, physicists, and biologists, as a consequence of the amount and different type of factors involved in eels evolution and modelling.
The studies by de Casamajor [3–6] focused on biological and physical aspects. Firstly, they carried out the identification of different groups of elvers by analyzing individual allometric features, size, weight, pigmentation and otoliths development. Secondly, they took measures of elvers density in the river banks and center, at different depths and several points of the estuary. Thirdly, they related the vertical and horizontal movements with hydrodynamic conditions. According to these studies, elvers movements are mainly affected by the moon phase, the tide coefficient (also influenced by the moon), the water turbidity and river flow. In this paper, we base on these results to build our model.
Pardo et al. [7] developed a time-dependent two-dimensional linear partial differential equation (PDE) satisfied by the density of elvers in the river. It includes vertical and horizontal transport and diffusion. This model takes into account the variation of the density under the influence of currents, light and turbidity. The model is formed by three groups of equations:
- (a) equations of the water flow (Euler and continuity equations);
- (b) equation of turbidity;
- (c) equation of elvers density. This equation describes the variation of elvers density with time taking into account the horizontal and vertical motion.
The works by de Casamajor et al. [3–6] and Pardo et al. [7] are complementary and have given many answers. However, some questions remain: how do individual elvers choose the depth they will swim at? Is there any gathering of the elvers in the vertical of the same point of the river bottom? In that case, what produces this gathering? Can we derive (and analyse) a PDE description from the individual rules? These questions are interesting to improve our knowledge about the eel life cycle, and this knowledge is necessary to optimize the strategy of exploitation of the eel, our principal objective.
In this paper we only study one stage of the eel evolution, its migration upstream the river. We do not focus on previous (or later) life history, but only take into account those facts relevant for the stage considered.
To this end, we build an individual-based model (IBM) to describe the elvers phenomena during their migration in the Adour River. The individual-based approach [17–20] can add valuable information: we choose it as we want to investigate the effects of individual variability in the global pattern and, for this purpose, individual-based techniques may help. The relationship between individual level (Lagrangian approach) and population level (Eulerian approach) is a classical question whose solution has only been achieved in particular cases. We are specifically interested in studying the emergence of large-scale properties (such as gathering, diffusion, rate of horizontal advance over the river bottom), from individual behaviours and attributes. In conclusion, the IBM provides us a new virtual laboratory to test the influence of individual parameters/behaviour in the global landscape; this laboratory can answer the questions posed above, still without explanation. Another advantage of the IBM approach is the ease to calibrate the model parameters by comparing the global results to the field data; this calibration would be more difficult (if possible at all) in the PDE approach.
The paper is structured as follows: in Section 2 we give the biological facts which describe the elver motion and the hydrodynamic characteristics of the Adour River. In Section 3 we present two IBMs for elvers motion inside the river. In Section 4 we discuss the results. In Section 5 we summarize the conclusions and give ideas for future work.
2 Some details on elvers life cycle in the Adour River
2.1 The Adour River
The Adour River enters the Atlantic Ocean at North latitude West longitude. The river has a depth between 5 and 12 m. The mountain range of the Pyrenees induces a high rain rate, allowing ‘Adour’ to have a sustained flow during the year. This flow oscillates between 116 m3/s in July–October and 393 m3/s in November–March [6]. The temperature of the water varies between 3–9 °C in winter and 23 °C in summer.
The ‘Adour’ estuary is affected by the dynamic tide and the saline tide. The dynamic tide plays an important role in the ‘Adour’ estuary dynamics, for the action of currents and the mixing and diffusion phenomena of marine water and freshwater.
The dynamic tide has appreciable influence up to approximately 70 km and is able to reverse the Adour current even up to 40 km away from the shore [23]. It is noticed by a water supply to the river during the flood tide. Its propagation inside the estuary is affected by the friction with the river bed, the section narrowing and decay of depth towards the river birth, and the reflection of the wave on the river banks.
The tide is of semi-diurnal type with a period about 12 h 25 m. Every tide is distinguished by a coefficient, between 20 (weak tide) and 120 (strong tide). These coefficients are related to the moon phase: high in new and full moon, weak in first and last quarters. The highest tide amplitude is about 3.80 m in the mouth and 1.90 m at 37 km away from it. The reference level corresponds to the zero level of marine charts, defined as the lowest tide level. The average level of water is 2.47 m respect to the zero level.
The river speed (which attains values of the order of 1 m/s) depends on two variables, the tide coefficient and the river flow. If the river flow is small and the tide coefficient is high enough, a rise of the water level is produced, and, what is more important, the river current reverses its direction, flowing from the mouth to the birth. A dynamic tide front appears where the tide and river flow effects cancel each other. The point of sign reversal of the river current does not coincide with the point of reversal of the water level (the one that supplies the official tide time).
In the same way, a front of marine water appears in the frontier between incoming salty water and river freshwater. The salinity at every point depends on the tide phase (maximum immediately after flood tide, minimum immediately after ebb tide), also on the tide coefficient (greater with higher values) and on the specific year (depending on the volume of freshwater introduced). The salty water reaches points up to 22 km away from the estuary in summertime.
2.2 The eels life
The European eel (Anguilla anguilla) is a catadromous organism, i.e., it migrates from freshwater to the sea to spawn. Eels eggs are laid at Sargasso Sea. After birth, eels migrate to the African and European coasts, by using the Gulf Stream. This migration takes between 250 and 500 days (the exact duration is not yet confirmed). During this stage, the larvae feed to accumulate an energy stock they will need in their future metamorphosis.
The leptocephalus larva contains physiological liquid of density similar to marine water's (more dense than freshwater). Furthermore, the organs are not yet ready to survive in freshwater. When they arrive to the continental shelf, they start to lose the salt contained in their bodies through a slow osmoregulation process, in order to acquire a density closer to freshwater's.
In the continental shelf and estuary, the larvae suffer a metamorphosis into elvers. Since this moment, there is no feeding and the alimentary canal starts to be closed. Thus, the size and weight of elvers will diminish all along their migration to the river birth.
The development of very sensitive olfactory cells allows the detection of waters containing mud and pheromones segregated by adult eels. These substances guide elvers in their journey.
As elvers do not feed, an energy-saving method is required for the migration upstream the river. Elvers must move nearly without energy consumption; for that, elvers take advantage of the flood tide, letting themselves be drifted.
During this migration upstream, elvers acquire pigmentation. The final metamorphosis is triggered by a temperature threshold (9–12 °C). This metamorphosis consists of the opening of the alimentary canal and a development of the air bladder. Besides, at this stage their density is very similar to water's. The conjunction of all these changes makes eels acquire an active swimming, which helps them move even further. This is called the silver-eel stage, a small-scale replica of the adult eel.
Later, eels reach the sexual maturity, and travel back to Sargasso Sea where they lay the eggs. Eels are believed to die there, after the reproduction.
For more details see [24–32].
2.3 Experimental results. Factors of influence in elvers migration
We give below some details and conclusions of the studies by de Casamajor et al. [3–6]. The region studied was 20 km long, and the data were collected by 5 experimental stations. This study is important as long as it measured values through the whole water column. Before this work, all the available data came from the engines of the fishermen, which acted only near the surface. Now it is possible to develop a more complete description of the migration flux.
Data related to temperature, salinity, current speed, elvers density, water turbidity and cloudiness were taken. The measures were made under different flows and tide coefficients.
In the experiments, the light intensity proved to be a key factor of influence. Light intensity inside the water is modified by environmental factors such as moon phase, cloudiness and turbidity. Water turbidity attenuates the light penetration, making light intensity decrease exponentially with depth. This fact is specially important during full moon, first and last quarter, when light intensity is high. During new moon period, elvers spread all along the water column, whatever the turbidity. With full moon, and specially under weak turbidity, the ratio of elvers in the bottom increases. The rising of professional captures on surface is highly correlated to the new moon periods. It is important to notice that high river flows increase turbidity. Thus, flow modifies not only the river speed but water turbidity as well. It seems that all these factors play an important role on the distribution of the elvers in the water column, as we explain below.
2.3.1 Horizontal motion
In the horizontal component, the action of the tide coefficient and the river flow must be considered together.
The elvers intend to move upstream the river, starting from the river mouth. Thus, a low river current intensity will create adequate conditions for the migration of elvers. The migration is blocked at speeds round (the minus sign indicates unfavourable direction). When the river flux diminishes and the tide coefficient increases, the tide is again propagated inside the estuary and the flux of elvers penetrates it. At this precise moment, the highest densities of elvers are observed.
The difference of densities between the river banks and the center are not significant. The density of eels increases towards the river birth, because they accumulate in the limit of propagation of dynamic tide (as we already said, 40 km away the river mouth).
2.3.2 Vertical motion
In the vertical component, the behaviour of elvers was analysed by measuring densities in the river surface, bed and water column. The study of variation of densities in relation to environmental conditions helps us know the main factors influencing the displacement of elvers in the estuary. As we said before, the reduced swimming abilities (low energy consumption) and the negative phototaxis induce vertical displacements and influence the way the elvers migrate.
Turbidity favours the displacement through the whole water column, whatever the moon phase. Clear waters favour the displacement near the river bed, specially during full moon, waxing moon and waning moon. The presence of clouds also acts as a factor which reduces night luminosity.
When speed conditions are unfavourable and the horizontal migration is blocked, elvers move towards the river bed and penetrate the sediment, to be protected from the current drift. At this moment, two opposite phenomena appear: on the one hand, elvers tend to gather over the adequate places, i.e., non-overcrowded soil made of medium-size granules (neither very big nor very small granules are preferred); on the other hand, elvers experience a ‘repulsion’ from one another, avoiding in consequence high accumulations of themselves. Thus, a density-dependence effect arises. It seems [25] that these resting places are necessary for elvers migration.
When speed conditions become favourable again, elvers leave the sediment and return to the water column. The mechanism of return to the water column is not described in the literature, and it could be either simultaneous (every elver returning at the same time) or progressive (elvers returning gradually).
3 The IBM model
The use of IBMs has become very frequent in the last 20 years [33–35]. IBMs arose from a fusion of Artificial Intelligence, distributed systems, and many-particle systems. They are successful as they supply an intuitive tool to create a virtual world and to model the real one.
IBMs can be used as a complement to classical analysis methods, by providing a virtually unlimited testing tool; using an IBM, the computer keeps track of every individual and its attributes, and virtually any behaviour might be programmed, whatever its complexity.
When using IBMs, observation of emergent properties at the population-level (Eulerian approach), usually not obvious from the individual-level description (Lagrangian approach), is a key issue [36–40]. An IBM often shows certain kinds of self-organization, not explicitly programmed in the individual rules. Even in case the IBM shows no emergent properties, it allows to check the truthfulness of our intuitions.
In the bibliography we give references of some software platforms for IBM-building.
3.1 Description of the IBM
Lambert et al. [17–21] have developed a very complete IBM of eels migration in the Gironde estuary. Their IBM includes many eels attributes (mass, length, memory, an internal clock, etc.), eels behaviours, a sophisticated environment which reproduces the topology of the estuary and even a virtual laboratory to simulate the scientist (the observer). Our model is more simple, because our aim is to compare the IBM and the PDE approaches; we want to translate the IBM into a set of stochastic differential equations (see Conclusions and future work section). For that purpose, we were forced to keep the model simple, avoiding extra features of the eels (at least for the time being). Next, we explain the basics of our IBM.
We model the river as a vertical rectangle where represents the river length and represents the river depth; we assume the values , , , ; thus, we are not taking into account one dimension of the river (the width). We are neglecting the river irregularities in order to obtain a more simple model where the analysis is feasible. The slope of the river bed is not modelled explicitly, but this is not important as long as its main effect, i.e., the river speed, is taken into account separately in the model.
Every elver is simulated as a particle with coordinates inside, according to
Another elver attributes like size or weight are not important in this study, because we are only interested in the advance along the river. However, they can easily be added, and we plan to make our IBM more complex in future works.
In the simulation, the starting position of the elvers is near to the bottom-left corner of the rectangle , more precisely the position with and being a random variable uniformly distributed along . The reason why we choose this initial distribution is that we want to simulate the entrance of a compact group of elvers inside the estuary, and we want to observe the evolution of this group with the time (rate of advance, possible splitting of the group).
As stated in Section 2, we take into account two effects acting on elvers: the light and the tide. We model light intensity and tide speed as follows (see Fig. 1). The reason to choose waves is the periodic character of light intensity and tide. As long as we are interested in observing the effects of high and low values of these two factors in the global pattern, we assume the sinusoidal representation is precise and simple at the same time. In our model we assume the water turbidity is high enough to allow elvers migration during the day. We assume the turbidity is constant with the time and also has a constant value at every point of the river.

Light intensity is represented as a sinusoidal wave in a period of 24 h (negative values correspond to the night):
The tide is also considered as a sinusoidal wave in a period of 12.4 h (this value is the mean period of the tide cycle in the river ‘Adour’). Positive values correspond to flood tide and negative values to ebb tide.
We model TideAmplitude as a variable which takes the maximum value at the river mouth and decreases linearly with x. This model agrees with the experimental data of Section 2, because describes the weakening of the tide effect with the distance to the river mouth. We choose a linear decay for its simplicity.
Thus, the global horizontal speed at a point at any time t is the sum of two contributions:
We model the river speed as a linearly increasing function with a minimum value at the river mouth. Again, this model agrees with the experimental data, because the river speed is higher as we move towards the river birth.
We assume that every elver experiences two Brownian motions, one in the horizontal direction with diffusion coefficient and the other in the vertical direction with diffusion coefficient . These two Brownian motions take into account the individual variability. We assume that movements are nondeterministic because individual elvers seem to make random decisions.
These two Brownian motions only occur during the flood tide, because during the ebb tide the motion is directed towards the river bed.
The motion of every elver is based on the state diagram of Fig. 2. We consider a positive value LightThreshold as the light intensity above which elvers cannot swim and therefore descend to the river bed. The existence of this threshold agrees with the details explained in Section 2.

In the state diagram we can see that:
- – During flood tide and light intensity below LightThreshold the elver takes the advance state, in which the elver diffuses freely along the vertical and the horizontal line. The elver also advances by being dragged by the favorable water current.
- – During ebb tide or with the light intensity above LightThreshold, the elver takes the descent state, in which both vertical and horizontal diffusions are suppressed and the elver moves vertically towards the river bed with speed ( positive constants), and horizontally dragged by the HorizontalGlobalSpeed.
According to the philosophy of individual-based modelling, we include in our IBM as little complexity as needed (and not as much as possible), because this allows a better insight into the problem and an easier analytic treatment.
3.1.1 Slip in the river bed
According to the literature and Section 2, when elvers move towards the river bed they choose almost empty places rather than overcrowded ones. Here we build two models; only the second one takes into account this density dependence effect.
All the individual rules (‘intelligent’ tide-drifting, light-avoiding displacement, density-dependence) satisfy the experimental observations of de Casamajor [3–6].
3.2 Results
Our two IBMs describe the motion of elvers inside the French river ‘Adour’ taking into account the facts discussed in Section 2. In both of them we simulated a population of elvers, using a time step of 3 s, for 105 iterations. We wrote the algorithm in C programming language and displayed the results using Tecplot.
3.2.1 Version 1: density-independent transport
For every elver and at every time t we calculate the elver speed as follows.
- –
During the advance state the rules of motion are:
- –
During the descent state the rules of motion are:
In both states, the position is updated according to:
In the case z falls outside the rectangle , we redefine the value z inside it, using a mirror reflection at the boundary.Remark
In Figs. 3–8 we show some pictures of the IBM simulation.

Elvers stopped at the initial stage.

Elvers spreading through the water column.

Elvers in normal motion.

Ebb tide or high light intents. Elvers move to the river bed.

Elvers stopped on the river bed waiting for a new flood tide.

The new flood tide comes. Elvers return to the water column.
3.2.2 Version 2: density-dependent transport
As we mentioned before, elvers search for a non-overcrowded place to stay on the river bed. Now we take into account this fact, including therefore a density dependence effect.
We divide the water column into two areas (see Fig. 9):
- – The zone above , where no competition occurs, and the behaviour is the same as in the linear version.
- – The zone below , where elvers avoid overcrowded zones, according to a function proportional to a power of the density.

The choice of is arbitrary in these simulations, but we think is a good approximation in real cases.Remark
For every elver k and every time t we compute the elver speed as follows:
- – During the advance state the rules of motion are:
- – During the descent state the rules of motion are:
- • In the zone above :
- • In the zone below , an individual chooses an empty place as follows: elvers have a perception limited by horizontally and vertically (N being the number of elvers, positive constants). Hence, the kth elver, at position , can only perceive the elvers inside the rectangle
For each , let be the number of elvers perceived by individual k on its right, i.e., inside the rectangle
For each , let be the number of elvers perceived by individual k on its left, i.e., inside the rectangle
- • In the zone above :
The kth elver moves to the less crowded rectangle, avoiding high densities. For that, the kth elver computes a value this way:
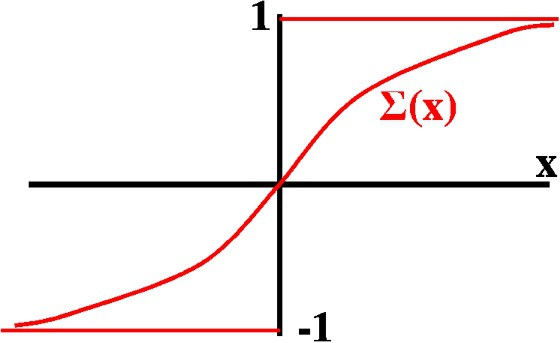
According to this, we obtain the formulas
Finally, in both states the position is updated according to:
Again, in the case z falls outside the domain, we redefine the value z inside the rectangle, using a mirror reflection in the boundary.Remark
Next we show some pictures of the IBM simulation (see Figs. 10–18).

Elvers stopped at the initial stage.
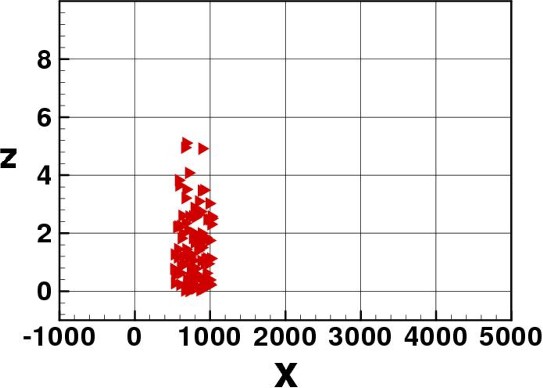
Elvers spreading through the water column.
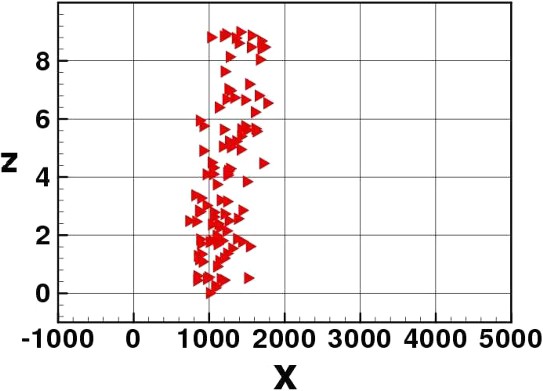
Elvers in normal motion.
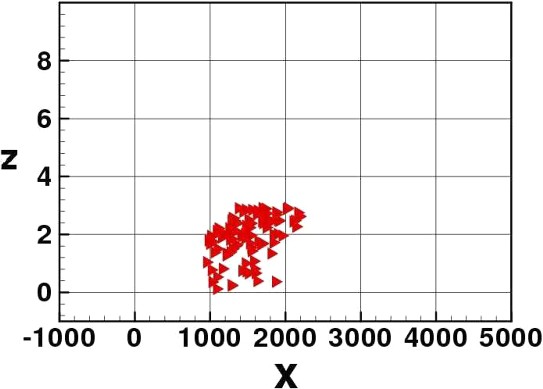
Ebb tide or high light intents. Elvers move to the river bed.
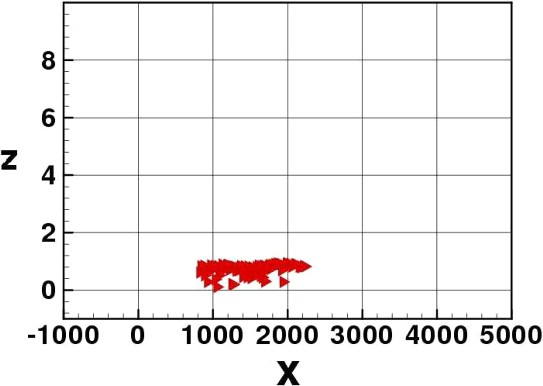
Density dependence: elvers spread horizontally.
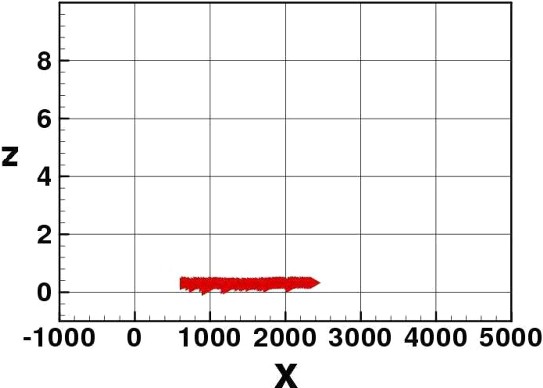
Still density dependence: elvers spread horizontally more.

Elvers stopped on the river bed waiting for a new flood tide.
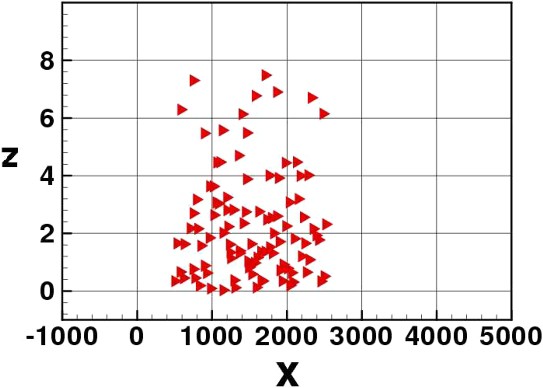
Elvers return to the water column.
4 Discussion
The two IBMs confirm the effectiveness of the tide-drifting strategy to migrate towards the river birth. Elvers advance upstream the river in subsequent ‘tidal waves’, always protecting themselves from the drift during ebb tide by penetrating the river sediment. The production of a wider distribution of the group in the density-dependent version is visible. This wider distribution appears near the river bottom.
It is important to notice that we lacked of empirical data to build our model; the only information we had was qualitative. Nonetheless, our model is able to reproduce real patterns. This suggests that the phenomenon is governed by the information on the qualitative behaviour that is robust regarding the changes in the data.
The evolution of elvers in the density-dependent IBM is identical to the evolution in the real case, according to the experimental results (de Casamajor [3–6]). The density-independent IBM is used as a first and more simple approximation to reality.
By running the IBMs a sufficient number of time steps, we can observe a point of accumulation of elvers where the effect of the dynamic tide is very weak. This also happens in the real case.
In both IBM versions we observe that the group of elvers does not break up into several ones. This feature is also observed in the real case: groups of elvers which entered the estuary at different days may gather days later. This is explained as a consequence of the way tide works: the elvers ahead of the group feel the decay of the tide before the rest, therefore they stop advancing sooner. This effect tends to keep the elvers together. This result was expected in the density-independent version; however, it was not expected in the density-dependent one. In the latter version, this result is more surprising, as long as the non-overcrowding repulsion tends to split the elvers group. According to Ronald et al. [40] test, this may constitute an emergent property. We believe that, by increasing the repulsion intensity sufficiently, the group of elvers could split after some time steps.
5 Conclusions and future work
The exploitation of the European eel constitutes the basis of the economy of fishermen located in the Adour River basin. This exploitation has suffered a decay for the last twenty years. As a consequence of this decay, it is more and more difficult to develop adequate samplings of elvers migratory flux. It is necessary to design and develop a better exploitation strategy, which should include all the stages of eels development and not only the continental stage. For that purpose, we must know as many details as possible about eels' life cycle. In this paper, we present two IBMs which contribute to a better understanding of the phase of migration upstream the Adour River. These two IBMs are useful because we can address questions to them by modifying the parameter values and/or the behaviour patterns, and obtain the answers by watching the population-level results. These two IBMs provide us a virtual laboratory.
Besides, the IBM approach constitutes a mathematical description which can be translated to stochastic differential equations and partial differential equations, allowing further insight of the model with all the classical analysis tools. As future work (to be published elsewhere), we will write these stochastic differential equations which describe the same phenomenon as the IBM. Next, we will derive the partial differential equation (PDE) description. We will solve numerically this PDE and make quantitative/qualitative comparisons of both results: we will carry out statistical contrasts of the empirical distribution of the IBM with the density distribution given by the PDE. Also, we will study analytically the existence and uniqueness of solution of the Cauchy problem corresponding to the PDE with suitable conditions. This set of steps constitutes a validation of our IBM and, furthermore, a general method of validation of IBMs in general. This seems promising due to the increasing importance of IBMs in Ecology and Social Sciences and the lack of a serious foundation of the IBM approach.
Acknowledgments
I want to specially thank Ovide Arino, Eva Sánchez, Luis Casasús and Rafael Bravo for their help, revisions and support. I also want to thank all the people who have taken and provided experimental information.
Appendix A
Some software platforms oriented to IBM-building:
- – ModelMaker (http://www.modelmaker.demon.nl/mm.htm).
- – Swarm (http://www.swarm.org/).
- – Cormas (http://cormas.cirad.fr/indexeng.htm).
- – Gecko (http://www.cbc.yale.edu/old/cce/gecko.html).
- – EcoSim (http://www.offis.uni-oldenburg.de/projekte/ig/ecotools/).
- – MODSIM (http://mssanz.org.au/modsim03/modsim2003.html).
- – BACSIM (http://www.theobio.uni-bonn.de/people/jan_kreft/bacsim.html).
- – IBMs in general: http://www.red3d.com/cwr/ibm.html.


