

1 Introduction
Intracerebral gliomas are the most frequent primary brain tumors. WHO grade II gliomas although considered “low grade” inexorably evolve into anaplastic transformation with a very poor prognosis. However, delays of this anaplastic transformation are highly variable from one patient to another. In addition, the overall survival may be increased by appropriate therapeutic attitude towards this potential evolution [1]. It is therefore crucial to explore the evolution of these tumors to propose an appropriate management for each patient.
The magnetic resonance spectroscopy (1H MRS and 31P) allows noninvasive monitoring of changes in these tumors, measuring concentrations of metabolites such as glucose, creatine, lactate (1H MRS), ATP and phosphocreatine (31P MRS) or intracellular pH (31P MRS). It is complemented by the measurement of regional cerebral blood flow (rCBF), as calculated from related cerebral blood volume (rCBV) by magnetic resonance imaging (MRI) perfusion. The validity and robustness of the tools used have been demonstrated [2,3]. In contrast, metabolic and hemodynamic changes, involved in the anaplastic transformation, have so far not been a conceptual approach.
To better understand the pathophysiological mechanisms involved, we developed a mathematical model, consisting of a system of nonlinear ordinary differential equations. This model, based on existing physiological models [4,5], includes the major variables measured by MRS and perfusion MRI. This model takes into account the high variability of regional blood flow and lactate measured which were difficult to explain coherently. In particular, it did not seem obvious that lactate, which we demonstrated as an early marker of metabolic changes of tumor evolution [2], has very different values, and sometimes non-monotonic evolution. Taking into account intracellular pH and rCBF by the model of lactate, allows us to have a mathematic simulation of the high dispersion of results obtained from MRS and perfusion MRI with neither recourse to the hypothesis of capillary recruiting highly unlikely in WHO grade II gliomas, nor to the capillary proliferation excluded at this stage. This indicates the importance of studying more thoroughly the transport of lactate across the blood-brain barrier and the membranes of tumor cells.
Overall, the model allows a mathematic simulation of pathophysiological mechanisms as part of a subdivision of the tumors we used as a working tool. This provides important perspectives for understanding the pathogenesis of gliomas, which is complex.
Finally, beyond the limits of the model and the short-term outlook for refining the modeling of brain tumor metabolism directly related to the introduction of new techniques of MRS, we discuss possible links between modeling and individualized monitoring of patients with LGG.
2 Method
2.1 Patient and method
2.1.1 Patients
This was a prospective study over a period of seven months (January 2009–June 2009) for the recruitment of patients with glioma of supratentorial hemispheric, low grade.
2.1.2 Inclusion criteria
The inclusion crtiteria were:
- • patient with glioma grade II histologically proven (biopsy or surgery);
- • no cancer or steroid treatment before imaging.
2.1.3 Exclusion criteria
The exclusion crtiteria were:
- • age less than 8 years;
- • chemotherapy, radiotherapy or surgery before inclusion;
- • glioma grade other than grade II;
- • contra-indications for MRI.
2.2 Image analysis
All patients had a magnetic resonance examination using the same protocol from a Signa HDX 3Tesla imager (GE Healthcare, Milwaukee, WI, USA). The conventional anatomical imaging sequence included a coronal FSE sequence T2-weighted (TR/TE = 3650/85, 240 mm FOV, 320 × 320 matrix), axial FLAIR sequence T2-weighted (TR/TE / TI = 10,000/160/2200 ms, 250 mm FOV, 256 × 192 matrix), a volume FSPGR IR T1-weighted before injection (fast spoiled gradient recalled sequence IR FSPGR, TR/TE = 6.3/2.8 ms, 10 flip angle, 280 mm FOV, 256 × 256 matrix), axial FSE sequence T1-weighted post-gadolinium (TR/TE = 500/20, 240 mm FOV, 512 × 256 matrix) and coronal FSE sequence T1-weighted post-gadolinium (TR/TE = 500/20, 240 mm FOV, 512 × 224 matrix).
Multinuclear MRS requires an additional RF channel adapted to each frequency nuclei studied (w31P = 17.2 MHz/T, W1H = 42.6 MHz/T) and a dual cor proton-phosphorus. In this study, multinuclear MRS was performed using a Dual Quad antenna 1H/31P (General Electric Healthcare, Milwaukee, Wisconsin, USA) and an amplifier chain phosphorus. All SRM acquisitions were performed before injection of gadolinium from the same PRESS sequence (Point Resolved Single voxel Spectroscopy) for 1H MRS with a TR 1500 ms, two different TE 35 and 144 ms, and 128 scans. For 31P MRS, FID sequence with TR 4000 ms, TE < ms, and 184 scans were performed. Anatomically axial FLAIR T2 sequence was used to position the voxel for MRS 1H and 31P. For 1H MRS, five voxels were positioned, each of 3 to 8 cm3 (depending on the size of the lesion): (1) in the center of the tumor; (2) peritumoral; (3) border tumor/“healthy” parenchyma; (4) ipsi lateral “healthy” parenchyma; and (5) contralateral “healthy” parenchyma. For each tumor, only the 1H spectrum with the most pejorative parameters such as an increase of ratio Choline/NAA and the presence of resonances of lactate and free lipids were used for analysis. Thus, the voxel for MRS acquisition 31P was positioned on the same location as the voxel 1H with the most pejorative settings and on the contralateral “healthy” parenchyma. All spectroscopic data have been processed with the Spectral Analysis General Electric software (SAGE). For accurate quantification, Cr resonance from the contralateral side was used as reference. Free lipids (0.9 and 1.3 ppm) were assessed at short echo time and lactate (1.33 ppm) at long echo time. Intracellular pHi was calculated from the gap between PCr phosphocreatine and inorganic phosphate Pi-resonances [6].
Dynamic contrast agent-enhanced T2*-weighted gradient-echo echoplanar images (TR/TE = 500/54, 40 sections with a section thickness of 5 mm, FOV of 240 mm, matrix of 128 × 128 and flip angle of 30) were acquired during the first pass of a standard dose (0.1 mmol/Kg) bolus of gadoteric acid (Dotarem, Guerbet, France). Data processing was performed by using the functool software under Advantage Window. ROIs were targeted in the most pejorative location determined from the rCBV color map. Care was taken to avoid the averaging of volume with blood vessels and to minimize confounding factors in analysis of rCBV. The size of ROIs was kept constant. The measurements of rCVB were made by a neuroradiologist experienced with perfusion technique data acquisition at our institution. Then, the position of maximum rCBV ROI was compared to that of the voxel showing the most significant spectral changes.
2.3 Model description
The model is based on models of brain energy metabolism previously developed by one of us and colleagues [4,5]. The two state variables of the model of Aubert et al. [5] were the intracapillary and extracellular (interstitial) concentrations of lactate. Our approach is similar, but the state variables of our model are the intracapillary and intracellular concentrations of lactate (LACc and LACi, respectively; concentration of species X is written X rather than [X]). Furthermore, our model takes into account the following parameters and variables (Fig. 1): (i) the cellular production of lactate due to glycolysis, J1; (ii) the flow of lactate transport from cells towards capillaries, J2; (iii) a flow referred to as J3, namely the sum of the consumption of lactate by mitochondria, via its transformation to pyruvate catalyzed by lactate dehydrogenase (LDH), and diffusion of lactate from the ROI towards neighboring regions, via gap-junctions [7] or via the interstitial milieu; (iv) cerebral blood flow (CBF); and (v) intracellular pH, (). Concentrations of lactate and H+ are expressed in mM and M, respectively. The volumes and flows are expressed per unit tissue volume: Vc and Vi are respectively the dimensionless capillary and intracellular volume fractions; similarly, CBF is expressed in s−1. Lactate flows are expressed in mM s−1.
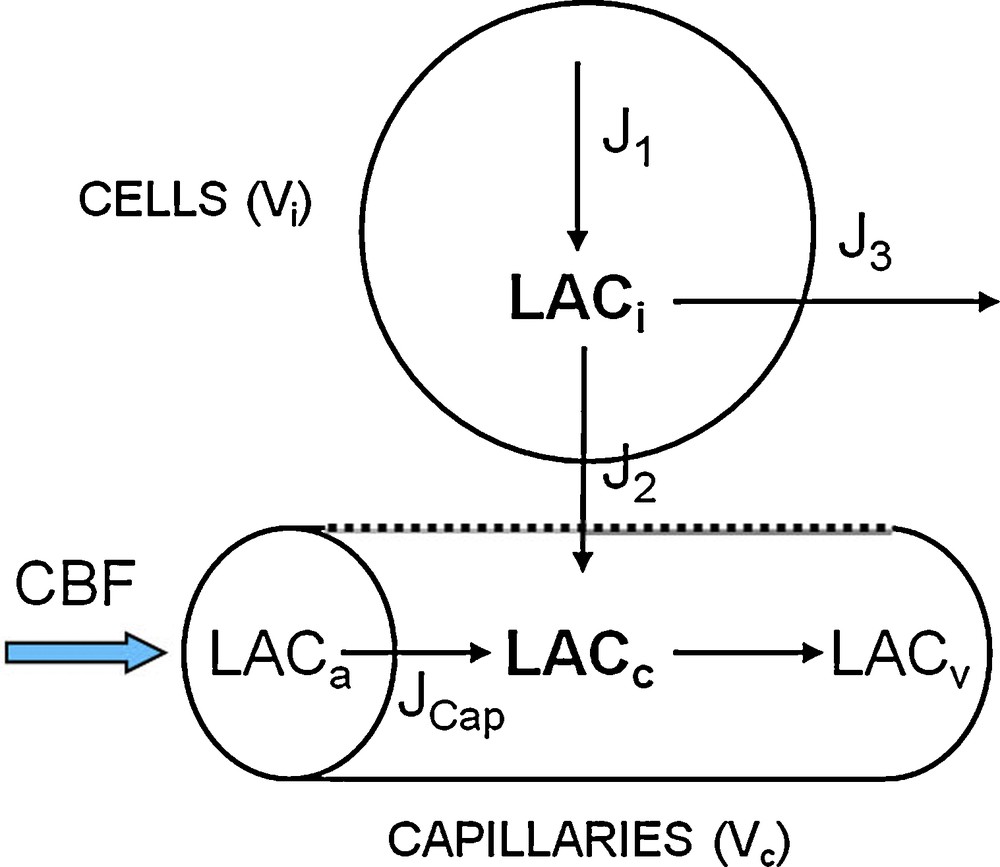
Description of the mathematical model.
The metabolic balance equations of intracellular and intracapillary lactate leads to the following system of differential equations:
| (1) |
| (2) |
| (3) |
We took into account the effects of intracellular and intracapillary concentrations of H+ on the transport of lactate by setting:
| (4) |
KH is a parameter expressed in mM × M, T is the maximum rate of transport. It must be emphasized that T depends both on the total area of capillary endothelium and the density of lactate-proton cotransport proteins, namely monocarboxylate transporters (MCTs). Formula (4) was obtained from a more general formula for cotransport [8]. The intracellular concentration of protons was measured using 31P MRS, while the intracapillary concentration of protons is considered as constant. In the following, we define the variable LACH as being the product .
The contribution of CBF to the change of LACc is given by balance equation:
| (5) |
LACa and LACv are the arterial and venous concentrations of lactate, respectively. Based on previous model [5], we obtain:
| (6) |
A similar equation was proposed by Gjedde for oxygen [9]. It follows from the simple assumption . We have shown that this simple formulation is nearly equivalent to much more complex approaches, based on partial differential equations [10].
In summary, the system of ordinary differential equations describing the system is written as follows:
| (7) |
The values of Vi, Vc, , LACa and are provided by the literature (for a discussion: [4,5,9,10]). Data from MRI and MRS provide LACi, and CBF. However, it is much more difficult to assign values to J and T, which is the major reason for using a model.
3 Results
3.1 MRI results
Fifteen patients with grade II WHO gliomas, were included in this study, seven (43.7%) males and eight (56.3%) females. Six patients had oligodendrogliomas, five astrocytomas and four mixed gliomas. All settings MRS and perfusion are summarized in Table 1.
Results of 1H MRS, 31P MRS and perfusion MRI, for the 15 patients studied.
| Patient | Cho/cr | Cho/NAA | Lact/cr | Lip/cr | PME/PDE | pHi | rCBV | rCBF | Class |
| 1 | 1.98 | 1.77 | 0.38 | 0.8 | 1.69 | 7.09 | 2 | 3.27 | 3 |
| 2 | 0.84 | 1.75 | 0.96 | - | 1.52 | 7.01 | 0.89 | 1.7 | 1 |
| 3 | 2.93 | 5.87 | 0.96 | 2.9 | 2.25 | 7.11 | 2.47 | 0.87 | 3 |
| 4 | 4.19 | 6.99 | 1.85 | 0.56 | 1.87 | 7.09 | 2.17 | 1.56 | 3 |
| 5 | 2.87 | 5.13 | 0.76 | 1.25 | 1.26 | 6.99 | 1.58 | 3.73 | 2 |
| 6 | 1.08 | 1.89 | 0.61 | 1.4 | 1.11 | 7.01 | 1.46 | 1.73 | 2 |
| 7 | 1.85 | 11.58 | 1.5 | - | 1.25 | 6.98 | 0.36 | 0.31 | 1 |
| 8 | 1.55 | 0.83 | 1.41 | - | 0.98 | 7 | 0.56 | 0.74 | 1 |
| 9 | 2.55 | 2.55 | 1.37 | - | 1.16 | 6.98 | 0.36 | 0.29 | 1 |
| 10 | 3 | 4.62 | 1.28 | - | 1.48 | 6.97 | 1.03 | 0.68 | 1 |
| 11 | 1.14 | 1.78 | 0.54 | 1.95 | 0.87 | 6.98 | 1.23 | 0.94 | 2 |
| 12 | 2.89 | 1.72 | 4.22 | 3.32 | 1.51 | 7.1 | 1.73 | 2.51 | 3 |
| 13 | 2.28 | 3.55 | 2.47 | 3.28 | 1.72 | 7.1 | 1.85 | 2.16 | 3 |
| 14 | 4.79 | 4.6 | 7.53 | 1.07 | 2.15 | 7.08 | 2.19 | 4.25 | 3 |
| 15 | 2.23 | 1.54 | 1.16 | - | 1.24 | 7.02 | 1.07 | 1.28 | 1 |
The analysis of the data summarized in Table 1, shows three homogeneous subgroups corresponding to the three spectral groups detailed in the study of Guillevin et al. [2]:
- • Class 1: six patients had a marked increase of the ratio PME/PDE due to an increase of PME (PDE were stable), an increase of the ratio Cho/Cr, a stable pHi, a resonance of lactate and an increase of rCBV which remained less than 1.7 (Fig. 2);
- • Class 2: three patients had a stable ratio of PME/PDE due to a both increase of PME and PDE, a stable ratio of Cho/Cr, a resonance of free lipids, a stable pHi, an inconstant resonance of lactate, and an increase of rCBV, which remained still less than 1.7 (Fig. 3);
- • Class 3: six patients had an increase of the ratio PME/PDE due to an increase of PME more than the increase of PDE, an increase of ratio Cho/Cr, a resonance of free lipids associated to a resonance of lactate and an increase of pHi (Fig. 4).
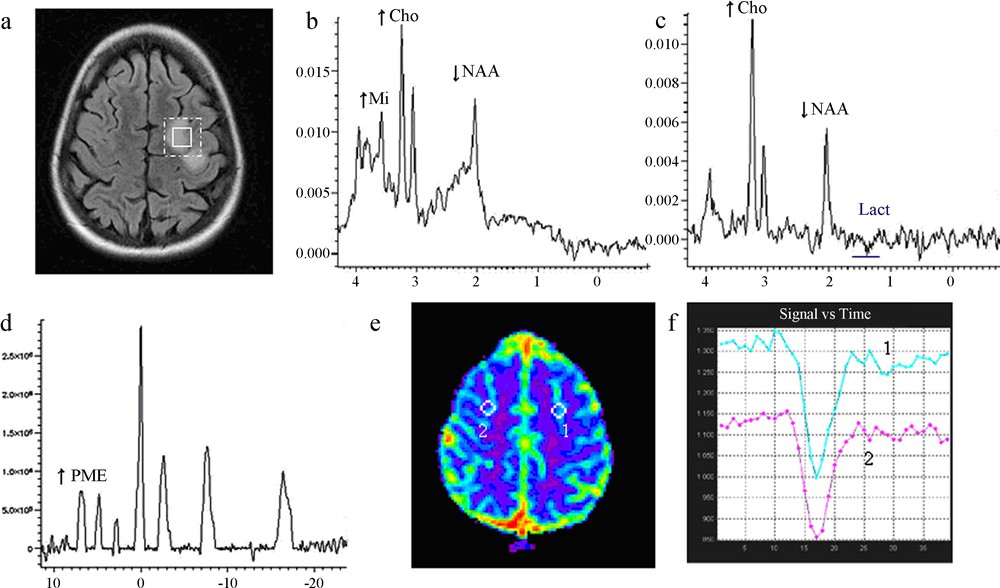
Imaging of low-grade glioma Class 1.
(a) Location of proton voxel and phosphorus voxel on the left frontoparietal lesion, T2 FLAIR sequence.
(b) 1H MRS short TE showing an increase of choline and a decrease of NAA.
(c) 1H MRS long TE showing discrete onset of lactate.
(d) 31P MRS, an increase of PMEs, deltaPi = 4.79, pHi = 6.98.
(e) Perfusion MRI, a mapping of cerebral blood volume (rCBV), and
(f) Perfusion MRI, first pass curves: hypoperfusion with rCBV = 0.8.
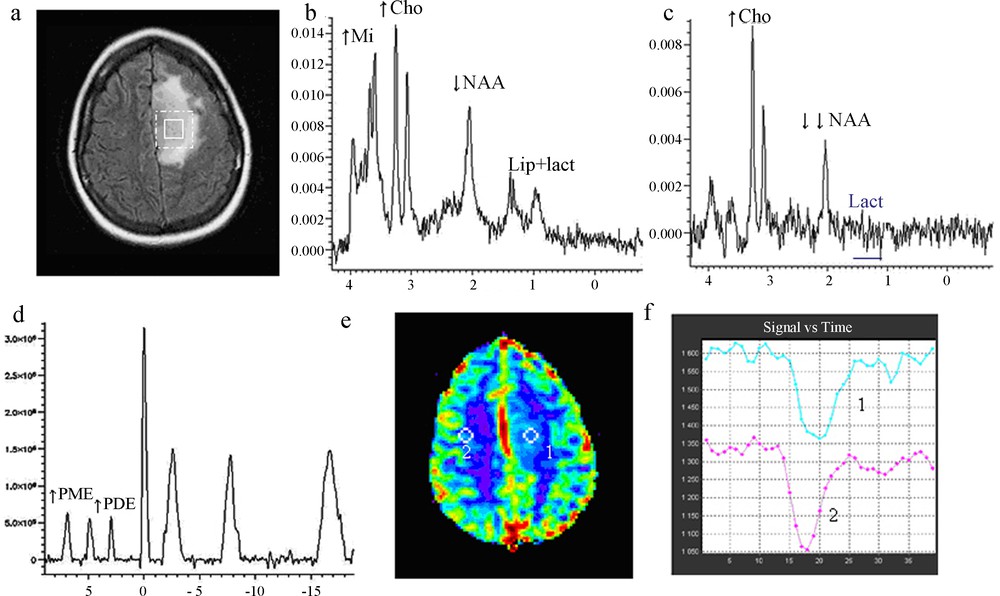
Imaging of low-grade glioma, Class 2.
(a) Location of proton voxel and phosphorus voxel on the left frontoparietal lesion, T2 FLAIR sequence.
(b) 1H MRS short TE showing an increase of choline, a decrease of NAA and presence of lipid/lactate.
(c) 1H MRS long TE, presence of lactate.
(d) 31P MRS, an increase of PMEs, deltaPi = 4.81, pHi = 6.99.
(e) Perfusion MRI, a mapping of cerebral blood volume (rCBV), and
(f) Perfusion MRI, first pass curves: hypoperfusion with rCBV = 1.2.
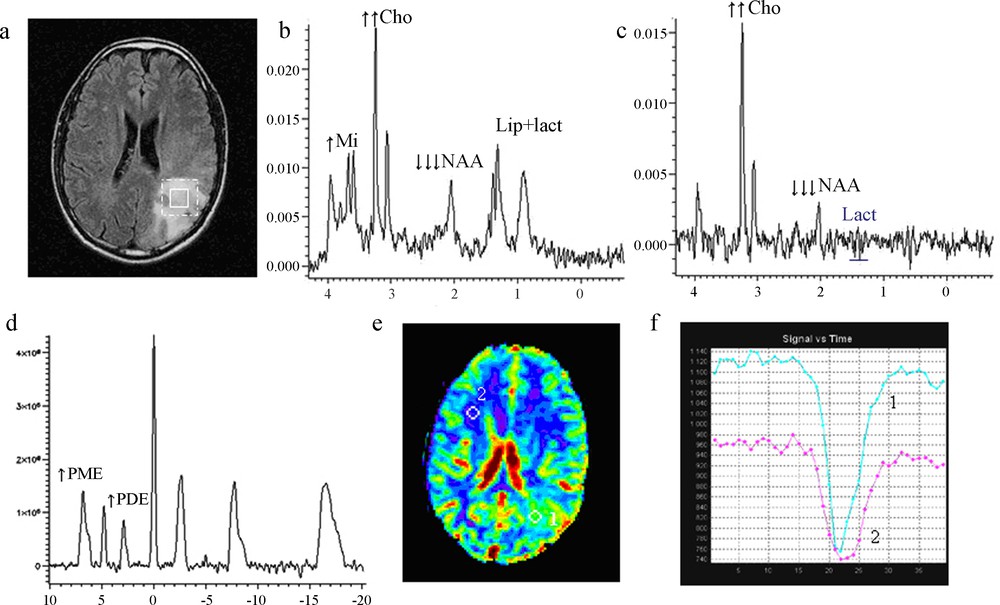
Imaging of low-grade glioma Class 3.
(a) Location of proton voxel and phosphorus voxel on the left frontal lesion, T2 FLAIR sequence.
(b) 1H MRS short TE showing an increase of choline, a dramatic decrease of NAA and large presence of lipid/lactate.
(c) 1H MRS long TE, presence of lactate.
(d) 31P MRS, an increase of PMEs, deltaPi = 4.92, pHi = 7.08.
(e) Perfusion MRI, a mapping of cerebral blood volume (rCBV), and
(f) Perfusion MRI, first pass curves: hyperperfusion with rCBV = 2.23.
3.2 Model results
The programs were written in MATLAB language to solve ODE system (7). Numerical simulations strongly suggest that system (7) has a unique, asymptotically stable steady state (data not shown). However, a full mathematical study of system (7) is beyond the scope of this article: since tumor metabolism can be assumed to be almost constant during data recording, we focused on steady states.
For convenience, we used the following notations:
- • αF: ratio CBF/ CBF0, where CBF0 is the normal blood flow; this ratio can be assumed to be the same as rCBF in data;
- • αJ: relative increase of J with respect to reference value J0, i.e. ratio J/J0;
- • αT: relative increase of T with respect to reference value T0, i.e. ratio T/ T0.
Thus, the reference steady state corresponds to αF = αJ = αT = 1. Reference values were obtained from data in normal human and previous model estimations [4,5,8,9].
We addressed a question where the straightforward interpretation of data gives no simple answer: what are the respective contributions of blood flow, lactate transport, and J on the variations of the product? On the one hand, the characteristics of Class 3 gliomas, with a marked increase of both LACH and CBF, and a significant decrease in , were easy to obtain using the model, by assuming large enough values of CBF and J (data not shown). On the other hand, the hemodynamics and metabolism of Class 1 and Class 2 gliomas were more difficult to explain. In particular, a negative correlation was observed between rCBF and the LACH product in Class 1, as displayed in Fig. 5. This somewhat paradoxical result was explored by calculating model steady states: LACH is plotted vs. αF (i.e., rCBF) in Fig. 6 for various values of J and T. It can be seen that assuming constant J and T values cannot explain MR data of Fig. 5: Strikingly, the LACH product varies only very slightly for αF varying from 0.7 to 1.7, which does not match MR data. Moreover, assuming that T is equal to its reference value (Dark blue curve) results in a poor agreement with MR data. In order to further discuss these points, some typical model results are displayed in Table 2.
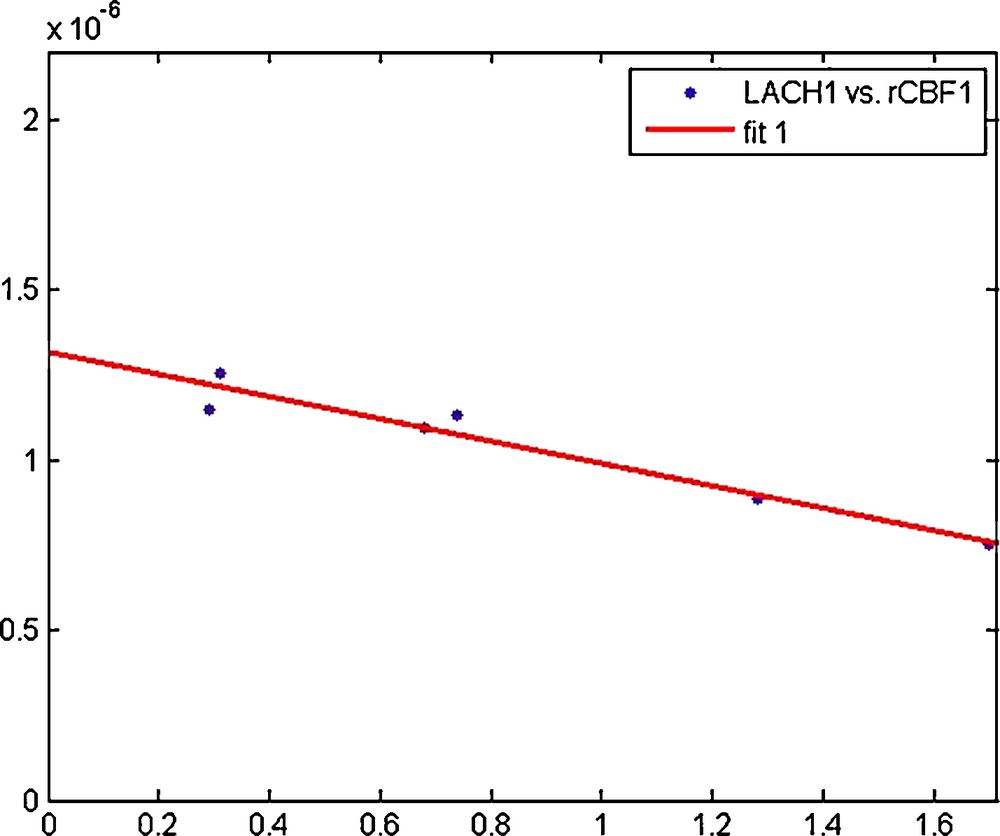
Regression line “LACH vs. rCBF” for Class 1 gliomas (r = 0.97, α < 0.05).

Model results for Class 1 gliomas: LACH is plotted vs. αF (i.e., rCBF). Parameter values are: CBF0 = 0.01 s−1, J0 = 0.001 mM s−1, T0 = 0.0061 mM s−1, KH = 3.5 10−7 mM.M, , as in [4]. Since varies very slightly amongst Class 1 gliomas, we set according to 31P MRS data. (Dark blue) αJ = 4.2, αT = 1.0; (Green) αJ = 4.2, αT = 1.7; (Red) αJ = 4.2, αT = 1.1; (Cyan) αJ = 6.4, αT = 1.7.
Some simulation results for Class 1 gliomas.
| Simulation case | αF | αJ | αT | Agreement with MR data | |
| (mM.M) | LACH vs. rCBF | ||||
| 1 | 1.0 | 4.2 | 1.0 | 1.05 10−6 | Yes |
| 2 | 1.7 | 4.2 | 1.0 | 9.95 10−7 | No (LACH too high) |
| 3 | 1.7 | 4.2 | 1.7 | 2.94 10−7 | No (LACH too low) |
| 4 | 1.7 | 4.2 | 1.1 | 7.34 10−7 | Yes |
| 5 | 1.7 | 6.4 | 1.7 | 7.30 10−7 | Yes |
Case 1 indicates that, when CBF is not increased, an increase of J alone can easily explain the observed data. However, when CBF is increased (cases 2–5), the pathophysiological mechanisms cannot be explained in a straightforward way. First, we will assume that the increase in J in cases 2–5 is equal or greater than the increase in J in case 1, which seems a reasonable assumption since increased CBF seems linked to increased tumor mass or tumor metabolism (see MRI results). According to case 2, an increase in J equal or similar to the increase in case 1 cannot fit clinical data; this indicates that in case 2 the increase in CBF, although resulting in a lactate ‘washout’, is not sufficient to explain the decrease in LACH.
It can be noted that in case 2, CBF is increased but T remains constant, which means that neither capillary recruitment nor increase in MCTs density occurs; CBF increase is due solely to an increase of blood velocity in the capillaries. An alternative hypothesis is that CBF and T are increased by the same factor (case 3), due to, for instance, the recruitment of capillaries or proliferation of new blood vessels; however, in this case the LACH product is too low.
Thus it was necessary to refine the assumptions. We could indeed get for rCBF = 1.7, a value consistent with the regression line “LACH vs. rCBF” for Class 1, in each of the following situations:
- • case 4, which consists in an increase of CBF with only a moderate increase of T. MRI data demonstrated that rCBV was only slightly increased or declined, which seemed consistent with this hypothesis. However, the major determinant of rCBV is venous volume, not capillary volume, so it is somewhat risky to relate it to capillary recruitment or proliferation;
- • case 5, in which we assumed that the increase of CBF is accompanied by a parallel increase in T and a major increase of J.
In conclusion, the decrease of LACH when rCBF increases, observed in Class 1, cannot be achieved by an increased of CBF due solely to the increase of blood flow velocity. It is necessary, whatever the assumptions about J, to suppose an increase of T. The increase of the parameter T may correspond to: (i) an increase of the area of the blood-brain barrier, due to the recruitment and/or proliferation of capillaries; (ii) an increase of lactate transport by a change of the density or the kinetic properties of lactate-H+ carriers (MCTs).
However, hypothesis (i) could probably be discarded because the WHO grade II glioma excludes the presence of capillary proliferation, and capillary recruitment does not seem to be a major mechanism of CBF regulation [11]. Moreover, if we assumed an increase of J (which is not necessary, as we have seen), knowing that J = J1 − J3, this increase may be due to an increase of glycolysis J1, but also to a decrease of J3 which corresponds to the diffusion of lactate towards the neighboring regions and/or to the consumption of lactate by neurons via lactate shuttle [12].
Thus, the model provided preliminary arguments to explain the observations of MRS and MRI. For example, it suggested the potential role of changes of MCTs, which play a major role in brain energy metabolism [12].
4 Discussion
The WHO grade II gliomas exhibit characteristics affecting their therapeutic management [13]. Their delay of change in tumor grade is highly variable from one subject to another [14]. To date, only clinical events or continuous observations of the growth of the tumor volume on repeated examinations can evoke a change in tumor grade. It is therefore necessary to repeat the MRI at regular intervals to obtain a predictive parameter, namely the growth of average diameter [15]. However, in addition to requiring regular inspections, this approach is purely morphological and has the disadvantage of revealing the consequences of changes of tumor biometabolism, which occur upstream of tumor growth and of degeneration of the lesion. Indeed, switching the metabolism of grade II glioma to a much closer metabolism to that of high grade gliomas occurs very early during the natural history of gliomas [16]. It is therefore obvious that volume growth and metabolic changes are not synchronous and that metabolic changes precede the growth of tumor volume. Therefore it seemed important to attempt an investigation of these changes in tumor metabolism, using a biomathematical model with simulations from metabolic data, collected in vivo by magnetic resonance. For the first time we propose a model combining the parameters of 1H MRS, 31P MRS and the MRI perfusion.
Indeed, previous studies conducted in 1H MRS, had not demonstrated the existence of discriminate factors between different subgroups of grade II, probably because they were conducted from inhomogeneous population in tumor grade [17,18]. Recently, we conducted a study [2] from a homogeneous population of WHO grade II gliomas. This study revealed three different spectral profiles 1H according to the classes of KI-67, marking tumor antigen considered a marker of tumor aggressiveness underlying. In this population of grade 2, the appearance of a resonance of lactate, which reflects an abnormally high concentration of lactate, appeared to be predictive of a Ki-67 greater than 4%. The question we might ask is lactate could be considered as a marker of tumor aggressiveness. In addition, the detection of lactate was inconstant in the third group of patients with Ki-67 greater than 8%, reflecting a decrease of lactate concentration. The second question we can ask is, what is the mechanism involved in the decrease in lactate. Factors that may play a major role are particularly the regional blood flow, the values of pH, lactate transport which run via the MCT, carriers lactate-H+ [12].
To better understand the pathophysiological mechanisms involved, we constructed a mathematical model consisting of a system of nonlinear ordinary differential equations. We implemented this model using in vivo data from multinuclear MRS (1H/31P) and perfusion MRI. This model is based on existing physiological models [4,5], and its variables or parameters are mostly measured by MRS and MRI perfusion. We tried to explain the great variability of regional blood flow, lactate and pHi, which were difficult to explain coherently.
The implementation of the model with the data from our study allows identification of different subgroups based on lactate, pHi and data from MRS perfusion. Thus, gliomas expressing lactate and an increase in CBF, also show an increase in pHi. These results are consistent with the experimental study of Hubesch et al. [19], which showed that despite a potential increase in glycolysis, the pHi of tumor cells is likely to increase due to alterations of membrane transporters proton/bicarbonate.
On the other hand, it seemed paradoxical that lactate, which we have shown that it would be a very early marker of changes of tumor metabolism [2], has values very different, and sometimes a non-monotonic evolution. Taken into account intracellular pH and rCBF by the model of lactate, allows one to have a mathematic simulation of the high dispersion of results obtained from MRS and perfusion MRI without nether recourse to the hypothesis of capillary recruiting highly unlikely in WHO grade II gliomas, nor to the capillary proliferation excluded at this stage. However, our results strongly suggest changes in the transport of lactate across the blood-brain and the membranes of tumor cells. This hypothesis can be in relation with the resonance of free lipids observed in lesions showing no detectable lactate resonance. It is consistent with recent data from the literature, which suggest qualitative or quantitative changes of MCTs in glial tumors.
This mathematical modeling from in vivo data allows considering to design a longitudinal study of grade 2 gliomas, in order to objectify the predictive power of that model.
Conflict of interest statement
None.