

1 Introduction
The model of temporal lobe epilepsy (TLE) induced by pilocarpine is a well-studied model that reproduces most of the clinical, developmental and neuropathologic features of human TLE, including hippocampal sclerosis (HS), which is the most prominent lesion observed [1–5]. In adult rats, pilocarpine injection leads to Status Epilepticus (SE), starting approximately 25 min after the injection. This acute seizure phase is followed by a “silent” seizure-free phase (mean duration of 14–25 days). Thereafter follows the chronic phase during which the animals exhibit spontaneous recurrent seizures.
An important number of studies have demonstrated the potential role of proton Magnetic Resonance Spectroscopy (1H MRS) for the non-invasive study of epilepsy in humans and in animal models (kainate and pilocarpine models) [6–23]. These 1H MRS studies have typically reported abnormalities of the main visible metabolites: N-acetylaspartate (NAA), creatine plus phosphocreatine (Cr) and choline-containing compounds (Cho) expressed as ratios, or with careful calibration, as concentrations. Most studies have reported metabolite ratios, rather than single metabolite concentrations, with the expectation that these ratios are more robust for comparisons in the temporal lobe [21].
Useful information concerning the lateralisation of the epileptogenic zone in patients with lesional and non-lesional TLE [6–11,13–15,19–21,23] was provided by 1H MRS. The most common finding reported has been a decrease of the NAA concentration [13–15], mostly in patients with HS [23]. Great reductions of NAA concentration tend to be found on the side of the seizure origin [23], but changes are also found beyond the seizure focus. Some groups have found a correlation of NAA concentration with the seizure activity, whereas others have not [21]. NAA is thought to reside almost exclusively in neurons [24,25], and has therefore been used as a marker for neuronal density [26]. However, its functions remain unclear. At the present time, a decrease of NAA is thought to either reflect neuronal loss or dysfunction or altered mitochondrial metabolism [6–9,11,13–18]. Results concerning the concentrations of other metabolites have been less consistent. Lazeyras et al. [11] have reported an increase in lactate (Lac) concentration during acute seizures. Increase in Cr and Cho concentrations has also been reported in patients with TLE (mostly with HS) [23,13].
Previous MRS studies of kainic acid-[12,16,22] and pilocarpine-[17,18] induced SE have shown in the acute phase an increase of Lac concentration and a decrease of NAA concentration. For kainate treated rats, Tokumitsu et al. [22] have reported significant decreases of NAA and Cr concentrations from the silent phase to the chronic phase, with both reaching a minimum at approximately 14 days. Also, they have shown a significant increase of Cho concentration over all the phases. Gomes et al. [18] have investigated the hippocampal NAA content in the silent phase of pilocarpine-treated rats and have reported a partial recovery of NAA 7 days after the SE.
The purpose of our study was to use 1H MRS in order to estimate the brain metabolite concentration changes in the hippocampus, especially in the chronic phase, and to provide complementary information to the published studies. To our knowledge, the few 1H MRS studies focused on the pilocarpine model did not evaluate the chronic phase [17,18]. The investigation of the chronic phase is an important step in order to assess the modifications occurring in neurons and to compare the results with the pathophysiology of human TLE.
The development of hippocampal sclerosis and the absence of morphological changes during the acute phase on conventional MRI (T2-weighted images) [4,5] were the reasons for which we chose to investigate by 1H MRS the hippocampus of pilocarpine rats.
In the present study, the brain metabolite concentration changes were estimated in the hippocampus region of pilocarpine rats by 1H MRS, 24 h (acute phase) and 2 months (chronic phase) after the onset of Status Epilepticus, and compared to those obtained from the healthy rats.
2 Method
2.1 Animals
The experiments were conducted according to the procedures approved by the Institutional Animal Care and Ethical Committee of our University.
Eighteen adult male rats (Sprague-Dawley, 180–200 g in weight, 7–8 weeks old) were injected with intra-peritoneal pilocarpine hydrochloride (4%) (350 mg/kg). The rats received subcutaneous scopolamine methyl nitrate (1 mg/kg), 30 min prior to the pilocarpine injection, in order to minimize its peripheral cholinergic effects. Thereafter, the animals were observed for 2 h to study the behavioural symptoms of seizure. According to standardized protocols, subcutaneous diazepam (10 mg/kg) was administered to stop seizures 2 h after SE.
The dorsal part of the hippocampus of the epileptic rats was investigated 24 h (acute phase; 18 animals) and 2 months (chronic phase; 9 animals) after the onset of Status Epilepticus using a non-invasive 1H MRS longitudinal study.
For comparison, the same region was also investigated in 5 healthy adult rats (Sprague-Dawley, 200 g in weight, 7–8 weeks old).
During the MRI and 1H MRS experiments, the rats were anaesthetized by inhalation of isoflurane (Abbott Laboratories, Rungis, France) with 2.5% concentration in a mixture of 50% oxygen and 50% nitrous oxide. The body temperature was maintained at 37 °C by warm water circulation. A pressure probe was used to monitor the respiratory cycle.
2.2 Experimental conditions
The experiments were performed on a horizontal 7 T Biospec system (BRUKER BioSpin MRI, Germany), equipped with a 12 cm diameter gradient set (400 mT/m maximum amplitude). A transmit cylindrical bird cage coil (72 mm inner diameter) and a receiver surface coil (15 mm diameter) were used.
Acquisitions were performed using a short- and a long-echo-time PRESS (Point Resolved Spectroscopy) sequence (echo time (TE) = 20/136 ms, repetition time (TR) = 5 s, bandwidth of 4 kHz, 4096 data-points, 128 averages, acquisition time of 11 min) combined with outer volume suppression. Acquisitions with a long echo time were performed in order to disentangle the lactate and lipid resonances at 1.3 ppm. The water signal was suppressed by variable-power RF pulses with optimized relaxation delays (VAPOR) [27]. All first- and second-order shim terms were adjusted using FASTMAP (Fast, Automatic Shimming Technique by Mapping Along Projections) [28] for each volume of interest (VOI). The VOIs used for FASTMAP were slightly bigger than those for the acquisitions (3.5 × 3.5 × 3.5 mm). Shimming resulted in unsuppressed water spectral linewidths of 7–11 Hz.
The localization of the VOI was based on T2-weighted RARE (Rapid Acquisition with Relaxation Enhancement) images (TR/TE = 6500/65 ms, slice thickness 0.5 mm, echo spacing 20.3 ms, RARE factor = 8, field of view = 30 × 30 mm, matrix = 256 × 192), see Fig. 1. The size of the VOI was adjusted to fit the anatomical structure of the selected brain region and to minimize partial volume effects. The 1H MRS signals were acquired from the VOIs centred in the hippocampus (left side of the brain, 3.2 × 2 × 3.2 mm3) of the healthy and the epileptic rats (24 h and 2 months after the SE).
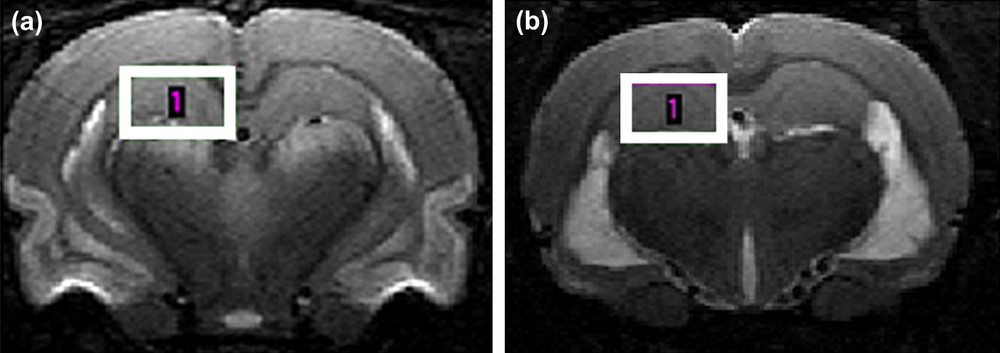
T2-weighted brain images of an epileptic rat obtained at 7 T: (a) 24 h after the Status Epilepticus and (b) 2 months after Status Epilepticus. The localization of the volume of interest for the 1H MRS investigation is shown.
2.3 Quantification
The in vivo 1H MRS signals were processed in the time-domain using the jMRUI software [29,30]. Removal of residual water components was performed in a preprocessing step using the Hankel–Lanczos Singular Value Decomposition algorithm – HLSVD (25 spectral components were used for modelling). After the preprocessing step, the metabolite concentrations were estimated using the method QUEST combined with the ‘Subtract’ approach for background modelling [31]. The method QUEST calculates the best fit to the low-SNR in vivo experimental signal as a linear combination of model, aqueous-solution signals of brain metabolites. The following 11 metabolites were included in the basis set: aspartate (Asp), creatine (Cr), choline (Cho), γ-aminobutyric acid (GABA), glucose (Glc), glutamate (Glu), glutamine (Gln), N-acetyl-aspartate (NAA), taurine (Tau), lactate (Lac) and myo-inositol (Ins) [32–35]. To set up this basis-set, the 11 metabolites were dissolved separately in aqueous solutions buffered with phosphate at pH = 7.0 ± 0.1 (concentration of 100 mM). The metabolites were purchased from Sigma-Aldrich. The basis-set signals were acquired using identical acquisition parameters as the in vivo ones. The background component, which mainly originates from macromolecules and lipids, was estimated using the method ‘Subtract’-QUEST. The optimum number of truncated data-points was defined for each in vivo signal and found to be in the range 19–22 (corresponding to a duration of ∼5 ms). The zero-order phase and the dead time were fixed to zero in the processing algorithm.
The accuracy of the amplitude estimates was assessed using the Cramér–Rao theory [36,37]. An estimate was considered relevant when the corresponding estimated Cramér–Rao lower bound (CRB) was found below 15% of the estimate. The mean of the relevant estimates and the corresponding error values (±1 SD, 70% confidence interval) of the metabolite concentration estimates obtained with Subtract-QUEST from the hippocampus region of the healthy and epileptic rats (24 h and 2 months after SE) were computed. Because a surface coil was used, the in vivo metabolite concentration estimates were set proportional to the total creatine (Cr + PCr) concentration, used as an internal reference, which was supposed to be 8.5 mmol/kgww [38].
2.4 Statistics
The metabolite concentration estimates from the healthy rats and from the epileptic rats for the two time points (24 h and 2 months after SE) were compared pairwise. Statistical significant differences were calculated with two-tailed Student's t-tests. A paired t-test was invoked for the two-time-point comparison of the epileptic rats. An unpaired t-test was used for the concentration estimate comparison of the epileptic and healthy rats. *p < 0.05 was considered significant, while **p < 0.01 was considered highly significant.
3 Results
3.1 Animal behaviour after the pilocarpine injection
All the 18 rats developed Status Epilepticus. Almost immediately after the pilocarpine injection, the animals immobilized themselves and developed, within the 10 following minutes, automatic movements of chewing, head bobbing and exploratory behaviour. Then, recurrent seizures started within 15 min after the pilocarpine injection and progressed to Status Epilepticus after 20 ± 5 min.
Among the 18 pilocarpine rats, 9 died in the first week after the injection and only 9 survived (400–500 g in weight) 2 months after SE. The high mortality rate was in concordance with the literature [1–5].
3.2 Magnetic Resonance Spectroscopy
The high quality of the multislice T2-weighted images of the rat brain provided accurate and reproducible positioning of the VOI. In Fig. 2, the displayed 1H MRS spectrum shows the spectral quality consistently achieved in our study. In addition to the commonly observed metabolites (NAA, Cr and Cho), Ins, Tau, Gln, Glu, Asp, Glc, GABA were discernable in the hippocampus. Using a reasonable scan time, the signal-to-noise ratio turned out to be sufficient for a reliable quantification with QUEST.
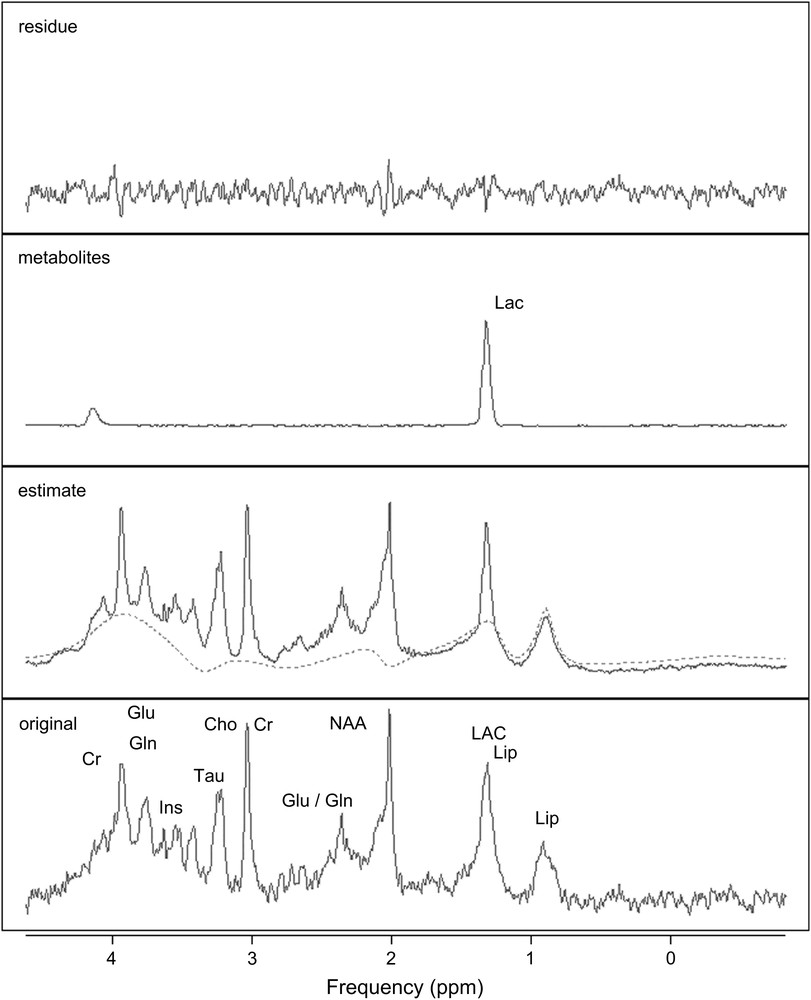
QUEST quantification results. From bottom to top, original spectrum from an epileptic rat brain, acquired in vivo at 7 T in the hippocampus (PRESS, TE = 20 ms, TR = 5 s); estimated spectrum and background (dashed line); selected estimated metabolite (Lac) spectrum; and residue.
The metabolite concentration estimates obtained from the signals of the hippocampus of the healthy rats were in good agreement with the values from the literature. The latter were estimated from biochemical rat brain assays [38] and from quantification of in vivo rat brain spectra using LC-Model [38,39] and AMARES [40].
QUEST quantification results, obtained for an in vivo epileptic rat brain signal acquired from the hippocampus 24 h after the onset of SE, are shown in Fig. 2. Good smooth approximations of the background signals were estimated. The main resonances of the background signal (dashed line) were well identified: both lipid resonances (0.9 and 1.3 ppm) and the three principal resonances of macromolecules (around 2.0–2.5 ppm, 3.0–3.2 ppm and 3.5–3.9 ppm). A concentration estimate was considered relevant when the corresponding CRB was below 15% of that estimate. Applying this criterion, all the metabolite concentration estimates were relevant. The mean values (in mmol/kgww) and the corresponding standard deviations of the metabolite concentration estimates, obtained from the epileptic (24 h and 2 months after SE) and the healthy rats in the hippocampus, are shown in Fig. 3. The standard deviations revealed the inter-individual metabolite differences. Although the estimations of GABA, Asp and Glucose concentrations were relevant based on estimated CRBs, the corresponding mean values were over-estimated compared to the values usually reported in the literature for healthy animals. A ready explanation is that these metabolites were amongst the most weakly represented in the signals. Furthermore, the spectral peaks of GABA, Asp and Glc are spread over and their resonances strongly overlap with those of more abundant metabolites and with those of the macromolecules. Consequently, these over-estimates could be related to the background error-modelling around the NAA, Cho and Glu resonances [42,43].
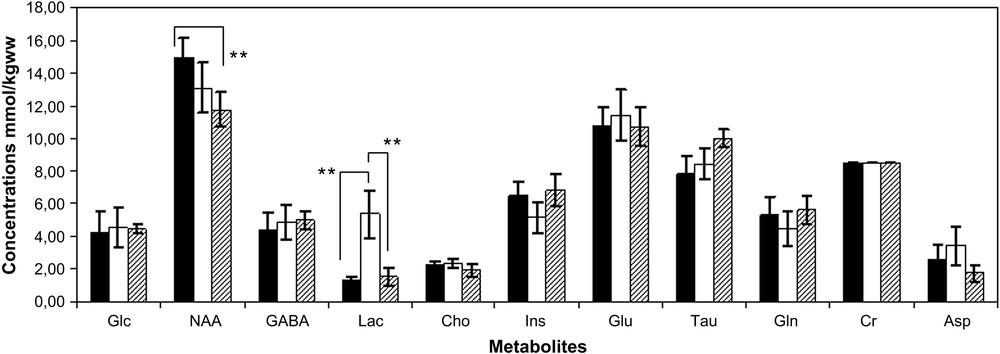
Mean values and the corresponding standard deviations (±1 SD) of the metabolite concentration estimates obtained with Subtract-QUEST from the hippocampus region of the epileptic rats 24 h after SE (white bars), 2 months after SE (dashed bars) and the healthy rats (black bars). Cr was used as reference and consequently has no error bars. Statistical significant differences were indicated (**p < 0.01).
As expected, the signal intensity on the T2-weighted images in the hippocampus area was unchanged in the acute phase (Fig. 1a). Only a bilateral hypersignal in the piriform and enthorinal cortices and in the amygdala was observed. In the chronic phase a bilateral hypersignal in the dorsal and ventral region of the hippocampus was detected on the T2-weighted images, as confirmed in Fig. 1b (hypersignal showed in the ventral part of the hippocampus).
In the hippocampus, a statistically significant increase of lactate concentration (**p < 0.01) was quantified 24 h after SE (Fig. 3). This high concentration of the lactate in the epileptic rat brains was confirmed by the long-echo-time acquisitions. The lactate concentration returned to the concentrations observed in healthy brains in the chronic phase (Fig. 3).
A slight decrease of the NAA was detected in the acute phase. The NAA concentration still decreased in the chronic phase, resulting in a statistically significant loss (**p < 0.01) compared to the healthy rat brains.
No significant changes were observed for the other metabolite concentration estimates.
4 Discussion
A progressive decrease of NAA from the acute phase to the chronic phase was demonstrated in our study. While an increase in lactate concentration was not detected in any of the healthy rats, a statistically significant increase of lactate concentration was quantified in the acute phase, which in the chronic phase returned to the concentrations observed in healthy brains. No significant differences were observed for the other selected metabolites.
The presence of a bilateral hypersignal in the piriform and enthorinal cortices and in the amygdale, in the acute phase, and in the dorsal and ventral region of the hippocampus, in the chronic phase, was in agreement with Roch et al. [5]. They attributed the presence of the hypersignal, related to the correlations between MRI and histopathology, edema, gliosis and atrophy [5].
The increase in lactate concentration in the acute phase was in agreement with other MRS studies on kainate- and pilocarpine-treated rats [9,12,17] and clinical studies [11]. Indeed, Najm et al. [12] and Lazeyras et al. [11] have reported an increased Lac concentration during seizures, the latter being elevated up to 24 h after a seizure and returning to the baseline level within several days after SE. The significant increase of the Lac concentration in the pilocarpine-treated rats in the acute phase has been attributed to an increase in anaerobic glycolysis [17].
The almost significant decrease of the NAA concentration in the acute phase reported in our study was in agreement with the published studies on kainate- and pilocarpine-treated rats [16–18,22]. Van Eijsden et al. [17] have investigated by MRS the pilocarpine model in the hippocampus at 2, 4 and 6 h after SE. A progressive decrease of NAA concentration in the acute phase has been reported in their study. Gomes et al. [18] have investigated the hippocampal NAA content in pilocarpine rats by MRS 2 and 7 days after SE. They have reported a significant decrease of NAA concentration in the acute phase.
In the silent phase, Tokumitsu et al. [22] have reported in kainate-treated rats a significant decrease of NAA reaching a minimum at approximately 14 days. In contrast with these results, Gomes et al. [18] have reported a partial recovery of NAA 7 days after the SE in pilocarpine treated rats.
From our knowledge there are only a few MRS studies on the pilocarpine model [17,18] and in these studies the chronic phase was not investigated. However, the progressive decrease of the NAA concentration in the chronic phase demonstrated in our study was consistent with the findings of Tokumitsu et al. [22] in kainate-treated rats. Moreover, this significant decrease of the NAA concentration was also in agreement with the findings in human TLE [13–15].
The quantification of metabolite concentrations in tissues with morphological changes (i.e. edema, gliosis, atrophy) is difficult. For example, in the edematous tissues the intra- and extracellular fractions may vary with the severity of edema [41]. In almost all morphological changes, including edema, gliosis, and neuronal loss, the concentration of free water is increased in the tissue [4]. This increase in free water is characterized by an increase of the T2 relaxation values [4]. However, a certain threshold in the increase of the T2 relaxation values must be reached for visualizing a hypersignal on T2-weighted images [4]. To avoid complications due to the presence of morphological changes, our metabolite concentration estimates were computed using the Cr concentration as an internal reference. The use of Cr as an internal reference was also supported by the fact that changes of Cr concentrations (statistically significant) were not detected in the hippocampus of the epileptic rats. An alternative approach would have been to use the water as an internal reference. But without any precise knowledge about the water content variations in the VOI, the presence of morphological changes can give rise to significant variations in the expected concentrations of metabolites, independent of any pathological changes [20].
Histopathological studies [5,44] performed on the pilocarpine model showed a progressive neuronal loss in the hippocampus. In the acute phase, the neuronal loss ranged from 13 to 35% and in the chronic phase the number of neurons significantly decreased by 52–64%. Although the significant decrease of the NAA concentration observed in our study was of 21%, this continuous decrease was consistent with the histopathological observations described above.
In kainate induced SE, Ebisu et al. [16] have shown that NAA measurements correlate with pathologically determined neuron loss. The progressive decrease of NAA concentration in the acute phase reported by Van Eijsden et al. [17] in pilocarpine rats was most likely attributed to neuronal death or dysfunction. Gomes et al. [18] have attributed the NAA decrease in pilocarpine rats, at least in part, to an ongoing impairment of mitochondrial function, suggesting that the reduction of NAA was unlikely due solely to neuron loss.
In the epileptogenetic human hippocampus, Petroff et al. [13] have attributed the decrease of NAA concentration to a mitochondrial dysfunction rather than neuron loss or gliosis. A hypothesis put forward by Hugg et al. [14] was that the energy-dependent formation of NAA in the neuronal mitochondria might be affected by the compromised energy metabolism during SE. This hypothesis was based on the fact that these declines could be reversible on successful surgical intervention [14,15] and on the close relationship between rate of NAA and ATP synthesis [17].
5 Conclusion
In conclusion, the progressive decrease of NAA from the acute phase to the chronic phase reported in our study could be related in part to the development of the hippocampal sclerosis and of the epilepsy. This significant decrease of the NAA concentration was in agreement with the findings in human TLE, meaning that the pilocarpine model reproduces the same modifications as those of human TLE. This makes the model robust and ideally suited to study the pathophysiology of human TLE. Further sophistication and application of this technique will increase our understanding of the pathophysiology of human TLE, creating possibilities for testing different treatments.
Acknowledgments
The experiments were performed by the authors on the ANIMAGE platform, Lyon, France.