

1 Introduction
The genus Chlorophytum belongs to the family Asparagaceae and comprises about 215 species, six sub-species and eight varieties. It is considered to be a native of the old world and is mainly distributed in the tropical and subtropical regions of Africa, Madagascar, and India [1,2]. The species of Chlorophytum are well known for their medicinal use in Ayurvedic and Unani systems. The root of these species contains a variety of secondary metabolites like alkaloids, saponins and flavonoids, which possess various pharmacological uses [3–5]. The root powder of C. borivilianum, C. attenuatum, and C. tuberosum is the commercial name in India of ‘Safed musli’. This drug is known to be very effective for enhancing general body immunity, vigour and strength [6]. Because of this commercial importance, the plants are generally harvested from their wild habitats. These plants have been listed as an endangered species in the Red Data Book of Indian plants by the Botanical Survey of India because of their habitat destruction and uncontrolled harvesting [7].
It is a general ecological concept that for long-term survival of species, genetic diversity plays a crucial role by assisting plants with adapting to environmental changes. Identification and understanding of genetic diversity in plant species is an important step for conservation. It is very difficult to develop and implement the long-term conservation plan of the Chlorophytum species because of the small population size and habitat heterogeneity. This might result in limited gene flow leading to higher genetic differentiation among plant populations. Chlorophytum species are very difficult to identify based on morphological characteristics. The genetic diversity of this medicinally important species is largely unknown, but essential to designing effective breeding and conservation programs to sustain natural population [8]. A very limited information on identification and phylogenetic analysis based on molecular markers is available [9]. Also, it is highly desired to authenticate the genus Chlorophytum using genome-based approaches before its use as a medicinal plant.
Various molecular markers like Random Amplified Polymorphic DNA (RAPD), Amplified Fragment Length Polymorphism (AFLP), Simple Sequence Repeats (SSR) and Single Nucleotide Polymorphism (SNP) were used to study the genetic diversity at the molecular level in various wild plant species [10]. Among these markers, AFLP provides dominant, multilocus and genome wide DNA profile. AFLP is a cost effective and highly reproducible tool; it does not require prior sequence information, making it suitable for molecular characterization and DNA fingerprinting [11,12]. The AFLP technique is based on the selective PCR amplification of restriction fragments from a total digest of genomic DNA. It provides high genetic polymorphism, valuable site information, and reveals genetic variations between individuals.
The objective of this study was to evaluate the genetic diversity among the genus Chlorophytum accessions collected from the Indian subcontinent using AFLP markers. It seems that taxa remain emblematic to higher altitude geographic locations having higher precipitation rates, mostly in Western Ghats and in the peninsular Deccan plateau of India. The species grows in small patches with limited population. The study aims at contributing to the identification and discrimination of 18 Chlorophytum species. It reveals the level of genetic diversity and genetic structure within species.
2 Materials and methods
2.1 Population sampling
Plant material from 18 different species of genus Chlorophytum was collected from different locations in the Indian subcontinent (Fig. 1). A total of 87 samples, 3–5 individuals per species, were collected from different type localities [6,13]. The plant specimens were maintained in a germplasm field at the botanical garden of the Department of Botany, Shivaji University, Kolhapur. The identification of all species was confirmed by referring to different prologues, floras and comparing with a typed specimen. The representative voucher number and GPS location of specimens is listed in Table 1.
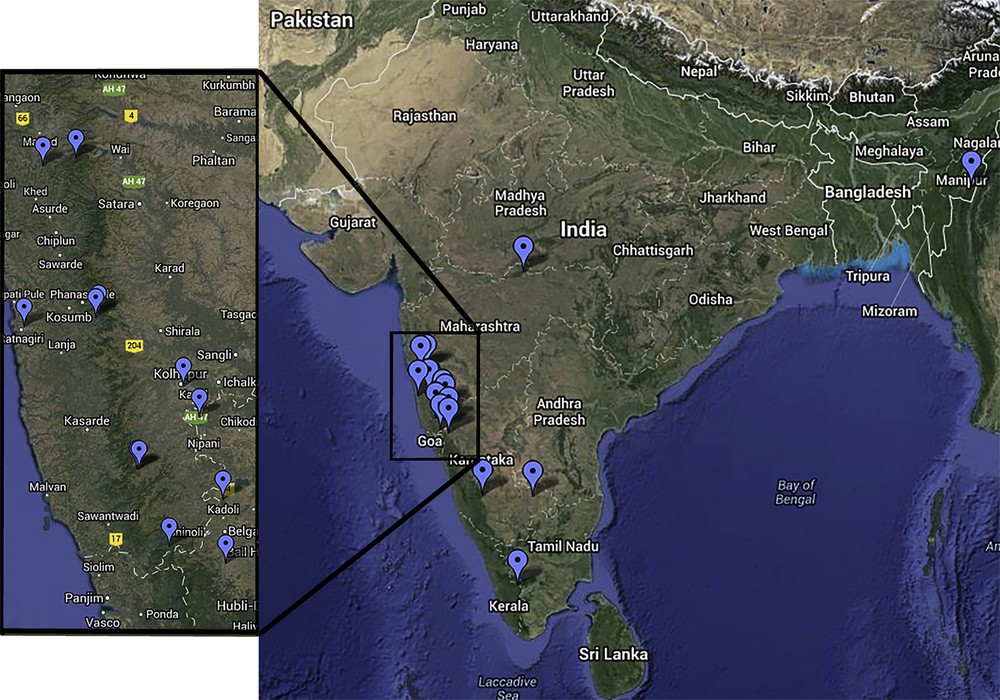
(Colour online.) Sampling location of 18 species of Chlorophytum (Google Maps).
Sampling details of the populations of genus Chlorophytum in the present study.
| Species name | Accession numbera | Sample size | Sampling locality | Longitude (E) | Latitude (N) | Voucher number (collection year) |
| Chlorophytum kolhapurense | C1 (A-E) | 5 | Sutagatti ghat, Karnataka. | 16.042208 | 74.489306 | SUK 106 (2012) |
| Chlorophytum arundinaceum | C2 (A-E) | 5 | Melghats Amravati. | 21.399728 | 77.298472 | SUK 109 (2012) |
| Chlorophytum laxum | C3 (A-E) | 5 | Shivaji university, Kolhapur. | 16.673583 | 74.254194 | SUK 105 (2012) |
| Chlorophytum glaucoides | C4 (A-E) | 5 | Tillari, Kolhapur. | 17.939908 | 73.632758 | SUK 111 (2012) |
| Chlorophytum bharuchae | C5 (A-E) | 5 | Adi Chikkodi, Karnataka. | 16.498567 | 74.351700 | ANC 700 (2009) |
| Chlorophytum belgaumense | C6 (A-E) | 5 | Khanapur, Belgum. | 15.680281 | 74.502631 | Chandore 1113 (2010) |
| Chlorophytum borivilianum | C7 (A-E) | 5 | Kasedi, Poladpur. | 17.902167 | 73.437289 | SUK 100 (2011) |
| Chlorophytum amaniense | C8 (A-E) | 5 | Ornamental plant | – | – | SUK 749 (2009) |
| Chlorophytum heynei | C9 (A-C) | 3 | Anamalai Hills, Tamil Nadu. | – | – | SUK 713 (2011) |
| Chlorophytum breviscapum | C10 (A-E) | 5 | Marleshwar, Ratnagiri. | 17.056186 | 73.745858 | SUK 108 (2012) |
| Chlorophytum indicum | C11 (A-E) | 5 | Sultanpeth, Nandi hills, Karnataka. | 13.385517 | 77.667647 | SUK 102 (2011) |
| Chlorophytum gothanense (Gothane Plateau) | C12 (A-E) | 5 | Gothane Plateau, Sangali. | 17.075706 | 73.764153 | SUK 107 (2012) |
| Chlorophytum malabaricum | C13 (A-E) | 5 | Nandi Hills, Karnataka. | 13.429864 | 75.756486 | SUK 99 (2011) |
| Chlorophytum glaucum | C14 (A-E) | 5 | Tillari, Kolhapur. | 15.778489 | 74.171792 | SUK 110 (2012) |
| Chlorophytum tuberosum | C15 (A-E) | 5 | Ratnagiri, Maharashtra. | 17.005517 | 73.327647 | SUK 101 (2011) |
| Chlorophytum gothanense (Kondushi Plateau) | C16 (A-E) | 5 | Kondushi, Gargoti. | 16.211431 | 73.990014 | SUK 103 (2011) |
| Chlorophytum sharmae | C17 (A-E) | 5 | Munnar, Kerala. | 10.083411 | 77.066697 | Adsul 2553 (2013) |
| Chlorophytum nepalense | C18 (A-D) | 4 | Tengnoupal, Chandel, Manipur. | 24.386664 | 94.143631 | SUK 712 (2013) |
2.2 DNA extraction
Total genomic DNA was extracted using the modified CTAB method [14], but the high level of secondary metabolites and phenolic content inhibits the enzymatic reaction. The protocol was modified to resolve the problem of inhibition. Sixty to hundred milligrams of fresh and young leaf material was homogenised with 1 mL of an extraction buffer (100 mM tris HCl, 20 mM EDTA, 1.4 M NaCl, 2% CTAB, 1% PVP), 20 μL of proteinase K (50 μg/mL), and 1% β-mercaptoethanol. The mixture was incubated for 30 min at 65 °C and centrifuged at 5000 rpm for 5 min. The supernatant was transferred into a clean tube, and phenol:chloroform:isoamyl alcohol (25:24:1 v/v/v) were added. After gentle mixing, the samples were centrifuged at 12,000 rpm for 10 min, then the supernatant was transferred into a new tube and chloroform:octanol (24:1 v/v) were added; the mixture was then centrifuged at 12,000 rpm for 5 min. The DNA in the supernatant was precipitated with a 2:3 volume of ice-cold isopropanol and incubated at −20 °C overnight. The DNA pellet was washed using 70% ethanol, air dried and dissolved in a TE buffer. The quality of the DNA was determined using a 1% agarose gel and quantified with a Biospectrometer (Eppendorf, USA). The final concentration of the DNA samples were adjusted to 50 ng/μL. The samples were stored at −20 °C.
2.3 AFLP fingerprinting
AFLP fingerprinting was performed using the protocol based on the method described by Paterson et al., with minor modifications [14,15]. In the present study, non-radioactive fluorescent dye-labelled primers were used. Two hundred and fifty nanograms of DNA were digested using 5 U of EcoRI and 5 U of MseI restriction endonuclease mixture at 37 °C for 1 h. The reaction was terminated by an enzyme inactivation at 65 °C for 15 min. The digestion was checked using 10 μL of digested DNA run on 2% (w/v) agarose gel. Adapters of EcoRI (1 μL of 5 μM; 5′-CTCGTAGACTGCGTACC-3′ and 5′-AATTGGTACGCAGTCTAC-3′) and MseI (1 μL of 50 μM; 5′-GACGATGAGTCCTGAG-3′ and 5′-TACTCAGGACTCAT-3′) were ligated to the digested DNA samples using 1 U of T4 DNA ligase. The ligated product (5 μL of 10 fold diluted) was pre-amplified using pre-selective EcoRI and MseI primers, in a thermocycler for 20 cycles consisting in denaturation at 94 °C (30 s), annealing at 56 °C (60 s) and extension at 72 °C (60 s). The amplified PCR products were checked on a 1% agarose gel and diluted 50 times, then stored at −20 °C.
Selective AFLP amplification was carried out using eight florescent labelled EcoRI and eight MseI primers. Sixty-four primer combinations were screened using DNA samples of 10 different Chlorophytum species. On the basis of our results, fifteen primer pairs were selected for further AFLP analysis (Table 2). The PCR selective amplification temperature profile used for each cycle was 30 s at 94 °C, 30 s at 65 °C, and 60 s at 72 °C; it was followed by 12 cycles of touchdown PCR (for 30 s) in which the annealing temperature decreased by 1 °C at every cycle till 56 °C. Further, 23 cycles were carried out as described above for pre amplification. The automated fragment analysis was performed using a 3500 Genetic analyser (Applied Biosystems) with a GeneScan 600 LIZ size standard.
List of selected primer combinations used and details of polymorphism.
| Primer pairs | Total number of fragments (TF) | Number of polymorphic bands (PF) | Percentage of polymorphic bands (PPB%) | Nei's gene diversity (H) | Shannon's diversity index (I) |
| E-ACT/M-CAC | 168 | 168 | 100 | 0.2047 | 0.3510 |
| E-ACT/M-CAG | 404 | 404 | 100 | 0.2085 | 0.3610 |
| E-ACT/M-CTA | 396 | 396 | 100 | 0.2302 | 0.3894 |
| E-ACT/M-CTC | 284 | 284 | 100 | 0.1796 | 0.3184 |
| E-ACT/M-CTG | 383 | 383 | 100 | 0.2218 | 0.3791 |
| E-ACA/M-CAA | 159 | 159 | 100 | 0.2064 | 0.3572 |
| E-ACA/M-CAC | 163 | 163 | 100 | 0.1671 | 0.3000 |
| E-ACA/M-CAG | 229 | 228 | 99.56 | 0.1499 | 0.2800 |
| E-ACA/M-CAT | 129 | 128 | 99.22 | 0.1459 | 0.2728 |
| E-ACC/M-CAC | 472 | 470 | 99.57 | 0.2334 | 0.3939 |
| E-ACC/M-CTC | 402 | 402 | 100 | 0.2454 | 0.4089 |
| E-ACC/M-CTT | 359 | 359 | 100 | 0.2216 | 0.3778 |
| E-AGC/M-CAT | 428 | 428 | 100 | 0.2393 | 0.4023 |
| E-AGC/M-CTG | 392 | 392 | 100 | 0.2293 | 0.3881 |
| E-AGC/M-CTT | 414 | 414 | 100 | 0.2444 | 0.4086 |
| Total | 4782 | 4778 | – | – | – |
| Average | 318.8 | 318.53 | 99.91 | 0.2085 | 0.3592 |
2.4 Data acquisition and statistical analyses
Fluorescent labelled AFLP fragment analysis was performed by GENEMAPPER 3.7 software. The fragments ranged from 50 to 600 bases with a threshold value higher than 200 relative fluorescence values (rfu) were considered for the analysis. AFLP data were scored under the format of binary matrices, “1” for presence of a fragment and “0” for absence of a fragment. The peaks were checked manually. For unbiased analysis, both monomorphic and polymorphic peaks were considered in the matrix. Only visually distinct and reproducible peaks were considered for data analysis.
Principal component analysis (PCA) and Unweighted Pair Group Method with Arithmetic mean (UPGMA) clustering analysis were performed with NTSYS-pc v2.10 software using Jaccard's similarity coefficients and SAHN module [16,17]. The FST distance and Nei distance matrices were calculated in AFLP-SURV v1.0 by performing 1000 bootstrap replicates [18]. Shannon's diversity index (I) [19] and Nei's gene diversity (H) [20] were calculated using POPGENE32 version 1.32 assuming a Hardy–Weinberg equilibrium [21].
A Bayesian structure analysis was performed on the entire data set using Parallel Structure program to test the genetic admixture across species boundaries [22]. The range of genetically distinct clusters (K) was set from 1 to 18. The model was run for 10 independent simulations for each K applied with a burn-in length of 100,000 and a run length of 1,000,000 Markov Chain Monte Carlo (MCMC) replicates after burn-in [23,24]. The true K was detected using the structure harvester program [25]. Permutations of the most likely results among different runs for each K were conducted using CLUMPP software by applying a greedy method [26]. The structure results were visualized using DISTRUCT program [27].
The geographic distance matrix was calculated using a geographic distance calculator. The Mantel test was performed to evaluate the correlation between the genetic (FST) and the geographic distance matrix using Isolation By Distance Web Service Version 3.23 [28].
3 Results
In the present study, 87 individuals from 18 Chlorophytum species populations were used for AFLP analysis. Out of the 64 screened primer combinations, 15 primer combinations were observed to successfully produce scorable, clear high-intensity, reproducible and relatively high polymorphic bands (99.22 to 100%) (Table 2). All the intraspecies accessions of Chlorophytum were found to be very close and had a very low level of molecular diversity compared to interspecies accessions on the basis of the similarity coefficient. Hence, only interspecies relations between 18 species of Chlorophytum were further considered. A total of 4782 bands were produced by 15 AFLP primer combinations having 4778 polymorphic bands (99.91%). The number of polymorphic loci scores was found to range from 128 to 470 with the spectrum of proportion of polymorphic loci from 99.22 to 100% for each primer pair combined (Table 2). The percentage of polymorphic bands (PPB), Nei's gene diversity (H) and Shannon's diversity index (I) at the species level were found to be 99.91%, 0.2085, and 0.3592, respectively.
For all 18 populations of the Chlorophytum species, pairwise genetic distances were calculated. The genetic distance between population pairs ranged from 0.5889 to 0.8919. The genetic distance was the highest (0.8919) between C. laxum and C. borivilianum, while the lowest (0.5889) was occurring between C. glaucum, and C. gothanense (Kondushi Plateau). Nei's genetic distance between population pairs was varied from 0.2003 and 0.4415 (Table 3). Jaccard's similarity coefficients among different populations were varied from 0.1164 to 1.00, which indicated a high level of genetic variation within 18 species. The UPGMA dendrogram was obtained using SHAN program with Jaccard's similarity coefficients, and revealed three major clusters (Fig. 2a). Cluster I was comprised of two species, namely C. kolhapurense and C. bharuchae, which were also observed to be morphologically very similar. Cluster II was the largest group, with 14 species, whereas cluster III had two species, namely C. laxum and C. tuberosum. This population structure was tested using a model-based clustering method with STRUCTURE program. Using a Bayesian statistics, the value for K = 3 was selected at the highest likelihood value of the data [LnP(D)] and the maximum ΔK (Fig. 3). The value of K suggests that all species fell into three main clusters as in the dendrogram (Fig. 2b). PCA analysis was performed to further confirm the clustering pattern and to group the species obtained from the dendrogram (Fig. 4).
Genetic distance (above the diagonal) and Nei's genetic distance (below the diagonal).
| Population | C1 | C2 | C3 | C4 | C5 | C6 | C7 | C8 | C9 | C10 | C11 | C12 | C13 | C14 | C15 | C16 | C17 | C18 |
| C1 | – | 0.8516 | 0.8835 | 0.8517 | 0.7621 | 0.8464 | 0.8602 | 0.8697 | 0.8561 | 0.8527 | 0.856 | 0.8535 | 0.853 | 0.852 | 0.8615 | 0.8562 | 0.836 | 0.8565 |
| C2 | 0.3646 | – | 0.865 | 0.7768 | 0.8203 | 0.7407 | 0.8398 | 0.8237 | 0.8243 | 0.7831 | 0.771 | 0.7622 | 0.7739 | 0.7863 | 0.8292 | 0.7635 | 0.7869 | 0.8328 |
| C3 | 0.2871 | 0.2877 | – | 0.8609 | 0.885 | 0.8625 | 0.8918 | 0.8789 | 0.8732 | 0.8725 | 0.8655 | 0.858 | 0.8535 | 0.8594 | 0.7597 | 0.8602 | 0.8584 | 0.8831 |
| C4 | 0.386 | 0.3303 | 0.3045 | – | 0.8137 | 0.7482 | 0.841 | 0.821 | 0.8226 | 0.7863 | 0.7677 | 0.7784 | 0.7849 | 0.7408 | 0.8139 | 0.7252 | 0.7494 | 0.8157 |
| C5 | 0.3317 | 0.3993 | 0.3552 | 0.4128 | – | 0.8208 | 0.8324 | 0.8471 | 0.8303 | 0.8196 | 0.8183 | 0.8221 | 0.8207 | 0.826 | 0.8324 | 0.8129 | 0.8115 | 0.8329 |
| C6 | 0.388 | 0.3063 | 0.3126 | 0.3286 | 0.4278 | – | 0.8376 | 0.8058 | 0.824 | 0.7711 | 0.77 | 0.6872 | 0.7805 | 0.7737 | 0.8258 | 0.7704 | 0.7555 | 0.8177 |
| C7 | 0.3788 | 0.3734 | 0.313 | 0.3955 | 0.4181 | 0.3993 | – | 0.8215 | 0.8403 | 0.8376 | 0.8356 | 0.8406 | 0.8393 | 0.8188 | 0.8602 | 0.8193 | 0.832 | 0.8451 |
| C8 | 0.3949 | 0.3643 | 0.3097 | 0.3818 | 0.4415 | 0.3737 | 0.368 | – | 0.7962 | 0.8228 | 0.8142 | 0.8287 | 0.8143 | 0.8163 | 0.8373 | 0.8139 | 0.8218 | 0.8406 |
| C9 | 0.3549 | 0.3405 | 0.2803 | 0.3585 | 0.3959 | 0.3665 | 0.3603 | 0.3277 | – | 0.8252 | 0.8051 | 0.8192 | 0.8137 | 0.8214 | 0.849 | 0.8158 | 0.8164 | 0.8392 |
| C10 | 0.3719 | 0.3233 | 0.2989 | 0.3437 | 0.4045 | 0.3365 | 0.3773 | 0.3694 | 0.347 | – | 0.762 | 0.7675 | 0.7837 | 0.7777 | 0.8419 | 0.783 | 0.7917 | 0.8258 |
| C11 | 0.3596 | 0.3013 | 0.2796 | 0.3154 | 0.3883 | 0.3231 | 0.3606 | 0.3473 | 0.3166 | 0.2992 | – | 0.7654 | 0.7523 | 0.7681 | 0.8321 | 0.7835 | 0.7688 | 0.832 |
| C12 | 0.349 | 0.2882 | 0.2669 | 0.3172 | 0.384 | 0.2554 | 0.357 | 0.3524 | 0.3204 | 0.2969 | 0.2836 | – | 0.7869 | 0.7857 | 0.8233 | 0.7938 | 0.7661 | 0.8376 |
| C13 | 0.3441 | 0.2933 | 0.26 | 0.3188 | 0.3784 | 0.3212 | 0.3515 | 0.3357 | 0.3121 | 0.3056 | 0.271 | 0.2889 | – | 0.7838 | 0.8134 | 0.7939 | 0.7563 | 0.8231 |
| C14 | 0.3724 | 0.327 | 0.2907 | 0.3066 | 0.4126 | 0.3397 | 0.3608 | 0.3644 | 0.3448 | 0.3249 | 0.3049 | 0.3119 | 0.3067 | – | 0.8106 | 0.5889 | 0.7674 | 0.8234 |
| C15 | 0.3698 | 0.3541 | 0.22 | 0.3597 | 0.4081 | 0.3777 | 0.3893 | 0.3734 | 0.3586 | 0.3717 | 0.348 | 0.3327 | 0.3205 | 0.3444 | – | 0.8191 | 0.8114 | 0.8437 |
| C16 | 0.3817 | 0.3125 | 0.2961 | 0.2981 | 0.4037 | 0.3411 | 0.366 | 0.3669 | 0.3446 | 0.3337 | 0.3214 | 0.3227 | 0.319 | 0.2003 | 0.3566 | – | 0.7562 | 0.8131 |
| C17 | 0.3286 | 0.302 | 0.262 | 0.2902 | 0.3683 | 0.3003 | 0.3439 | 0.341 | 0.3131 | 0.3108 | 0.2815 | 0.2732 | 0.2633 | 0.2933 | 0.3178 | 0.2889 | – | 0.8199 |
| C18 | 0.3679 | 0.3598 | 0.2993 | 0.3638 | 0.4113 | 0.3725 | 0.3773 | 0.3793 | 0.3523 | 0.3593 | 0.3505 | 0.3474 | 0.3308 | 0.3582 | 0.3661 | 0.3536 | 0.3271 | – |
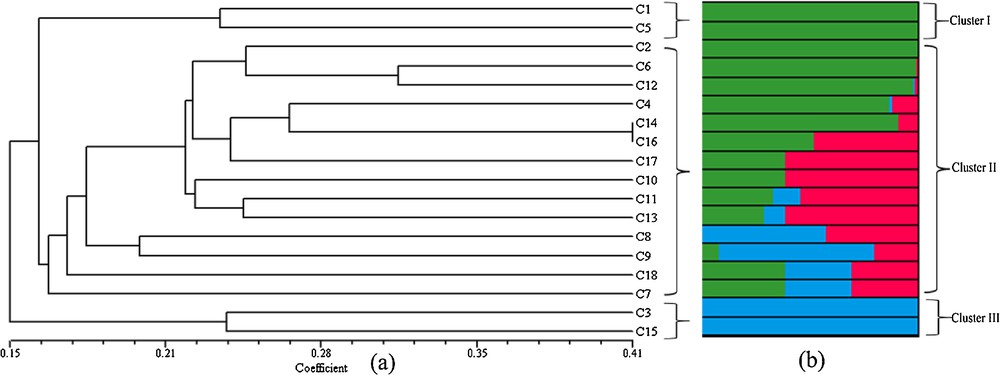
(Colour online.) (a) Unweighted Pair Group Method with Averaged tree of 18 species of genus Chlorophytum based on Jaccard's coefficient and (b) genetic relationship among genus Chlorophytum using a Bayesian analysis of the population structure at K = 3; for species accession numbers, refer to Table 1.
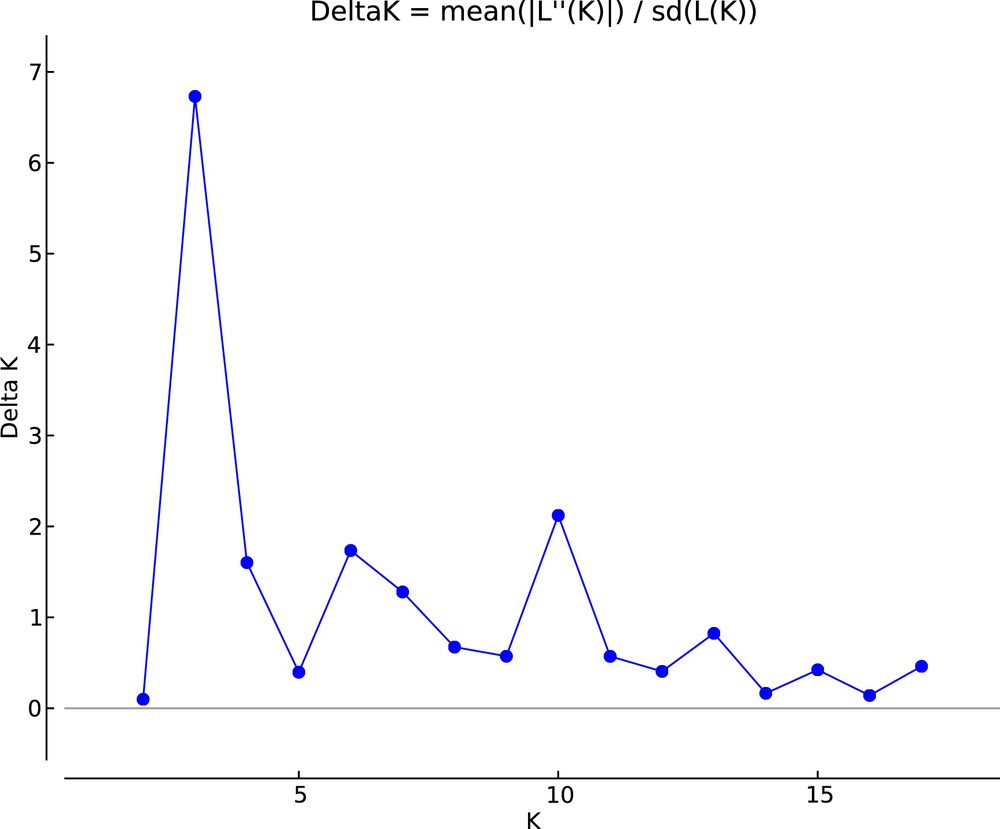
Bayesian structure analysis, values of ΔK detecting the true value of K for the three groups.
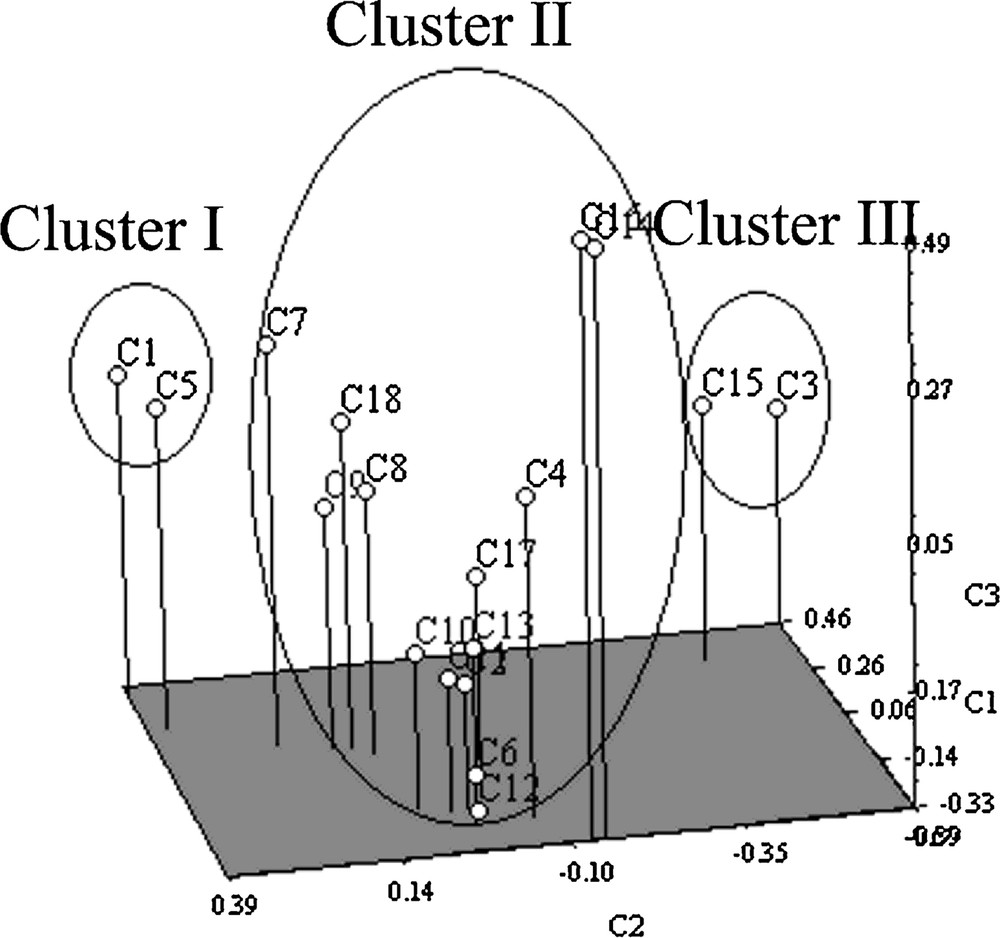
Principal component analysis based on Amplified Fragment Length Polymorphisms data; for species accession numbers, refer to Table 1.
The Mantel test indicated a weak and positive relationship between geographic and genetic distance matrices (r = 0.1544; P > 0.05) when all species were considered in the analysis. This result did not indicate any significant correlation between genetic differentiation and geographical distance within this species (Fig. 5). On the other hand, the Mantel test of the species of cluster II revealed a significant, positive and strong correlation (r = 0.4432; P > 0.05). The FST value was observed to be 0.8887 (P < 0.001), indicating species highly isolated from one another.
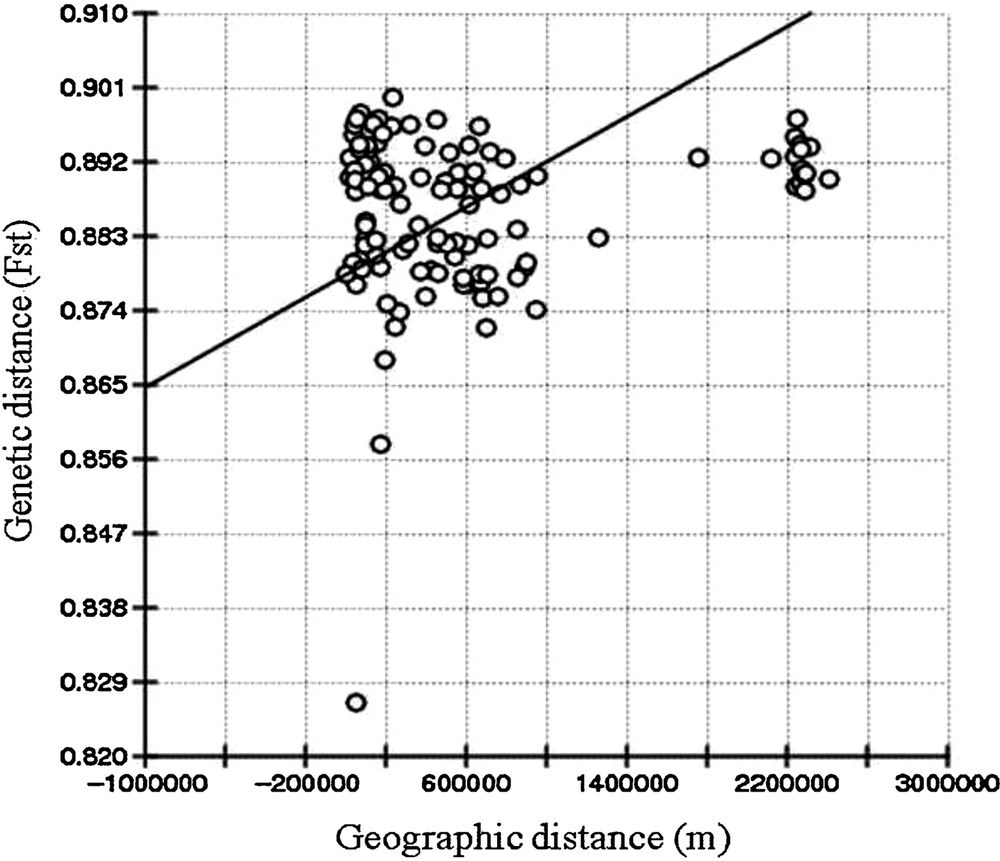
Correlation between pairwise FST and pairwise geographic distance among species of genus the Chlorophytum calculated by Mantel's test.
4 Discussion
Understanding genetic diversity and correct identification is a crucial step for species conservation [29]. The potential of adaptation and survivability of a species depends upon assessments of genetic diversity [30]. In the case of medicinally important and endangered species like Chlorophytum, the knowledge of genetic diversity and variation is very important to design effective management and conservation strategies. Molecular markers like AFLP act as significantly reliable tools for identifying genetic differentiation in plants at the genetic level [15,31–34]. AFLP is proven to be a very useful and efficient method for species discrimination and to study the genetic diversity in Chlorophytum. Since a very limited number of reports are available on the identification and the genetic diversity among the genus Chlorophytum using molecular markers, this study contributes a useful and robust method to authentication.
In an earlier study, the genetic diversity of 34 C. borivilianum accessions was analysed using the AFLP marker, which revealed a very low intraspecies genetic diversity [9]. In the present work, similar results were observed. The interspecies genetic distance was very high when compared to intraspecies genetic distance in 18 species of the genus Chlorophytum. The selected 15 pairs of AFLP markers gave 99.91% polymorphic bands when tested on 18 Chlorophytum species. It indicated that the species well diverge from each other, having high genetic diversity. This must have occurred because of the low rate of gene flow. The high interspecies genetic diversity and low intraspecies diversity observed indicated that AFLP markers can be used for unambiguous species identification. In the present study, AFLP permits more accurate, simple and rapid species discrimination compared to traditional taxonomy-based methods.
UPGMA dendrogram, PCA clustering and Bayesian method analysis produced similarly three different clusters, i.e. cluster analysis is effective and gives reliable results for Chlorophytum species classification. The species in cluster I, C. kolhapurense and C. bharuchae, are very similar morphologically, with the same basic chromosome number (x = 8) [1,35]. These species are found at relatively close geographic locations and, because of their phenotypic plasticity, are very difficult to identify based on their morphological characters. Similarly, a very close relationship between cluster III, C. tuberosum and C. laxum was observed. These plants also have the same basic chromosome number (x = 8) and total chromosome number (2n = 16) [1,35]. The species in cluster III showed polyploidy, with the same basic chromosome number (x = 7) but varying in their total chromosome number (2n = 14 to 84) [6,36,37]. In the dendrogram, the species in cluster III were grouped according to their total chromosome number. The species C. heynei and C. amaniense grouped together and had similar total chromosome numbers (2n = 14). These species were also observed to be morphologically very similar in nature. The species having total chromosome number (2n = 42) were grouped together, except C. indicum whose total chromosome number is 2n = 84. According to genetic distance and morphological data analysis, it was concluded that C. indicum may have evolved from C. malabaricum. Similarly, C. nepalense (2n = 56) may have evolved from C. borivilianum (2n = 28) [2,13,38].
The result of Mantel's test, when considering the geographic distances between all species, is not significantly correlated with the genetic distance, thus does not support an isolation by distance pattern [39–41]. On the other hand, a high value of the FST distance indicates rare exchanges of genetic material in these plant species [42] and less probability of interspecies hybridization. In the genus Chlorophytum, the mode of seed dispersal is unspecialised, which leads to ineffective seed dispersal occurring over long distances, so gene flow through seeds is constrained [43]. This indicates two possibilities (behavioural reproductive isolation and mainly asexual reproduction) in the Indian subcontinent [44]. These factors contribute to the high genetic polymorphism, the genetic uniformity, the low gene flow, and the weak correlation between genetic and geographic distances between the species of the genus Chlorophytum [45,46]. The three distinct clusters obtained by UPGMA dendrogram, PCA clustering and Bayesian analysis were strongly supported by morphological and cytological data. The AFLP analysis proved to be a reliable method to study genetic diversity and genetic relationship among the Chlorophytum species. The Mantel test of the species in cluster III revealed a significant correlation in genetic and geographic distances. The result from clustering shows that species from close regions clustered together. This indicates that the species in the three clusters evolve separately; there must have been rare events of hybridization and have very low gene flow between these clusters.
5 Conclusion
Understanding the genetic diversity at the molecular level will help to design better conservation strategies for endangered Chlorophytum species. AFLP markers showed a high level of polymorphic bands at the interspecies level compared to the intraspecies level in the genus Chlorophytum. Thus, all species of the genus Chlorophytum must be conserved to maintain the total genetic diversity. The robustness and suitability of AFLP markers makes them the most reliable molecular ones to identify and study the genetic relationship among the species of the genus Chlorophytum. Appropriate identification of Chlorophytum species can avoid habitat destruction and exploitation of wild species. The species of the genus Chlorophytum of the Indian subcontinent showed a very high genetic diversity, a restricted gene flow and a separate mode of evolution in the three clusters. The data will contribute to the screening, the cultivation and the conservation of the genus Chlorophytum and will be potentially useful to authenticate medicinal plants.
Disclosure of interest
The authors declare that they have no competing interest.
Acknowledgements
Authors gratefully acknowledge the financial support from the DBT-Interdisciplinary Program of Life Sciences for Advanced Research and Education (BT/PR4572/INF/22/147/2012) and UGC-Special Assistance Program (SU/EST/PG/1328) funded by the Government of India.