

1 Introduction
The Raman effect was first detected in 1928, rapidly becoming the basis of the key technique for providing vibrational information on molecules, ions and lattice structures for the next ca 20 years. However, the technique was slow, as it involved the use of a mercury arc as source and photographic plates for detection. With the introduction in the 1960s of lasers as monochromatic polarised light beams of high irradiance and of semiconductors as detectors (e.g. GaAs) the ability to detect weak Raman signals increased markedly. Consequently, the technique became increasingly applied to a wide variety of chemical problems amenable to analysis with a micro-sampling configuration [1]. The theory of Raman spectroscopy has been well set out by Long [2].
In the past 25 years, and especially in the last decade, the technique has been increasingly applied with great effect to the analysis of micrometre-sized particles using optical microscopes interfaced with existing spectrometer systems. These developments have revolutionised the usage of the technique, which is now seen to have many unique advantages over infrared (IR) microscopy and other techniques for sample analysis [3].
The intrinsic weakness of the Raman effect (in the absence of resonance effects) [4] and the moderate sensitivity of even semiconductors or multichannel intensified diode arrays as detectors were still not ideal features of Raman microscopy for many applications. However, the introduction of charge coupled device (CCD) detectors over the past decade has made it fully feasible to detect and identify even poor Raman scatterers of micrometre dimensions and, by change of excitation line, even many fluorescent materials.
One of the many areas that have been opened up by Raman microscopy is that of pigment identification. It is now recognised that the technique combines the attributes of high reproducibility and high sensitivity with those of being non-destructive and of providing data that are essentially immune to interference from either binders or other pigments. Moreover, the technique can be applied in situ, an important consideration for manuscript study. It also has high spatial resolution (≤ 1 μm) and high spectral resolution (≤ 1 cm–1). These features are all of obvious value for establishing the composition of pigment mixtures on artwork.
There are two key reasons for conservators and restorers to be concerned with pigment identification. The first is to ensure that all restoration is carried out with the original pigment and not with alternatives of similar hue. This is important because the alternatives may be liable to react with contiguous pigments with disastrous visual effects. The second is to identify any degradation products of pigments and to suggest possible treatments whereby degradation processes may be either arrested or reversed. Moreover, it is increasingly likely that auction houses will be required to authenticate works of art that they are selling. One way of checking for obvious fakes is to establish the palette and check that no pigments of inappropriate dates of first manufacture or usage are present. Such authentication is extremely important in view of the immense prices — often > £ 1 million — for which medieval manuscripts and codices can be sold.
This account [5] begins with a brief comment on the range of pigments traditionally used to illuminate artefacts throughout time, and then moves on to a discussion of various case histories in which knowledge of the pigments present and of their degradation products has proved to be of interest to both the arts and the science communities. The account is focussed on research carried out at University College London, and does not attempt a complete review of the literature.
2 The common pigments
The colours of inorganic pigments arise in most cases from ligand field, charge transfer or intervalence charge transfer transitions, and in the case of metals — commonly for silver or gold — they arise from specular reflectance [6]. The depth of colour of inorganic pigments is related both to the molar decadic absorption coefficients of transitions in the visible region of the spectrum and to the dimensions of the pigment particles. The particle dimensions affect the balance between diffuse reflectance, which is controlled by the absorption coefficients and bandwidths, and specular reflectance that is controlled by complementary factors [7]. Early artists were well aware of these effects and, with a restricted palette, could often achieve a wide range of hue by selective control of the particle sizes of pigments — notably the blue pigments.
Many listings of standard inorganic pigments are given in books [8–14] and proprietary literature, and also in a recent handbook [15]. By way of illustration, the commonly used inorganic pigments are listed in tables 1–7, together with their chemical names, formulae, and dates of first known use, together — in table 2 only — with an indication as to the nature of the electronic transitions principally responsible for the blue colour in each case. Of course, the identification of blue pigments alone would only be of very restricted value for dating purposes, and so extensive studies of all of the pigmentation on artwork is essential in order to be able to estimate the date of production of any particular item.
Black inorganic pigments.
| Pigment | Chemical name | Formula | Date |
| Ivory blacka | calcium phosphate + carbon | Ca3(PO4)2 + C + MgSO4 | 4th c. BC? |
| Lamp black | amorphous carbon | C | 3 000 BC |
| Galena | lead(II) sulfide | PbS | mineral b |
| Magnetite | iron(II/III) oxide | Fe3O4 | mineral |
| Metacinnabar | mercury(II) sulfide | HgS | mineral c |
| Mineral black | aluminium silicate + carbon (30%) | Al2O3·n SiO2 + C | mineral |
| Plattnerite | lead(IV) oxide | PbO2 | mineral b |
| Pyrolusite | manganese(IV) oxide | MnO2 | mineral |
| Tenorite | copper(II) oxide | CuO | mineral |
| Vine black | carbon | C | Roman |
a Bone black is similar to ivory black.
b Found in artwork as a decomposition product of other lead pigments, notably white lead.
c Only found as a decomposition product of red mercury(II) sulfide (cinnabar).
Blue inorganic pigments.
| Pigment | Chemical Name | Formula | Datea | Transitionb |
| Azurite | basic copper(II) carbonate | 2 CuCO3·Cu(OH)2 | min. | LF |
| Cerulean blue | cobalt(II) stannate | CoO·n SnO2 | 1821 | LF |
| Cobalt blue | cobalt(II)-doped alumina glass | CoO·Al2O3 | 1775 | LF |
| Egyptian blue | calcium copper(II) silicate | CaO·CuO·4 SiO2 | ca 3100 B.C. | LF |
| Fluorite (and antonozite) | calcium floride | CaF2 | min. (purple) | ? |
| Lazurite (from lapis lazuli) | sulfur radical anions in a sodium aluminosilicate matrix | Na8[Al6Si6O24]Sn | min./1828 | S3– CT |
| Manganese blue | barium manganate(V) sulfate | Ba(MnO4)2 + BaSO4 | 1907 | LF |
| Maya blue | palygorskite + indigo + nanoparticulate metals and oxides | Mg5(Si,Al)8O20(OH)2·8 H2O etc. | Mayan | Mie scattering c |
| Phthalocyanine blue (Winsor blue) | copper(II) phthalocyanine | Cu(C32H16N8) | 1936 | π–π* d |
| Posnjakite | basic copper(II) sulfate | CuSO4·3 Cu(OH)2·H2O | min. | LF |
| Prussian blue | iron(III) hexacyanoferrate(II) | Fe4[Fe(CN)6]3·14–16 H2O | 1704 | IVCT (Fe(II)/Fe(III)) |
| Smalt | cobalt(II) silicate | CoO·N SiO2 (+ K2O + Al2O3) | ∼ 1500 | LF |
| Vanadium blue | vanadium(IV)-doped zircon | ZrSiO4(V(IV)) | 1950? | LF |
| Verdigris | basic copper(II) acetate | Cu(O2CCH3)2·2 Cu(OH)2 | min. | LF |
| Vivianite | iron(II) phosphate hydrate (partially oxidised) | Fe3P2O8·8 H2O | min. | IVCT (Fe(II)/(II)) |
a The pigment is either specified to be a mineral (min.), and/or the date of its first manufacture is listed.
b LF = ligand field transition; CT = charge transfer transition; IVCT = intervalence charge transfer transition.
c The origin of the colour is uncertain: José-Yacamán M., Rendon L., Arenas J., Serra Puche M.C., Science 273 (1996) 223.
d π–π* = electric-dipole-allowed charge-transfer transition of the phthalocyanine ring system.
Brown/orange inorganic pigments.
| Pigment | Chemical Name | Formula | Date |
| Cadmium orange | cadmium selenosulfide | Cd(S,Se) or CdS (> 5 μm) | late 19th c. CdS ca 1845 |
| Ochre (goethite) a | iron(III) oxide hydrate | Fe2O3.H2O + clay, etc. | mineral |
| Sienna (burnt) a | iron(III) oxide | Fe2O3 + clay, etc. | antiquity? |
a A detailed discussion of these pigments is given in [20].
Green inorganic pigments.
| Pigment | Chemical name | Formula | Date |
| Atacamite | basic copper(II) chloride | CuCl2·3 Cu(OH)2 | mineral |
| Chromium oxide | chromium(III) oxide | Cr2O3 | early 19th c. |
| Cobalt green | cobalt(II) zincate | CoO·n ZnO | 1780 |
| Emerald green | copper(II) arsenoacetate | Cu(C2H3O2)2·3 Cu(AsO2)2 | 1814 |
| Green earth – a mix of celadonite and glauconite | hydrous alumino-silicate of magnesium, iron and potassium | variations on K[(AlIII,FeIII)(FeII,MgII)], (AlSi3,Si4)O10(OH)2 | mineral |
| Malachite | basic copper(II) carbonate | CuCO3·Cu(OH)2 | mineral |
| Permanent green deep | hydrated chromium(III) oxide + barium sulfate | Cr2O3·2 H2O + BaSO4 | latter half 19th c. |
| Phthalocyanine green | copper(II) chlorophthalocyanine | Cu(C32H16–nClnN8) | 1938 |
| Pseudomalachite | basic copper(II) phosphate | Cu3(PO4)2·2 Cu(OH)2 | mineral |
| Scheeleˈs green | copper(II) arsenite | Cu(AsO2)2 | 1775 |
| Verdigris (basic) | basic copper(II) acetate | Cu(C2H3O2)2·2 Cu(OH)2 | mineral and synthetic (BC) |
| Viridian | hydrated chromium(III) oxide | Cr2O3·2 H2O | 1838 (?1850) |
Red inorganic pigments.
| Pigment | Chemical Name | Formula | Date |
| Cadmium red | cadmium(II) selenide | CdSe | ca 1910 |
| Chrome red | basic lead(II) chromate | PbCrO4·Pb(OH)2 | early 19th c. |
| Litharge | lead(II) oxide | PbO | antiquity |
| Mercury scarleta | mercury(II) iodide | HgI2 | ca 1814 |
| Realgar | arsenic(II) sulfide | As4S4 | mineral |
| Red lead (minium) | lead(II,IV) oxide | Pb3O4 | antiquity |
| Red ochre | iron(III) oxide + clay + silica | Fe2O3·H2O + clay + silica | mineral |
| Vermilion (cinnabar)b | mercury(II) sulfide | HgS | mineral and synthetic (13th c.) |
a This pigment has a significant vapour pressure and so evaporates from a painting unless sealed into a binder.
b Limited lightfastness (→ black form). Cinnabar is the name of the mineral, vermilion is that of the synthetic form.
White inorganic pigments.
| Pigment | Chemical Name | Formula | Date |
| Anatase | titanium(IV) oxide | TiO2 | 1923 |
| Anglesite | lead(II) sulfate | PbSO4 | mineral |
| Anhydrite | calcium sulfate | CaSO4 | mineral |
| Barytes | barium sulfate | BaSO4 | mineral |
| Bone white | calcium phosphate | Ca3(PO4)2 | antiquity |
| Cerussite | lead(II) carbonate | PbCO3 | mineral |
| Chalk (whiting) | calcium carbonate | CaCO3 | mineral |
| Gypsum | calcium sulfate hydrate | CaSO4·2 H2O | mineral |
| Huntite | magnesium calcium carbonate | Mg3Ca(CO3)4 | mineral |
| Kaolin | layer aluminosilicate | Al2(OH)4Si2O5 | mineral |
| Lead white | lead(II) carbonate (basic) | 2 PbCO3·Pb(OH)2 | mineral and synthetic (500–1500 BC) |
| Lithopone | zinc sulfide and barium sulfate | ZnS + BaSO4 | 1874 |
| Rutile | titanium(IV) oxide | TiO2 | 1947 |
| Zinc white | zinc oxide | ZnO | 1834 |
Yellow inorganic pigments.
| Pigment | Chemical name | Formula | Date |
| Barium yellow | barium chromate | BaCrO4 | early 19th c. |
| Cadmium yellow | cadmium sulfide | CdS | mineral (greenockite) + synthetic ca 1845 |
| Chrome yellow | lead(II) chromate | PbCrO4 or PbCrO4·2 PbSO4 | 1809 |
| Cobalt yellow (aureolin) | potassium cobaltinitrite | K3[Co(NO2)6] | 1861 |
| Lead antimonate yellow | lead(II) antimonate | Pb2Sb2O7 | 1500 BC |
| Lead tin yellow | lead(II) stannate | [I] Pb2SnO4 [II] PbSn0.76Si0.24O3 | antiquity? antiquity? |
| Massicot | lead(II) oxide | PbO | antiquity |
| Yellow ochre | goethite + clay + silica | Fe2O3.H2O + clay + silica | mineral (and synthetic) |
| Orpiment | arsenic(III) sulfide | As2S3 | mineral |
| Pararealgar | arsenic(II) sulfide | As4S4 | ca 1220a |
| Strontium yellow | strontium chromate | SrCrO4 | early 19th c. |
| Zinc yellow | zinc chromate | ZrCrO4 | early 19th c. |
a Known to be formed by photochemical degradation of realgar. Not recognised to be a mineral until 1980. Roberts A.C., Ansell H.G., Bonardi M., Can. Mineral. 18 (1980) 525.
There were also many dyes extracted from plants through the ages for use on illuminations of all sorts, notably indigo from woad for blue, alizarin and madder for red, luteolin and weld for yellow, crocetin from saffron and gamboge from gum resin — both also for yellow (table 8). In addition, organic dyes were extracted from marine life, e.g. Tyrian purple (6,6’–dibromoindigo) from molluscs and sepia from cuttlefish; from animal life e.g. Indian yellow from cow urine; and from lichens [15]. Since the isolation by Perkin in 1856 of mauveine, the first synthetic dye, many hundreds of other organic dyes have been synthesised and this has transformed the nature of the palette to which artists have had access. The main concerns in the examination of a work of art are:
Organic pigments and dyes (primarily natural products).
| Pigment | Chemical Name | Formula | Date |
| Blue | indigo | indigotin C16H10N2O2a | plant leaf (BC) synthetic (ca 1880) |
| Black | bitumen | mixture of hydrocarbons | (BC) |
| Brown | sepia | melaninb | ink of cuttlefish (ca 1880) |
| van Dyck brown | humic and huminic acids, allomelaninsc | lignite containing manganese (16th c.?) | |
| Green | sap green | organic dye | buckthorn berry (14th c.?), coal-tar dye |
| Purple | Tyrian purple | 6,6′-dibromoindigotin C16H8Br2N2O2a | marine mollusc (1400 BC) synthetic (1903) |
| Red | carmine | carminic acid C22H20O13d, kermesic acid C16H10O8d | scale insect, cochineal (Aztec) scale insect, kermes (antiquity) |
| madder | alizarin C14H8O4d,e, purpurin C14H8O5d | plant root (3000 BC) synthetic alizarin (1868) | |
| permanent red | quinacridone family | synthetic (after 1856) | |
| Yellow | berberine | berberinium hydroxide C20H19O5N | stems of mahonia etc. (1826)f |
| gamboge | resin, gambogic acid C38H44O8 | gum resin (before 1640) | |
| Hansa yellow | azo dye family | synthetic (ca 1900) | |
| Indian yellow | magnesium salt of euxanthic acid MgC19H16O11.5H2O | cow urine (15th c.) | |
| quercitron | quercitron C21H20O11 | inner bark of Quercus oak | |
| saffron | crocetin C20H24O4g | crocus flower stigma (antiquity) | |
| weld | luteolin C15H10O6 | plant foliage (Stone Age) |
a Indigoid dye.
b Mixture of polyacid polymers of the indole type.
c Mixture of macromolecules having polymeric phenolic structures with the ability to chelate, especially to iron.
d Anthraquinoid dye (carminic acid is a glucosidal derivative).
e Turkey red is the calcium-aluminium lake of alizarin, Ca2Al3(Az)4·xH2O, where Az represents an alizarin molecule minus two hydrogen atoms and x = 3–6. Kiel E.G., Heertjes P.M., J. Soc. Dyers Colour. 79 (1963) 21.
f Berberine (an alkaloid) is the principal colourant in the huangbo dye, of ancient Chinese origin. The Chinese government in 671 AD decreed that paper dyed yellow with huangbo had to be used by government offices. Gibbs P.J., Seddon K.R., Berberine and Huangbo: Ancient Colorants and Dyes, The British Library, London, 1998.
g Carotenoid dicarboxylic acid.
- • to identify the pigment, its crystal structure and, if possible, its place of origin;
- • to assess whether or not it is feasible to restore any damage, given the nature of the chemical processes likely to be involved;
- • to consider whether the knowledge of the identity of the pigments present on a work of art would give an indication as to its date and hence possible authenticity;
- • to consider the correct measures needed to conserve a work of art from the effects of heat, light and gaseous pollutants.
3 The Raman microscope
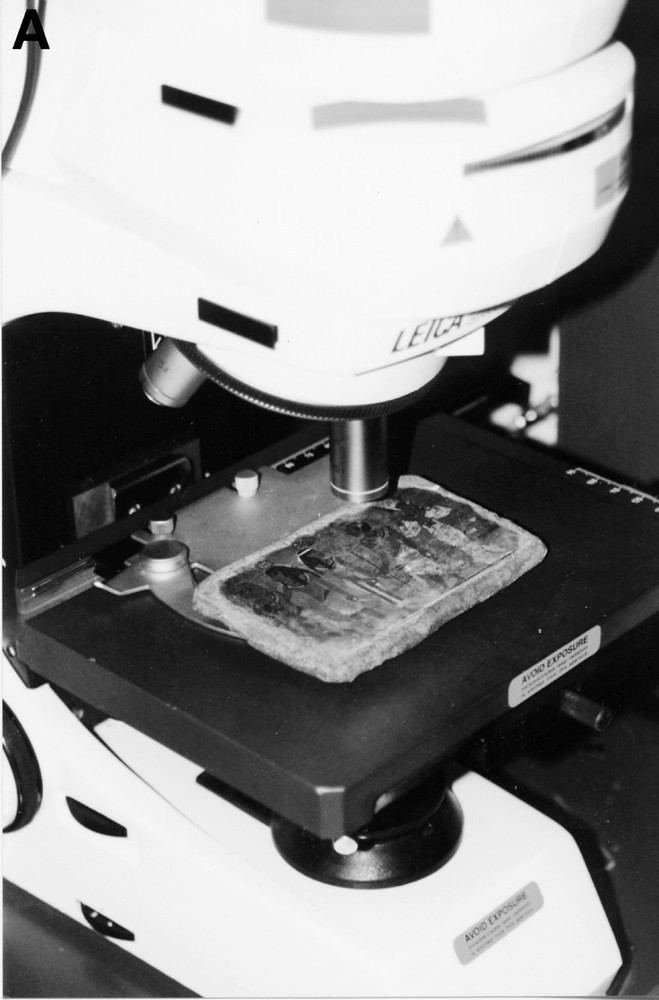
In a Raman microscope, the incident laser beam can be brought to a focus by the objective onto each different pigment grain in turn on the manuscript under study. The Raman scattering is collected by the same objective before being directed by a beam splitter in the optical path to the monochromator and then to the detector (Fig. 1). However, the use of a beam splitter (usually 50/50 or 70/30) reduces the overall efficiency of the system, which results in the need for high-powered lasers and non-optimum collection of the Raman scattering. Moreover, the use of a pinhole as a spatial filter, i.e. as a restriction on the amount of unwanted scatter collected from outside the focal point of the laser beam onto the sample, greatly reduces the efficiency of the collection. The benefit of a pinhole is that it ensures a good confocal arrangement, thereby providing spatial resolution as a function of sample depth [3]. Such a Raman microscope system is shown in operation on a lectionary in Fig. 2.
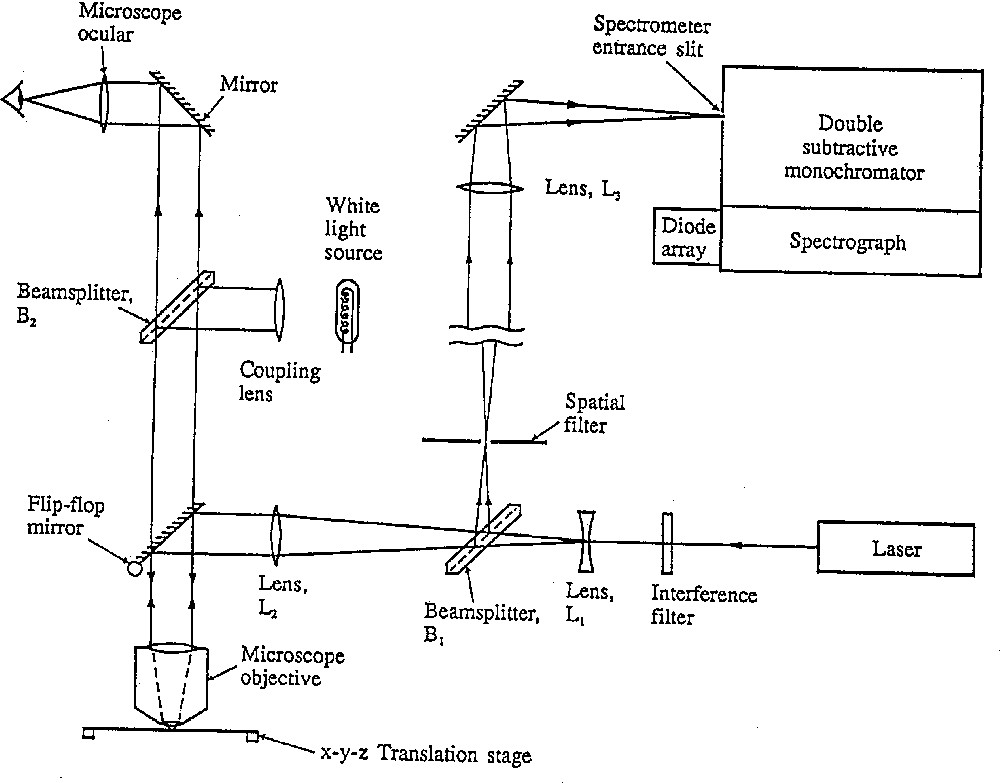
Schematic diagram of the optical configuration of an early Raman microscope system.
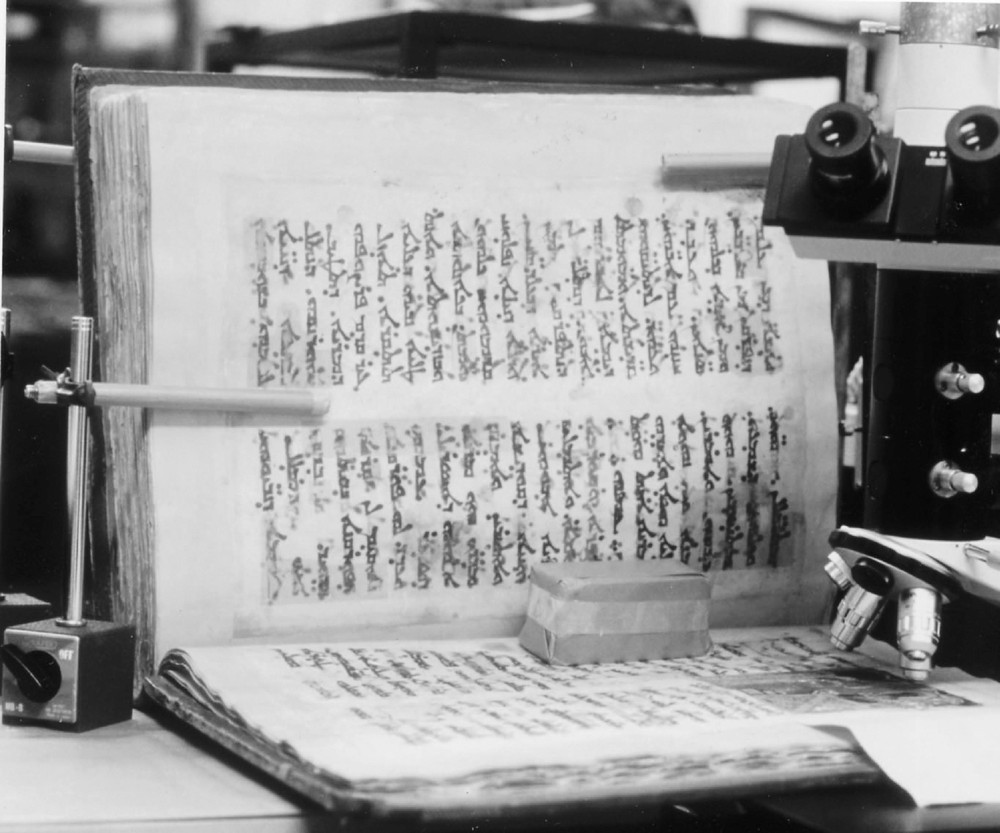
Raman microscope used for the study of a lectionary.
The overall efficiency of detection of the Raman signal from Raman spectrometers such as that described above is still relatively poor, because it is based on double or triple spectrometers with a large number of optical surfaces and on multichannel intensified diode-arrays which are relatively insensitive detectors. However, two further devices have transformed matters yet again: these are (a) two-dimensional CCDs with up to 80% quantum efficiency of detection and (b) holographic notch filters which are wavelength specific and have the property of blocking out the unwanted Rayleigh scattering. These filters possess a cut-off that readily permits approach to within 50 cm–1 or better (at a price!) of the excitation line. This has the consequence that monochromators with the high dispersion previously required to filter out the Rayleigh line could be replaced by a spectrograph system with a single grating only (leading to much greater efficiency of throughput) and holographic notch filters. The introduction of the latter obviates the need for separate pinholes in the optical path. A schematic representation of such a system is shown in Fig. 3.
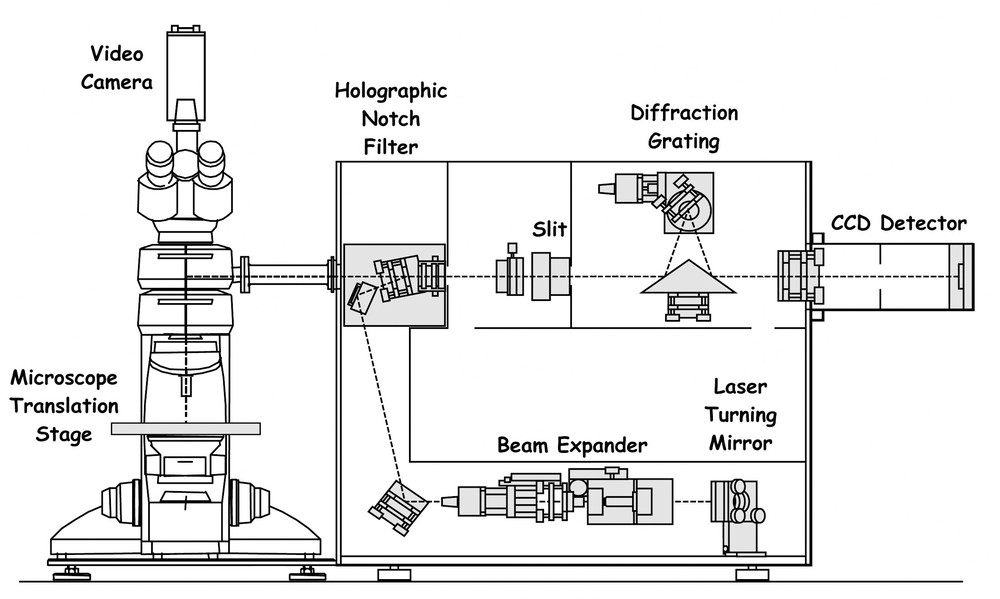
Schematic diagram of a modern Raman spectrograph employing a CCD detector and a holographic notch filter (after the Renishaw Raman system 1000).
The benefits of CCD detector/notch filter spectrographs are that: [3,16] (a) low powered air-cooled lasers can be used, which both reduce the costs of purchase and operation and make the entire system portable (since elaborate water cooling systems are not required), (b) the spectrographs are much lighter than earlier double or triple spectrometer systems, a factor which contributes to their portability, (c) the spectrographs are much quicker to realign than are the above spectrometer systems and (d) the time required to acquire useful data is greatly reduced, in some cases to seconds. Such spectrographs can also be used for remote Raman microscopy in which a probe head assembly both delivers the excitation beam to the sample and collects the scattered radiation via fibre optics. These may be appropriate for the study of heavy items that need support from a specially designed cradle or large items that cannot fit safely onto a microscope stage (Fig. 4).
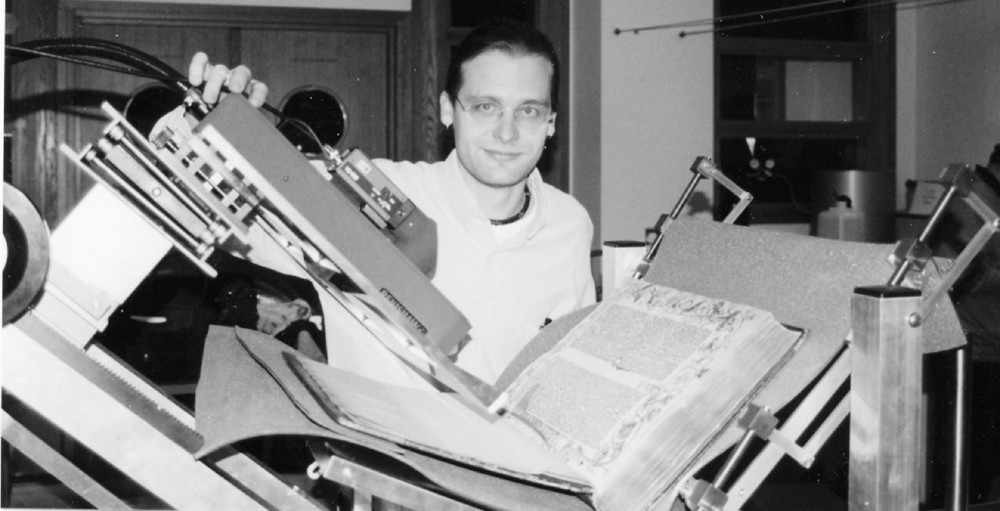
Remote head assembly and book cradle used for the study of heavy works of art, in this case a Gutenberg Bible.
It is now possible to use spectral data taken from many different sample points on an inhomogeneous surface to produce a Raman spectral map. The method involves direct two-dimensional imaging from an inhomogeneous surface by analysing for a Raman band characteristic of a given component on the surface. It offers intriguing further opportunities for the study of very small (ca 1 mm2) areas of artwork on stamps, maps and writing (so as to be able to follow iron gall ink diffusion, paper damage, etc.).
It is highly desirable to have a wide range of excitation lines (frequency νo) available in order to be able to search for the most enhanced Raman spectrum, bearing in mind the often opposing effects on the scattering intensity of ν4 (the fourth power law of light scattering), absorption, resonance effects, and possible photochemical and/or thermal degradation of the sample. Fluorescent materials are often best studied by use of a Nd/YAG (yttrium aluminium garnet) laser operating at 1 064 nm — albeit with significant loss in spatial resolution and scattering intensity.
By use of equipment such as that described above, it has been possible recently to compile libraries of Raman spectra of common inorganic, mineral and earth pigments, organic pigments and dyes [17–21] as well as pigment media (binders, gums, resins etc.) [22], and these are now widely available for reference purposes.
Many other techniques have been, and are, used for pigment analysis, and estimates of their strengths and weaknesses vis-à-vis Raman microscopy are summarised in table 9 [23–26]. Raman microscopy is considered to be the best single technique for this purpose and is very effective indeed if used in conjunction with other complementary techniques such as particle-induced X-ray emission (PIXE) or LIBS. Further techniques, notably nuclear ones such as nuclear reaction analysis (NRA) and Rutherford back scattering (RBA), are also used for pigment studies in laboratories such as that in the Louvre, in which a cyclotron source is available.
Comparison of different techniques for pigment identification.
| Technique | Compound specificity & type of information | Sensitivity | Immunity to interference | Spatial resolution | In situ analysis | Portable |
| Raman | excellent, molecular | gooda | good | excellent (< 1 μm) | ✓ | ✓ |
| IR | excellent, molecular | fair | poor | good (∼ 20 μm) | ✓ | ✓ |
| PLM | fair, molecular | fairb | excellent | excellent (< 1 μm) | × | ✓ |
| UV/VIS | poor, molecular | good | fair | good (∼ 10 μm) | ✓ | ✓ |
| LIBS | good, elemental | excellent | good | good (∼ 20 μm) | ✓ | × |
| XRF | good, elemental | goodc | good | faird (∼ 1 mm) | ✓ | ✓ |
| XPS | good, elemental | goode | good | fair (∼ 1 mm) | ✓ | × |
| PIXE/PIGE | good, elemental | excellentf | good | good (< 1 mm) | ✓ | × |
| SEM/EDX | good, elemental | goode | good | excellent (< 1 μm) | ×g | × |
| XRD | excellent, molecular | fairb | good | poor (∼ 10 mm) | × | × |
Case studies of Western and Eastern manuscripts, painting cross-sections, ceramics, papyri, icons, polychromes and related artefacts are now discussed with particular reference to those carried out at University College London. Raman microscopy of course has wide application to many other fields of study and these matters are discussed elsewhere by Corset et al. [27] and Turrell and Corset [28].
4 Western and Eastern manuscripts
The palette, at least in part, has now been established at University College London for a large number of Western and Eastern manuscripts, notably as follows.
4.1 Western manuscripts
Paris Bible, ca 1275, Latin [29]; North Italian antiphonal, 13th c. [6]; North Italian choir book, 13th c.; Latin manuscripts [30]; German choir book [29]; German manuscripts [31]; illuminated plates from Flora Danica [32]; Skard copy of the Icelandic Book of Law, ca 1360 [33]. It is of interest that no lead-containing pigments — in particular white lead or red lead — were found on the Book of Law, possibly owing to the lack of lead ores in Iceland; bone white and vermilion/red ochre were used instead. A host of other studies has now been carried out in conjunction with the British Library, the Victoria and Albert Museum, the Museum of London and the Beinecke Library, notably on different Gutenberg Bibles, the Lindisfarne Gospels, the Jamnitzer Manuscript and the Vinland Map [34] in order to compare their palettes.
By way of illustration, the Raman spectra of eight inorganic pigments found on a Paris Bible ca 1275 are shown in Fig. 5. Each spectrum can be obtained readily from a pigment grain of less than 1 μm diameter, without interference from any adjacent grain of different composition [29]. The mixing of pigments was, and still is, a common practice among artists in order to obtain tones not necessarily available from single pigments.
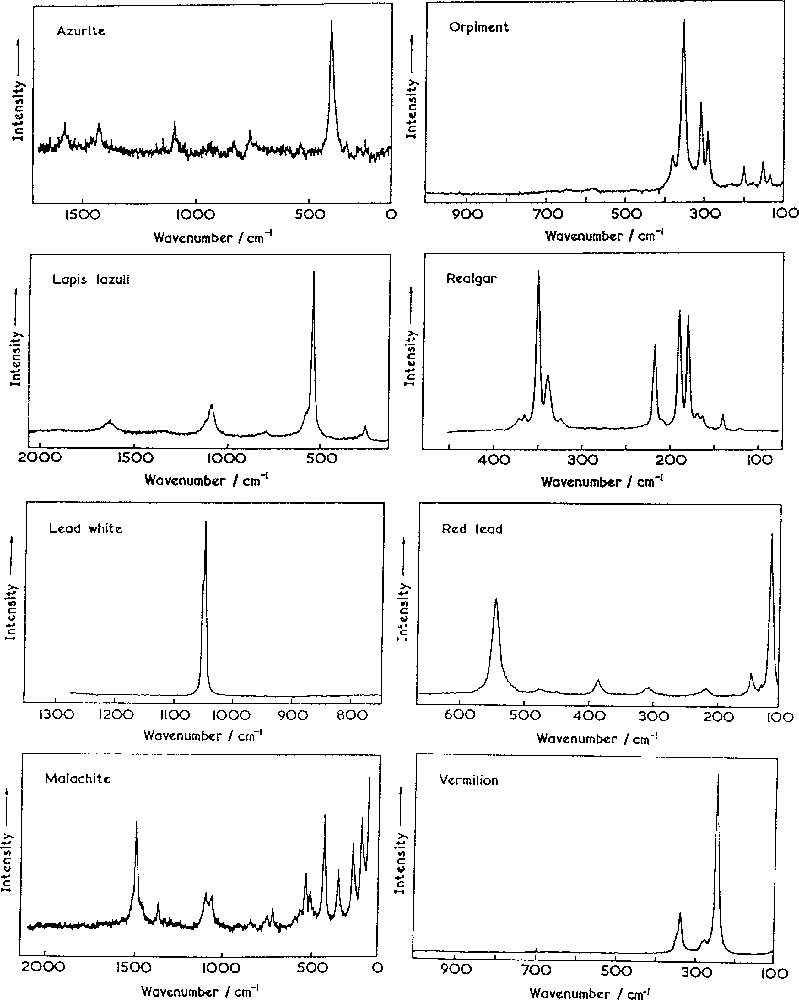
Raman spectra of eight common inorganic pigments found on a Paris bible (ca 1275 AD) [29].
4.2 Eastern manuscripts
Persian manuscripts — “Anatomy of the Body”, 19th c. copy of an earlier manuscript and “Poetry in Praise”, 16th c. [35]; Qazwini manuscript “Wonders of Creation and Oddities of Existence”, 16th c. copies of a late 13th c. encyclopaedic work in Arabic but of Indian style [36]; Qu’ran section, Iran or central Asia, 13th c., eastern Kufic script [37]; Byzantine/Syriac Gospel lectionary, Iraq, 13th c. [38,39]; manuscript and textile fragments from Dunhuang, northwest China, 10th c. [40]; Thai, Javanese, Korean, Chinese and Uighar manuscripts [41].
Interesting scientific problems arise in manuscript studies and can be solved usually by spectroscopic and other techniques. The serious and widespread blackening on the valuable lectionary referred to above [38,39] has been shown to arise from the conversion of white lead, either alone or in admixture with coloured pigments, into black lead(II) sulfide by hydrogen sulfide or another sulfur-containing species (Fig. 6). The latter could arise from atmospheric pollutants, from bacteria, from degradation of adjacent pigments or from pigments on the reverse side of the page containing the illumination in question. The French daily newspaper “Le Monde” (front page), the “New Scientist” and five other scientific magazines were attracted to the problem when the results of the Raman study were first published; one such magazine headlined its article on the subject “Angels with Dirty Faces” [42]. This blackening is a widespread problem in artwork, the reversal of which has posed as many questions as it answers. Treatment of lead(II) sulfide with alkaline hydrogen peroxide generates lead(II) sulfate, which is white. As such, this procedure appears to solve the problem, but whether the resulting pigment will remain permanently attached to the manuscript has yet to be established with certainty.
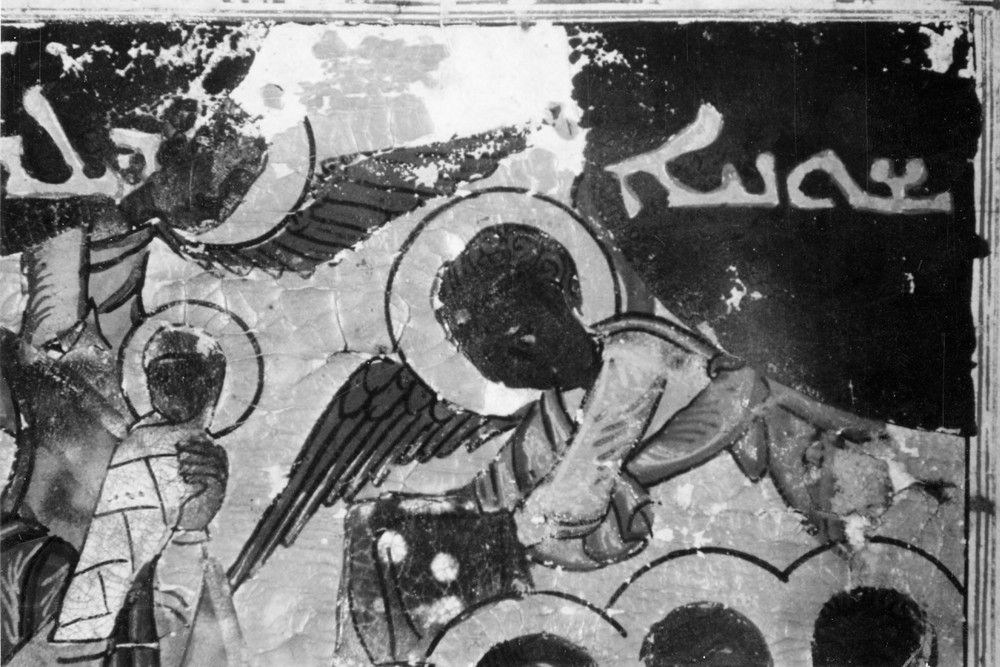
Pigment degradation on folio 231v of a Byzantine/Syriac Gospel lectionary (ca 1220 AD) [35].
The photochemical conversion of the red pigment realgar (As4S4) to yellow pararealgar by light optimally in the wavelength range 530–560 nm is of great interest. The conversion occurs naturally in sunlight and was evidently known in Mesopotamia even in 1220 when pararealgar was applied to the above lectionary as a yellow pigment in addition to, and in distinctly different places from, the much more common yellow pigment orpiment, As2S3 [38,39]. The light-induced transformation of realgar to para-realgar appears to involve, as its first step, the cleavage of an As–As bond.
5 Paintings
It is frequently possible to remove samples from watercolour or oil paintings in such a way that the lacunae are not discernible to the naked eye; such removals are out of the question for manuscripts. Alternatively, the pigments might be able to be sampled from under the frame of a painting or, in the case of codices, from offsets transferred to the opposite page. Studies of pigment cross-sections are also of interest and usually made practicable by setting the cross-sections in resin for stability.
There are, of course, clear advantages to the removal of samples from a work of art in order to identify the pigments. In particular, such a procedure does not involve the removal of the work from its permanent location nor, equally importantly, the removal of delicate and valuable scientific equipment from a laboratory to a library.
Many Raman studies on pigments from paintings have now been made in order to complement those made by infrared spectroscopy and other techniques. Studies of Titian and Veronese paintings at the National Gallery in London have allowed the characterisation of two distinct types of lead tin yellow-type I, Pb2SnO4, and type II, PbSn0.76Si0.24O3, which has a defect pyrochlore structure [43]. These two pigments were in use at different periods of history and have very similar colours: they are, however, readily distinguishable by their Raman spectra.
6 Ceramics
The effective use of Raman microscopy in the study of ceramics was demonstrated in 1997 for the glaze on buried fragments of medieval faience/majolica excavated from the abandoned village of Castel Fiorentino in southern Italy. The studies showed for the first time that lapis lazuli is stable at the firing temperature of the glaze and thus that it could be used as a pigment in Italian glaze; the brown/black pigment used was manganese(IV) dioxide (the latter having been identified by photoelectron spectroscopy) [44,45]. Red-brown sherds of medieval pottery from many sites in Italy have been — not surprisingly — identified to be pigmented with iron oxides, and yellow sherds with hydrated iron(III) oxides [46].
A Raman study on the pigments on Egyptian faience of the XVIIIth dynasty (c. 1350 BC) recovered in 1891 from the Nile Valley by Sir William Flinders Petrie and held at the Petrie Museum, University College London, has revealed that the red sherds are pigmented with red ochre/red earth and the brilliant yellow sherds with lead antimony yellow Pb2Sb2O7, a synthetic pigment [47]. The latter gives a very clear and distinctive Raman spectrum, which is identical to that of a contemporary sample of this pigment.
Similar studies of sherds from an ancient (4300–2800 BC) site in Xishan, Henan, China, indicate that anatase, hæmatite and magnetite were among the pigments used to decorate pottery found at that site [48]. It is now clear that Raman microscopy will be a very valuable technique for compositional and provenance studies on ceramics from sites of archaeological interest.
Raman studies have recently been made of the palettes characteristic of the production of the Sèvres Factory, one relating to coloured glazes/enamels on bisque (1050 °C) and the other on moufle (850 °C) painting colours [49].
7 Papyri
Raman microscopy has been put to good use in detecting fake papyri. Egyptian papyri supposedly dating from the 13th to the 1st centuries BC and brought to London for auction were shown to be illuminated not only with mineral pigments but also with phthalocyanine blue (1935) and green (1936), a Hansa yellow (ca 1950), ultramarine blue — the synthetic form of lazurite (1828), red organic lakes (probably β-naphthols (ca 1939)), and synthetic anatase (1923) [50]. Most of the pigments were thus recognised to be modern. Moreover, they had been painted directly onto the papyri, there being no intervening layer of mineral pigments. These papyri could thus not be ancient.
A genuine papyrus from the Petrie Museum in London was found to be illuminated with carbon, orpiment, iron(III) oxide, malachite and Egyptian blue, but no modern pigments [50]. The importance of proper identification of pigments on artwork for authentication purposes is such that much greater use of the technique of Raman spectroscopy for this purpose can be expected in the future, as purchasers come to expect proper authentication of the artwork placed on sale at auction houses and galleries.
A cleverly constructed fake sold in the Valley of the Kings in Luxor as being from an early period, was rapidly revealed under a microscope to be composed of linen, ceramic and illuminated paper, the last having been generated from an ink jet printer. Rows of red, yellow and blue dots (Fig. 7) rendered this conclusion inescapable, as did the identification by Raman microscopy of the red dye as being a derivative of quinacridone, commonly used in industrial ink-jet printers [51].
a. Supposed early Egyptian artefact under examination by Raman microscopy. b. Magnified section, showing rows of red, yellow and blue dots, which reveal the illuminated part of the artefact to be the product of an ink-jet printer.
8 Icons and polychromes
The combined application of Raman spectroscopy and LIBS has proved to be very effective for the identification of pigments at different depths below the surfaces of painted artworks such as icons and polychromes. LIBS is an atomic emission technique in which an intense nanosecond laser pulse onto the surface of the sample results in the formation of plasma that, upon being allowed to cool, emits radiation characteristic of the elements present (Fig. 8). The technique has high sensitivity and selectivity, and only a minute amount of material is consumed during each pulse [52]. Successive pulses probe deeper into the artwork, so that depth profiling becomes possible. A c.w. laser beam can be used as a Raman probe at each depth and so molecular information relevant to each depth can also be obtained.
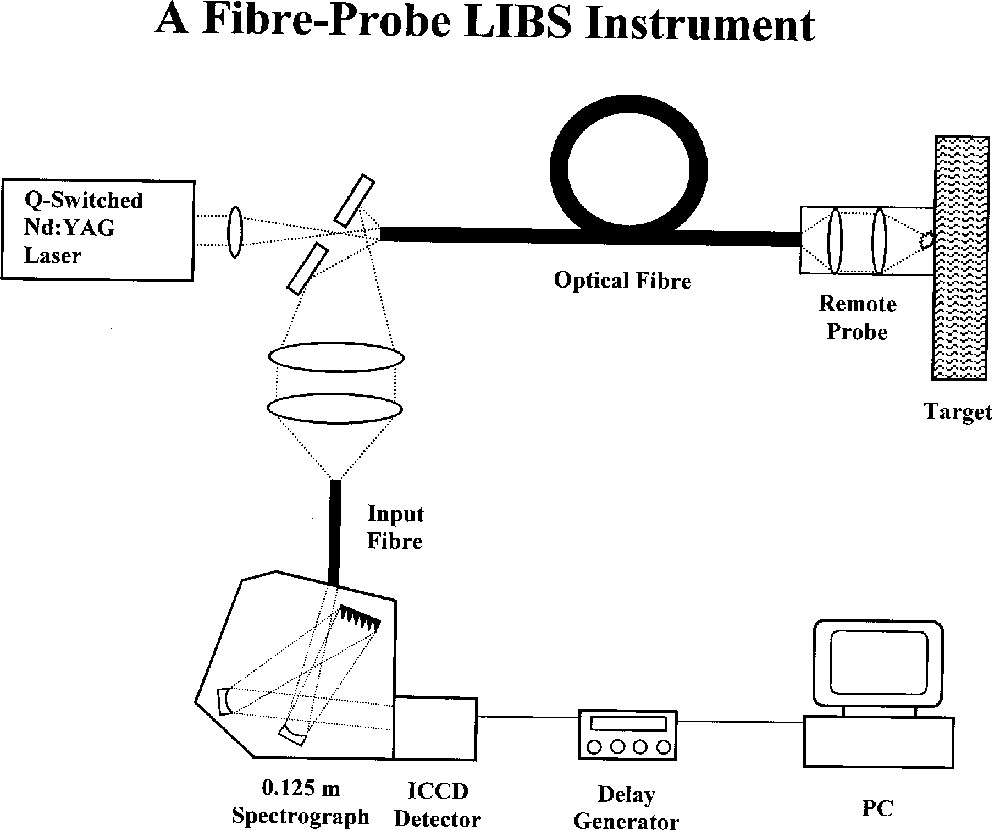
Schematic diagram of a fibre-optic LIBS instrument.
Recent combined LIBS and Raman studies of a 19th c. Russian icon (Fig. 9) have revealed the identities of the pigments found in the upper layers (white lead, zinc oxide used for repair purposes, vermilion, red earth...) above a silver foil. Below this was found the white ground consisting mainly of gypsum immediately above the wood (Fig. 10) [53]. Similar studies of a Rococo polychrome, a fragment from a gilded altarpiece in a church in Escatrón in Spain, have been carried out [54], and these reveal the power of the combined application of the two techniques for stratigraphic analyses of the pigmentation on artworks.
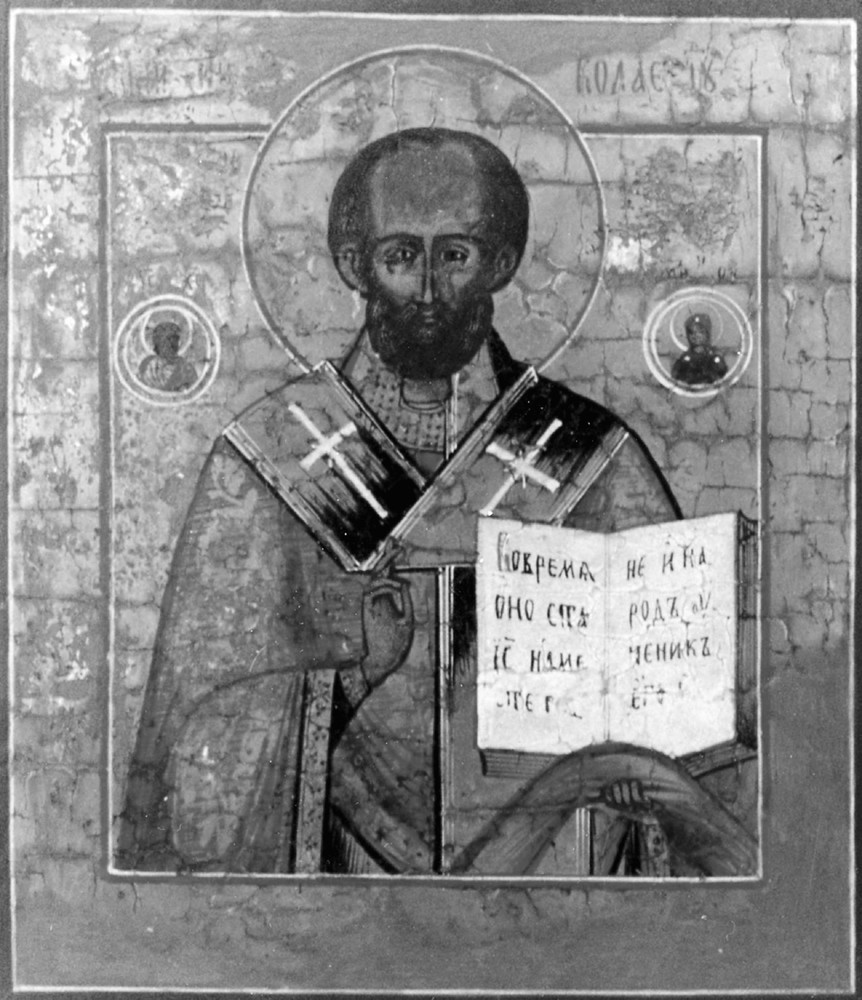
19th c. Russian icon of St. Nicholas.
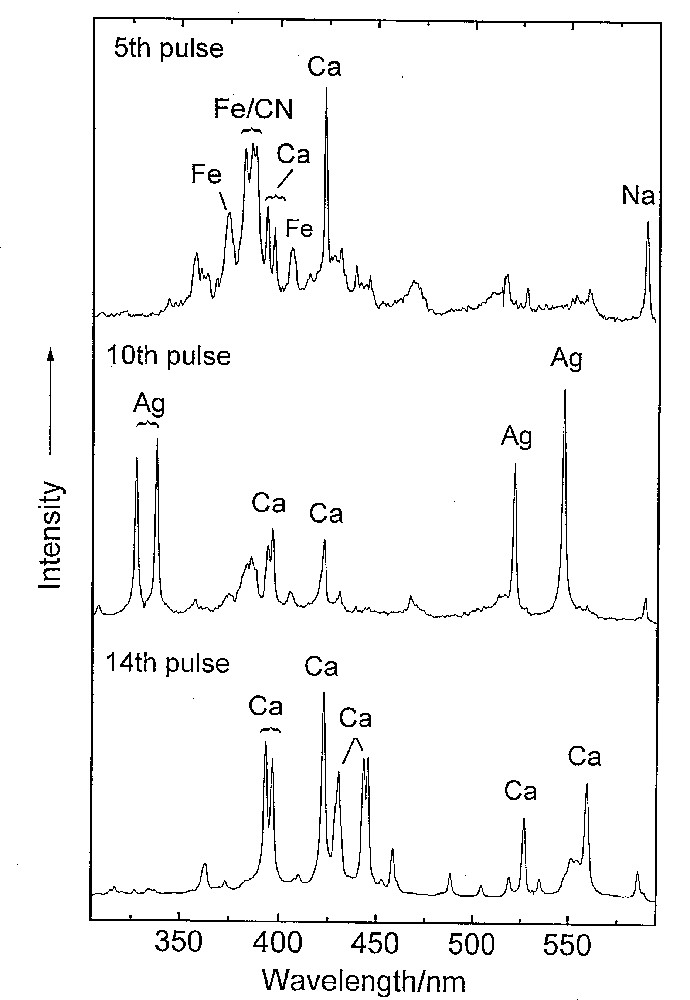
Successive LIBS spectra indicating the separation of paint layers (top spectrum) and ground layer (bottom spectrum) by silver foil (middle spectrum). The paint layer contains an iron-based pigment (brown, and so, probably an iron oxide) and the ground is calcium sulfate.
9 Wall paintings
Many studies have now been carried out on the pigments used to illuminate coloured frescos, whose palettes are much more restricted than those of manuscripts and paintings. By contrast with scriptoria, libraries and museum collections, where pigment degradation has only been slight, wall paintings and frescos often show obvious signs of overexposure to environmental extremes of temperature and humidity. Moreover, the effects of microbial, fungal and lichen colonisation on exposed frescos can be severe [55]. Indeed, lichen hyphae are thought to have biodegraded up to 80% of the frescos painted by Zuccari in the Palazzo Farnese in Caprarola, Italy [56].
Raman studies of the pigments and pigment degradation products found on frescos and on wall paintings in caves are likely to increase in number with the effective development of mobile Raman systems.
10 Applications to problems of pigment degradation
Among the most difficult pigments from which to obtain Raman spectra are black materials such as PbS (galena) and PbO2 (plattnerite) each of which may develop under different conditions on artwork as degradation products of other lead-containing pigments, notably white lead 2 PbCO3·Pb(OH)2 [57]. This results in gross disfigurement of the manuscript or painting, or worse — a nearly complete reversal of the intended light/shadow effect. Both PbO2 and PbS may now be identified using modern Raman microscopes and excitation lines of low power, both directly and by way of the recognition of their oxidation products, viz PbO·PbSO4, 3 PbO·PbSO4 and 4 PbO·PbSO4 [38, 58–61]. Reversal of black PbS to white PbSO4 is one option sometimes used for restoration of the intended effects of the artist, but this procedure is by no means fully accepted by conservators.
Raman microscopy may be applied to the study of the corrosion of metals, including that of the main constituents of ancient bronzes, viz copper, tin and lead. Thus bronze artefacts from Chinese tombs of the Eastern Han dynasty (25–220 AD) have been shown to include the following components among their corrosion products: Cu2O (cuprite), CuCO3·Cu(OH)2, PbO, PbCO3 and PbSO4 [62]. Two-dimensional mapping provided information on the spatial extent of the corrosion products. Many extensions to this type of work are being planned with the vast collections of degraded metals in museums in order to understand the nature and causes of the degradation. Other techniques are also being used to analyse alloys and corrosion products, viz nuclear reaction analysis (NRA) for the analysis of bronze patinas and Rutherford back-scattering (RBA) to establish the thickness of a gold-copper alloy [63].
Other developing fields of interest are the use of lasers in the cleaning of surface dirt and/or varnish from paintings and their use for the removal of overpaintings [64,65]. These delicate operations require precise control of the ablation by the excimer laser (KrF, 248 nm) of material from the contaminated surface layers 20–300 μm thick at a resolution of ca 0.1–1 μm per pulse, depending upon the laser intensity and wavelength and on the material being ablated. Typical varnish layers are 50–80 μm thick, and a typical varnish or paint stroke applies material at a thickness of 15–20 μm per stroke. Such treatment can result in a thinner, but clean, protective layer of varnish in place on the painting. Such a cleaning procedure may be much more attractive than that by solvents, which may penetrate the painting and weaken the binding of the pigments to the canvas.
Modern Raman spectrometers are now capable of identifying iron gallotannate inks on manuscripts, a notoriously difficult task. Recent studies on the Vinland Map (Beinecke Library, Yale University) have shown that the fragmented black ink lines which define the map, consist of carbon rather than iron gallotannate and have confirmed that the yellow background to the lines contains nearly pure anatase (TiO2), a synthetic ca 1920 product, which could not be identified elsewhere on the map [66]. These results (a) indicate that the map dates from the 20th not the early 15th century and thus that it is not pre-Columbian and (b) confirm the earlier polarised light microscopy results but not the earlier PIXE results as regards the conclusions drawn [67].
11 Conclusion
Raman microscopy is now established as the key technique for the identification of pigments on works of art, in particular because of its spatial and spectral resolution, excellent sensitivity and specificity, and because it can be applied to an object in situ. Difficulties may arise with certain organic pigments, supports and binders which fluoresce, which are photosensitive, or which fail to yield a Raman spectrum owing to their small particle size, high dilution, or poor scattering efficiency. The use of other techniques in conjunction with Raman microscopy may then be essential in order to effect full pigment characterisation.
Remote laser Raman microscopy will increasingly be used for the study of objects unable to be moved from their place of exhibition. The whole area is one in which the Arts and the Sciences can combine with great effect.
Acknowledgements
I acknowledge the skilful and dedicated work carried out by my recent associates in this field, in particular, Drs Lucia Burgio, Tracey Chaplin, Steven Firth and Gregory Smith and Miss Katherine Brown. Renishaw plc, the EPSRC, the European Union, the ULIRS and the British Library have supported the research. The pioneering work of Professor Michel Delhaye (Lille) in the design of early Raman spectrometer systems, through time-resolved and space-resolved systems [68], to confocal Raman microscope systems [69], is acknowledged.