

1 Introduction
Some time ago, this laboratory reported a class of iron chelating agents, the 2,3-dihydroxyterephthalamides (TAM), as part of an on-going investigation of Fe(III) coordination by catecholamide derivatives 〚1〛. The parent catecholamide (CAM) ligand exhibits great strength as a Fe(III) chelator and occurs naturally in siderophores (ligands released by bacteria to sequester Fe(III) from their environment 〚2〛). Notable among the siderophores is enterobactin (Fig. 1), due to its highest formation constant of any aqueous ligand for Fe(III) binding (1049). This extraordinarily high stability is due in large part to the three CAM ligands suspended from its triserine backbone and to the overall preorganization of this ligand 〚3〛.
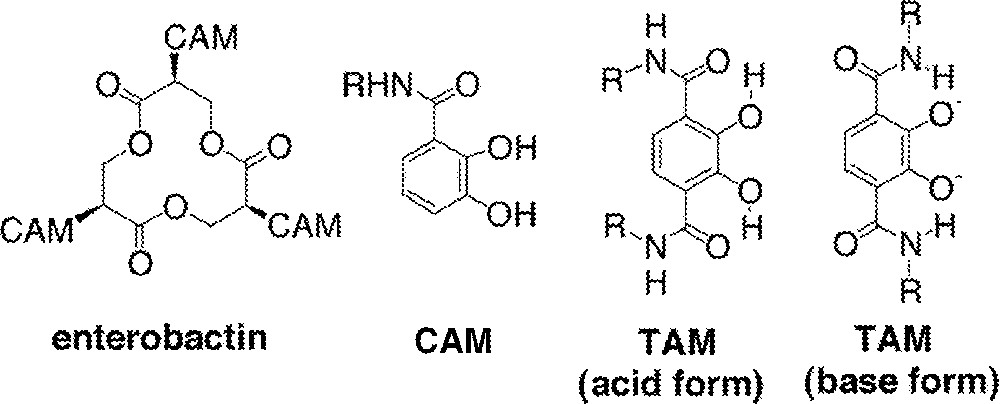
Enterobactin, catechol amide (CAM) and terephthalamide (TAM).
The 2,3-dihydroxyterephthalamides (TAM) are synthetic derivatives of the CAM system containing an additional amide substituent. The dual amide groups have two important roles in Fe(III) binding. First, the additional electron-withdrawing amide lowers the protonation constants of the catecholate protons (log values from 8 and 12 for a CAM, to 6 and 11 for a TAM), allowing the TAM to bind Fe(III) at a lower pH than a CAM 〚1, 4〛. Second, a hydrogen bond is formed between the amide proton and the deprotonated catecholate oxygen, contributing ca. 1.2 kcal mol–1 of stability per hydrogen bond to the resulting 〚FeL3〛3– complex 〚5〛. Both ligands exhibit high formation constants for the corresponding 〚FeL3〛3– complexes (1041 for a CAM, 1042.7 for a TAM) and these basic ligands are able to bind Fe(III) at neutral pH. In the presence of a TAM, coordinated Fe(III) exists completely as Fe(TAM)33– at > pH 5, and the pH of a solution must be lowered to at least 1.5 to completely dissociate Fe(III) from a TAM (conditions: 〚Fe〛 = 1 μM, 〚L〛 = 10 μM).
The extraordinary properties of catecholate ligands as Fe(III) chelators have prompted their use for several purposes, including Fe(III) and Pu(IV) decorporation from mammals 〚6–9〛, actinide chelators 〚6–9〛, macrocyclic chelators 〚10–13〛, and supramolecular assemblies 〚14–17〛. For any given application, a desired substituent may be included to suit a specific purpose; for instance, a different overall charge or enhanced solubility in aqueous or organic solutions may be desired for the resultant metal complex. As variants of TAM derivatives have been synthesized in this laboratory, it became clear from solution thermodynamic studies that various substituents were affecting the overall stability of the Fe(III) complexes.
A systematic study of several TAM derivatives that incorporate negative, neutral, or positive charges into the amide side chains has been conducted to better understand these observations. This report includes the results of this investigation into the effect of peripheral charge variation on the stability of Fe(III) complexes and a small correction to previously published Fe–TAM stability constants.
2 Experimental
2.1 General
All reagents and solvents were purchased from Aldrich Chemical Company or Fisher Scientific and used as received. All solvents were dried over activated alumina and stored over 4 Å molecular sieves. All reactions involving acid chlorides or BBr3 were carried out under Ar and solvents were degassed by evacuating the flask and filling three times with Ar. Water was distilled and further purified by a Millipore cartridge system (resistivity 18×106 Ω). 1H and 13C NMR spectra were obtained on a Bruker DRX500 (500 MHz) or Bruker AMX400 spectrometer (400 MHz), as noted. All NMR samples were dissolved in CDCl3 unless otherwise noted and referenced to residual CHCl3. All microanalyses were performed by the Microanalytical Services Laboratory in the College of Chemistry, University of California, Berkeley. Ligand H2L1 (1) and intermediates 5, 7, and 9 were synthesized as previously described 〚1, 12, 18, 19〛.
2.1.1 2,3-Bisbenzyloxy-N,N’-bis(2-hydroxyethyl)terephthalamide (6)
Ethanolamine (0.28 g, 4.60 mmol) was added to a solution of 5 (1.27 g, 2.18 mmol) dissolved in CH2Cl2 (100 ml) and stirred for 10 h until the yellow color disappeared. The solution was washed with KOH (100 ml, 1 M), and the aqueous layer was back-extracted once with CH2Cl2 (100 ml). The organic layers were combined, reduced to 10 ml, and left to stand at 0 °C for 10 h. The resulting white microcrystalline solid was filtered, washed with cold CH2Cl2, and dried under vacuum (yield: 0.98 g, 2.12 mmol, 97%). 1H NMR (δ, d6-DMSO, 300 MHz): 8.32 (t, J = 5.6 Hz, 2H, NH), 7.35–7.43 (m, 12H, aromatic H), 5.06 (s, 4H, Bn CH2), 4.77 (t, J = 5.2 Hz, 2H, OH), 3.47 (q, J = 5.7 Hz, 4H, CH2), 3.30 (q, J = 5.8 Hz, 4H, CH2). Elemental analysis found (calc.) for C26H28N2O6 (464.5): C, 67.09 (67.23); H, 6.06 (6.08); N, 5.99 (6.03). M.P. (uncorrected) 123–125 °C.
2.1.2 2,3-Dihydroxy-N,N’-bis(2-hydroxyethyl)terephthalamide (2) (L2)
A solution of 6 (0.83 g, 2.92 mmol) in AcOH (30 ml) and H2O (5 ml) was mixed with 10% Pd on C (0.31 g) and stirred under an atmosphere of H2 at ambient pressure and temperature for 7 h. The mixture was filtered and the solvents removed by rotary evaporation. The resulting solid was suspended in ethanol (10 ml), filtered, and washed with ethanol. Recrystallization of this solid from water afforded a white microcrystalline solid (yield: 0.25 g, 1.43 mmol, 49%). 1H NMR (δ, D2O/NaOD, 500 MHz): 6.90 (s, 2H, aromatic H), 3.72 (t, J = 5.4 Hz, 4H, CH2), 3.49 (t, J = 5.5 Hz, 4H, CH2). Elemental analysis found (calc.) for C12H16N2O6·H2O (302.28): C, 47.52 (47.68); H, 6.12 (6.00); N, 8.82 (9.27). M.P. (uncorrected) 213–216 °C.
2.1.3 2,3-Dimethoxy-N,N’-bis(ethanesulfonate)terephthalamide (8)
To a suspension of 2-aminoethanesulfonic acid (0.776 g, 6.20 mmol) in MeOH (100 ml) was added 60% NaH in a mineral oil suspension (0.24 g, 6.0 mmol). When H2 gas evolution subsided, 7 (1.28g, 3.00 mmol) was added, and the solution was stirred under N2 for three days until the yellow color faded. The solution was evaporated to dryness, and the residue washed with CH2Cl2 to remove the 2-mercaptothiazoline byproduct, mineral oil, and unreacted starting material 7. The remaining residue was dissolved in MeOH and filtered to remove unreacted amine. The methanol filtrate was evaporated to dryness to yield a white powder (1.25 g, 2.40 mmol 80%), which was used without further purification. 1H NMR (δ, 500 MHz, CD3OD): 3.09 (t, J = 6.3 Hz, 4H, SO3CH2), 3.85 (t, J = 6.3 Hz, 4H, NHCH2), 3.97 (s, 6H, OCH3), 7.66 (s, 2H, aromatic H). 13C NMR (δ, 500 MHz, DMSO-d6): 36.5, 50.5, 61.8, 124.6, 131.5, 151.5, 164.3.
2.1.4 2,3-Dihydroxy-N,N’-bis(ethanesulfonate)terephthalamide disodium salt (3) (L3)
A suspension of 8 (1.25 g, 2.58 mmol) in dry CH2Cl2 (50 ml) was degassed using three freeze-pump-thaw cycles under N2 atmosphere. The mixture was frozen in liquid N2 and BBr3 (8.0 ml, 21.2 g, 85.0 mmol) was added, and the solution was allowed to warm to RT under N2. The resulting yellow-orange slurry was stirred for three weeks. The slurry was cooled with an ice bath, and MeOH (100 ml) was added slowly to quench the reaction. CH2Cl2 and MeOH were distilled from the solution to remove the volatile borate esters, and MeOH was added as needed to maintain the volume. The distillation was complete when a flame test of the distillate indicated no boron present (lack of green flame). The product precipitated as a white solid from the cooled solution, was filtered and dried in vacuo (0.36 g, 0.774 mmol, 30%). 1H NMR (δ, 500 MHz, DMSO-d6): 2.69 (t, J = 7.3 Hz, 4H, SO3CH2), 3.54 (m, 4H, NHCH2), 7.16 (s, 2H, aromatic H), 8.99 (m, 2H, NH); 13C NMR (δ, 500 MHz, DMSO-d6): 36.5, 50.2, 115.9, 117.5, 150.6, 168.6. Elemental analysis found (calc.) for C12H14N2Na2O10S2·2H2O·0.5MeOH (M = 508.4 g mol–1): C, 29.59 (29.53); H, 3.79 (3.96); N, 5.42 (5.51). M.P. > 250 °C.
2.1.5 2,3-Dimethoxy-1,4-bis-N,N’-(N,N-dimethylaminoethyl)terephthalamide (10)
2,3-Dimethoxyterephthalic acid (9) (12.38 g, 55.0 mmol) was suspended in 40 ml of 1,4-dioxane and dissolved upon addition of SOCl2 (21 ml, 0.29 mol). The reaction was heated with a 90 °C oil bath overnight, the excess SOCl2 and dioxane were removed, and the resulting brown oil was co-evaporated three times with CHCl3 (50 ml). The resulting oil was dissolved in CHCl3 (5 ml) and slowly added over a 20-min period to N,N-dimethylethylenediamine (2.7 ml, 24.6 mmol) in CHCl3 (50 ml). The reaction was stirred overnight at room temperature. The solvent and the excess diamine were removed with reduced pressure, which resulted in a clear solid coated in a brown impurity. The brown impurity was washed off with a small amount of diethyl ether to afford a white translucent solid (0.451 g, 40.7 mmol, 74% yield). M.P. 80–83 °C. 1H NMR (δ, 400 MHz, CDCl3): 2.27 (s, 12H, N–CH3), 2.50 (t, 4H, CH2, J = 6.0 Hz), 3.5 (q, 4H, CH2, J = 5.7 Hz), 3.95 (s, 6H, O-CH3), 7.89 (s, 2H, CH), 8.31 (s, 2H, NH). Elemental analysis for C18H30N4O4 calculated (found): C, 59.00 (58.94); H, 8.25 (8.42); N, 15.29 (15.29).
2.1.6 2,3-Dihydroxy-N,N’-bis(N,N-dimethylaminoethyl)terephthalamide dihydrobromide salt (4) (L4)
A solution of 10 (0.255 g, 0.80 mmol) in dry CH2Cl2 (50 ml) was degassed using three freeze-pump-thaw cycles under Ar atmosphere. The solution was frozen in liquid N2, BBr3 (1.1 ml, 11.7 mmol) was added, and the solution was allowed to warm to room temperature under Ar. The resulting yellow-orange slurry was stirred for five days. The solvent was removed with reduced pressure, the flask was cooled in a dry ice/isopropanol bath, and methanol (15 ml) was slowly added to dissolve the yellow solid. Upon warming to room temperature, the solution was diluted to 100 ml with methanol and refluxed for 10 h, refilling the methanol to 100 ml when necessary. After stirring for an additional 36 h, a white solid precipitated and was collected by filtration (0.268 g, 0.54 mmol, 67% yield). M.P. 280 °C (dec.). 1H NMR (δ, 400 MHz, D2O): 2.82 (s, 12H, N–CH3), 3.28 (t, 4H, CH2, J = 5.8 Hz), 3.66 (t, 4H, CH2, J = 5.8 Hz), 7.08 (s, 2H, CH). 13C NMR (δ, 400 MHz, D2O): 34.7, 43.2, 56.6, 116.9, 147.8, 169.7. Elemental analysis for C16H28N4O4Br2 calculated (found): C, 38.42 (38.12); H, 5.64 (5.62); N, 11.20 (11.00).
2.2 Solution thermodynamics
Equilibrium constants were measured at 25 °C in aqueous solution with a supporting electrolyte of 0.1 M KCl. They were determined as cumulative formation constants (βmlh, where M, L and H refer to the metal, ligand and proton species respectively).
2.2.1 Apparatus
The temperature–controlled 100 ml titration flask with attached quartz UV–Vis cell has been described in detail elsewhere 〚20〛. An Accumet pH-meter (model AR15 or 15) and a Corning glass-bulb electrode (General Purpose High Performance, catalog No. 476146) were used for pH measurements. Metrohm Autoburettes (Dosimat 665/765 or Titrino 702) were used for titrant dosing. A Hewlett-Packard 8452a spectrophotometer (diode array) was used for the collection of absorbance data and was always turned on for at least 1 h before use to allow the lamp to come to operating temperature, all absorbance measurements were less than 1.1 absorbance units. The autoburettes, pH-meters, and spectrophotometer were controlled by a personal computer using the LABVIEW 〚21〛 programming environment allowing automated titration execution. Acid and base solutions (0.1 M HCl and KOH) were prepared using Baker Dilut-it ampoules, and standardized to ±0.2%. An analytical grade balance (±0.05 mg) was used.
2.2.2 Spectrometric cell design
To facilitate the acquisition of spectrometric data, a new cell was constructed. The features of this cell include all-Pyrex® construction with a visible range Pyrex® cuvette grafted to the bottom of a jacketed 100 ml cell. The design includes a platform for the placement of an X-shaped stir bar above the 1 cm cuvette; stirring is produced remotely by a stir plate directly below the cuvette about 4 cm from the stir bar. Spectra obtained with and without stirring were identical and the addition of dye into a stirred solution indicated effective mixing throughout the cuvette and the cell.
2.2.3 Electrode calibration
The standard electrode calibration was conducted before each titration following a published protocol 〚20〛. The data were analyzed using the program GLEE 〚22〛 allowing refinement of E0 and slope. For low-pH titrations (≤ 2.5), a correction was made for the variation in junction potentials 〚20〛.
2.2.4 Ligand protonation constants
Solutions of the ligands at concentrations in the range 0.25–1.6×10⁻³ M were titrated to pH 11 with base and then back to pH 3 with acid; the data were collected as pH vs volume of titrant added. For each ligand, titrations were conducted at least three times, with approximately 400 data points collected for each pair of titrations. These were analyzed with the program HYPERQUAD 〚23〛.
2.2.5 Fe(III) complexation constants
Spectrophotometry was employed using published data collection and analysis procedures 〚20〛. Solutions were assembled from electrolyte solution, a weighed portion of the appropriate ligand and an aliquot of a standardized Fe(III) stock solution, in that order. Concentrations in the range 2–6 × 10⁻⁴ M ligand and 0.7–2 × 10⁻⁴ iron were used with metal:ligand ratios of ca 1:3+. The resultant light blue–green solutions had an initial pH of ∼3 and were titrated to pH ∼ 9 with base, then back to pH 3 with acid with a constant pH increment, such that ∼30 data points were collected in each direction.
Accurate determination of the first equilibrium constant for metal–ligand complexes requires titration to low pH with corrections to pH measurements for variation in electrode junction potentials, as stated above 〚20〛. In this case, 1:1 metal to ligand solution (ca 4 × 10⁻⁴ M, 50 ml) was titrated with 25 ml of standardized acid solution to a final pH of ∼1.5, again with ∼30 data points being collected in each titration.
For both types of titration, an equilibration time of 3 min was observed at each point before data collection. For each iron–ligand system between 2 and 5, titrations were conducted in each pH regime (3 to 1.5 and 3 to ∼9). Data were analyzed by non-linear least squares refinement, using the computer programs HYPERQUAD or pHAb 〚24〛. Spectra were collected over ca 300 nm in the visible spectrum and data from at least 30 wavelengths were incorporated into the refinements. The quality of fit parameter (global standard deviation) ranged from 0.72 to 6.2.
2.2.6 NMR titration
H4L4.2Br (0.1 mmol, 49.9 mg) was dissolved in D2O (10 ml) with a small amount of CH3CN as an internal reference. This was divided into seven test tubes and the pD was adjusted accordingly with DCl or NaOD. The 1H NMR spectra and pD were recorded for each separate sample. A stacked plot of NMR data and analysis are included in the discussion.
3 Results and discussion
3.1 Synthesis
The TAM ligands investigated in this series have one of four amide substituents – ethyl, hydroxyethyl, ethylsulfonate, or dimethylaminoethyl – comprising neutral, negatively, or positively charged groups (Fig. 2). L1 was synthesized through either of two previously published routes 〚1, 18〛; L2, L3, and L4 were synthesized via modifications of published routes, which are illustrated in the synthetic scheme (Fig. 3) 〚1, 12〛. The activated intermediates 5 and 7 used in the synthesis of L2, L3, and L4 were derived from precursors protected at the phenolic oxygen atoms as either methyl or benzyl ethers. The protected ligand precursors 6, 8, and 10 were all prepared by stoichiometric addition of the amine to a solution of either the acid chloride or the thiazolide-activated (hereafter ‘thiaz’) intermediate and purified by a simple extraction. The thiaz-activated intermediate was prepared via the acid chloride for several reasons. The thiaz reacts selectively with primary amines, not at all with alcohols, and is stable in mildly basic aqueous solution and alcoholic solvents for short periods (less than a day). In addition, 5 and 7 are bright yellow. Their color disappears upon reaction with an amine and liberation of 2-mercaptothiazoline, providing a convenient method for monitoring the progress of the reaction or a column chromatographic separation.
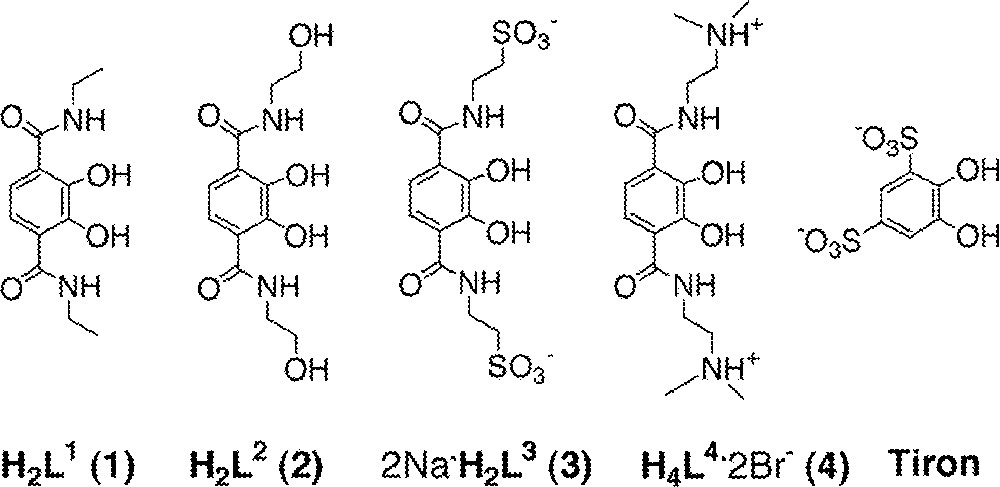
The structural formulas of the bidentate Fe(III) ligands described.
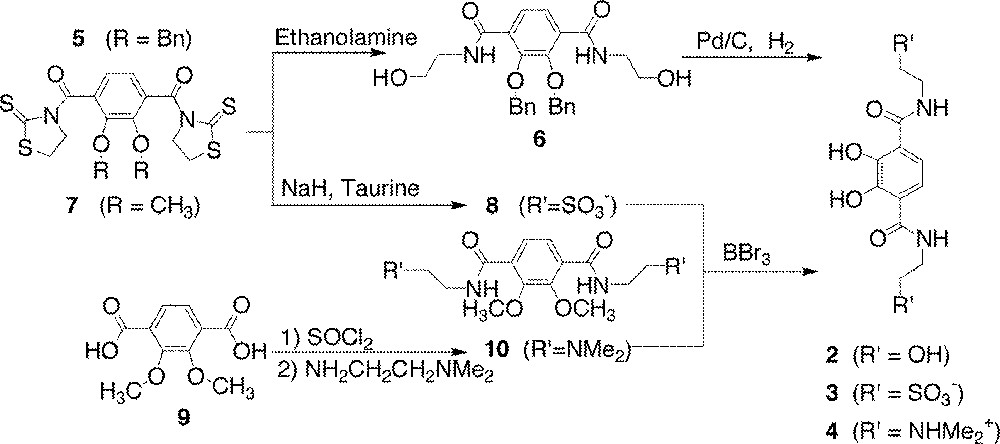
Synthetic routes to dihydroxyterephthalamide ligands in this report.
Taurine (2-aminoethanesulfonic acid), the amino acid used to prepare the protected precursor to H2L3, exists in its zwitterionic ammonium sulfonate form. In order to free the amine for reaction, the ammonium group was first deprotonated with a stoichiometric amount of sodium hydride in methanol in the absence of the thiaz-activated TAM. The sodium hydride/taurine solution was then added to a solution of the activated TAM. A slight excess of taurine was used in order to prevent reaction of sodium hydride with the thiaz-activated TAM. Upon completion of the reaction (TLC), the product mixture was evaporated to dryness. The TAM-thiaz starting material and the 2-mercaptothiazoline byproduct are removed by dissolution in dichloromethane, leaving product and taurine. The product is then selectively dissolved in MeOH.
Reaction of phenolic methyl ethers with BBr3 deprotects the phenolate oxygen atoms by forming a boron phenolate complex and liberating bromomethane. After several hours to days, a careful addition of methanol to the reaction mixture converts the boron phenolate complex, as well as any remaining BBr3, to the methyl borate ester. This borate ester is volatile and can be removed via boiling and/or distillation of the methanol for several hours, replenishing methanol as needed. The final, deprotected ligand is isolated by precipitation from methanol.
3.2 Protonation constants
The protonation constants of the phenolic oxygens were determined by potentiometric titration. Since the ligands vary in overall charge, the assignment of the protonation states for each ligand are illustrated in Fig. 4 with the values summarized in Table 1. For L1, L2 and L3, the data were analyzed using a model of two stepwise protonations of the ligand. For L1, the previously reported constants log K011 of 11.1 and log K012 6.0 〚1〛 were reexamined yielding values of 10.83 and 6.26, respectively, a small correction of these values. The analogous log K values of L2 are 10.61 and 6.05 and those of L3 are 11.01 and 6.47, respectively (Table 1). The extremely high protonation constants of the alcohol substituents on L2 and the extremely low protonation constants of the sulfonic acid groups of L3 allow these protic groups to be ignored in experimental considerations and in the refinement of titration data.
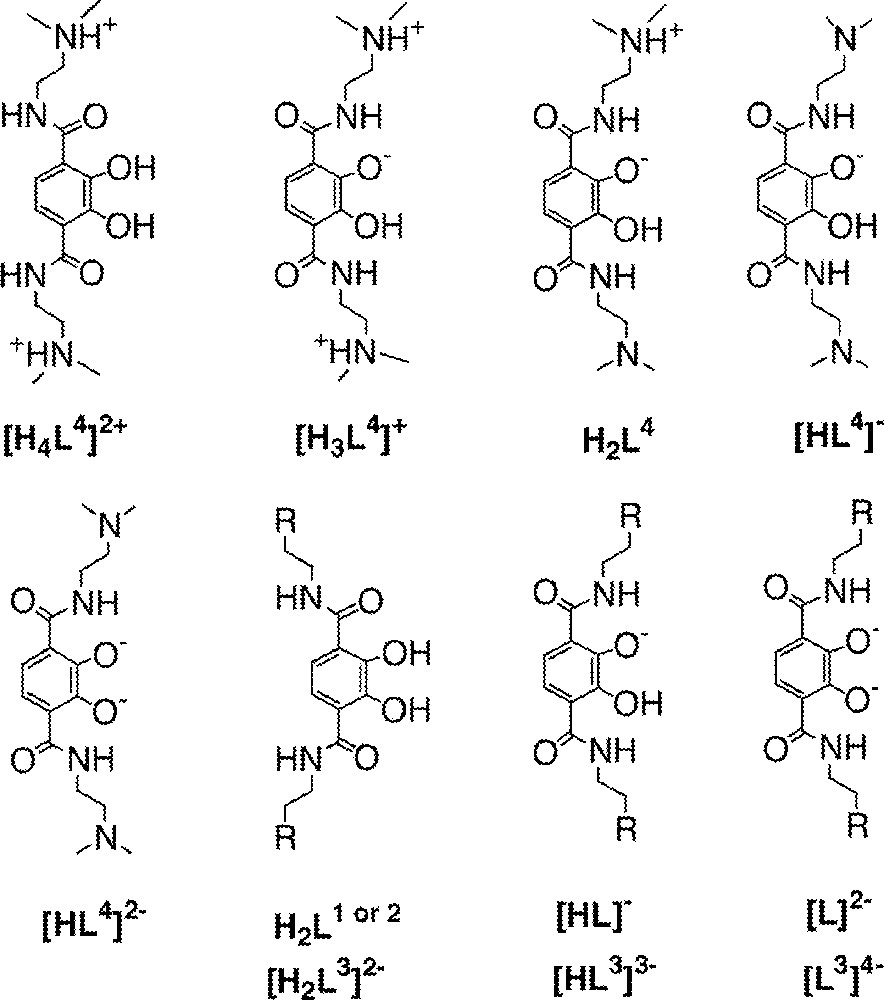
Assignment of protonation states for the ligands L1, L2, L3, and L4 (cf. Fig. 2).
Protonation and Fe(III) formation constants for the 2,3-dihydroxyterephthalamides in this report and for Tiron.
| H2L1 | H2L2 | 2Na+·H2L3 | H4L4·2 Br– | Tiron | ||||||
| log K110 | 17.27 (2)a | 〚+1〛b | 17.04 (1) | 〚+1〛 | 18.24 (1) | 〚–1〛 | 17.4 (5) | 〚+3〛 | 20.7c | 〚–1〛 |
| log K120 | 14.32 (4) | 〚–1〛 | 14.0 (1) | 〚–1〛 | 13.48 (2) | 〚–5〛 | 15.1 (4) | 〚+3〛 | 15.2 | 〚–5〛 |
| log K130 | 11.08 (5) | 〚–3〛 | 11.06 (4) | 〚–3〛 | 8.57 (5) | 〚–9〛 | 12.7 (2) | 〚+3〛 | 11.0 | 〚–9〛 |
| log β130 | 42.67 (5)a | 42.1 (1) | 40.29 (7) | 45.2 (4) | 46.9 | |||||
| pMd | 22.8a | 22.9 | 20.4 | 25.4 | 22.4 | |||||
| log K011 | 10.83 (6) | 10.61 (1) | 11.01 (1) | 10.86 (8) | 12.52 | |||||
| log K012 | 6.26 (1) | 6.05 (1) | 6.47 (2) | 9.24 (4) | 7.63 | |||||
| log K013 | — | — | — | 8.43 (2) | — | |||||
| log K014 | — | — | — | 5.39 (2)e | — |
L4 contains four titratable protons, and the constants of log K014 (5.39), log K013 (8.43), log K012 (9.24), and log K011 (10.86) (Table 1) are assigned to catechol OH, tertiary amine, tertiary amine, and catechol OH, respectively. The assignment for the different protonation states of L4 is also illustrated in Fig. 4. The assignment of these microstates has been confirmed qualitatively by a titration monitored by 1H NMR spectroscopy by inspection of spectrophotometric data. A batch titration monitored by 1H NMR spectroscopy was performed to confirm that protonation constants were assigned to the correct protons (Fig. 5). Solutions of L4 were prepared at six different pD values (1.5, 5.2, 7.8, 8.2, 8.8, and 10.7) and one with a very large concentration of base.
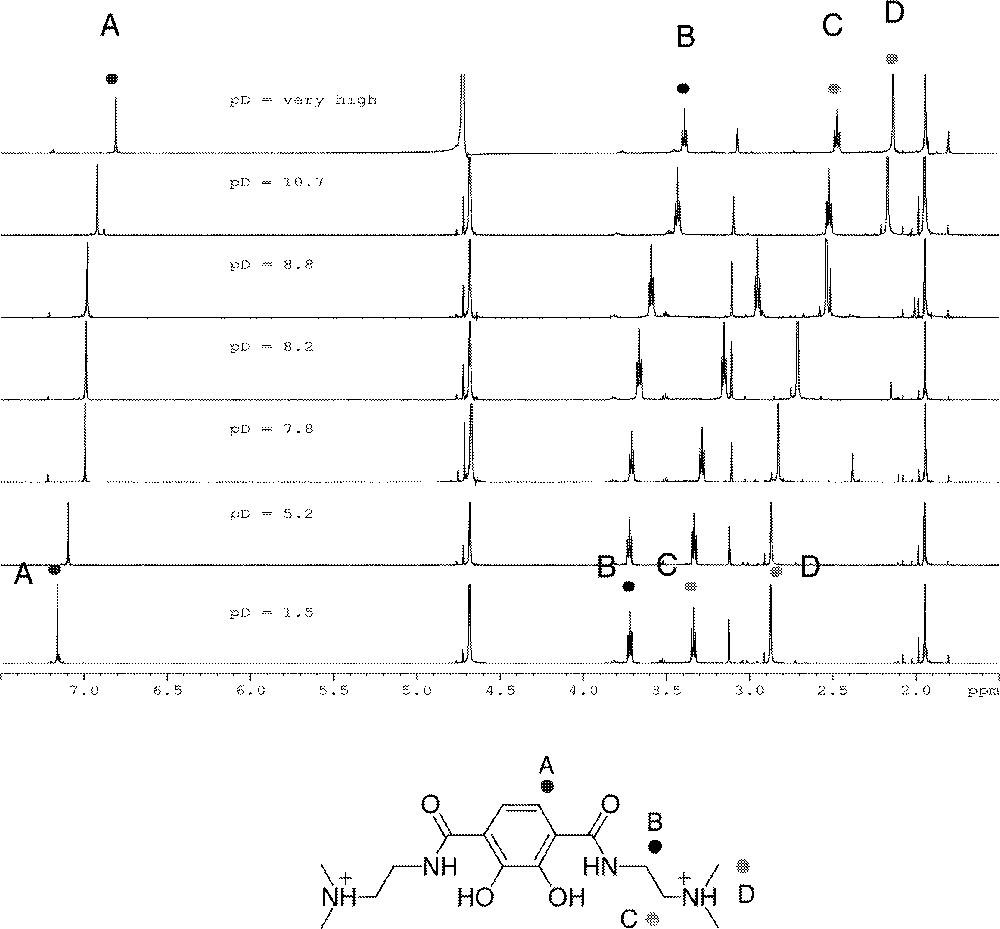
Spectra and proton assignments from batch titration of L4 monitored by 1H NMR spectroscopy. The signals at ca 2 and 4.7 ppm are internal standards of acetonitrile and HOD, respectively.
From low pD through pD 7.8 the only resonance shifting is the aromatic proton, indicating that the low protonation constant of 5.39 is the first catecholate proton. From pD 7.8 through 10.7 the doublets of the methylene protons and the singlet for the N-methyl groups shift. This indicates that the protonation constants of 8.39 and 9.24 were correctly assigned to the two amines. The aromatic peak has shifted a slight amount in the pD 10.7 spectrum, but the most significant shift comes when the pD of the solution is raised to a very high level. This indicates that the highest constant of 10.86 does belong to the second catecholate proton. Note that for L4, log K014 represents the same protonation step as log K012 for the other ligands, i.e. protonation of the second phenolic oxygen.
The protonation constants for the second protonation of the phenolate oxygen, K012 (or K014 in the case of L4), vary from 5.39 to 6.47 based on the overall charge on the ligand (log values, see Table 1). The two ligands with identical charge, L1 and L2, have similar values of 6.26 and 6.05. Deviation from an equilibrium constant around 6.1 is seen in the presence of the negatively or positively charged side groups of L3 or L4. For the positively charged ligand L4, this protonation reaction has a lower association constant (5.39), while the same constant is higher for the negatively charged ligand L3 (6.47). Approximately a 0.5 log unit difference is seen compared to the neutral ligand; the negative charge renders the ligand more basic and the positive charge leads to a more acidic ligand. The first phenolate protonation constant, K011, for each one of these four ligands, varies from 10.61 to 11.0. No trend can be discerned in this case, since L1, L2, and L4 have the same overall charge at high pH; also, L3 and L4, while different in charge, have almost identical log K011 values.
3.3 Ferric complex equilibria
The stepwise formation of the FeL, FeL2, and FeL3 complexes is highly dependent on pH due to the variable values for the first deprotonation constant of the TAM ligands. The formation constants for the Fe–TAM complexes have been determined by titration of a solution containing Fe(III) and the desired ligand and observing the spectral changes as a function of pH. The spectra show characteristic changes between 400 and 800 nm, assigned to a ligand-to-metal charge transfer (Fig. 6) 〚1〛. The spectrophotometric titration method employed here facilitates the determination of formation constants for a number of metal complexes in which the ligand is protic 〚19, 25–27〛.
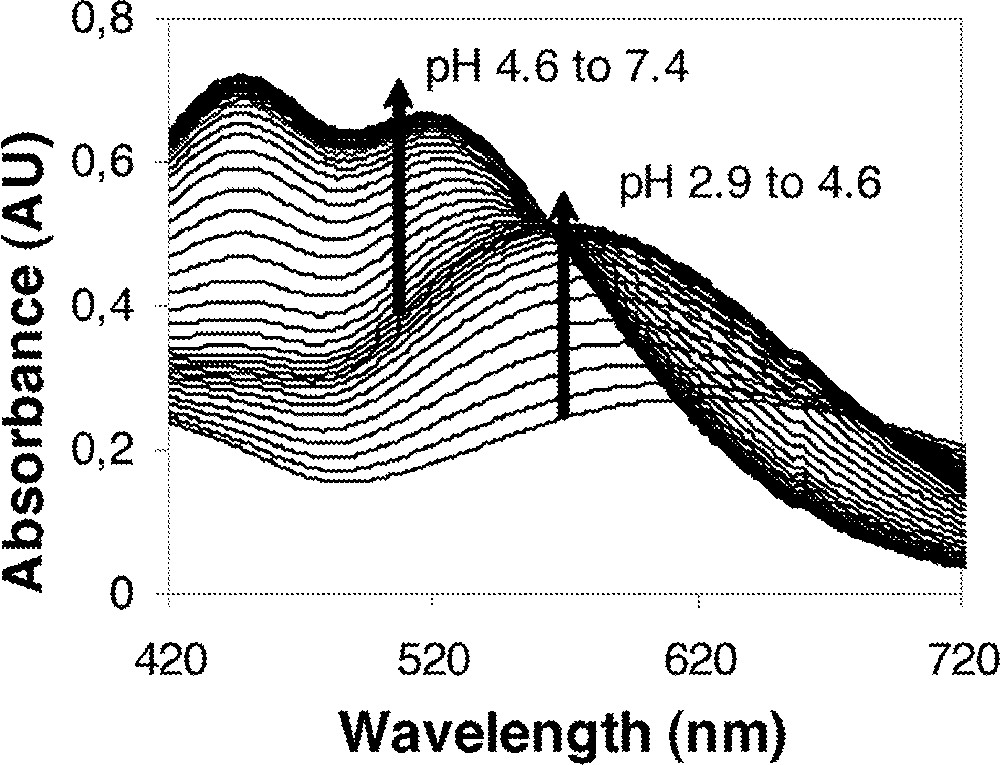
Representative visible spectral data for the titration of FeL2 and FeL3 species.
Two separate types of titrations were conducted: from pH 3 to ca. 1.5 to determine the constant for the 1:1 complex and from pH 3 to ca. 9 to determine the formation constants of the 1:2 and 1:3 Fe:L complexes. In the original study of Fe(III)-TAM complexes, data were collected to as low as pH 2.5, however, the data used were of insufficient quantity in the region where the 1:1 Fe: L1 complex dissociates to allow accurate equilibrium constant determination. This created an artifact discrepancy in the resultant value of log K110. This problem has been circumvented with the use of the low pH titration. With data collection to pH 1.5, at least 50% dissociation of the complex is achieved. The previous value of 16.3 for K110 for the Fe:L1 complex is now replaced by a value of 17.27. Spectral data from a typical low pH titration are presented in Fig. 7.
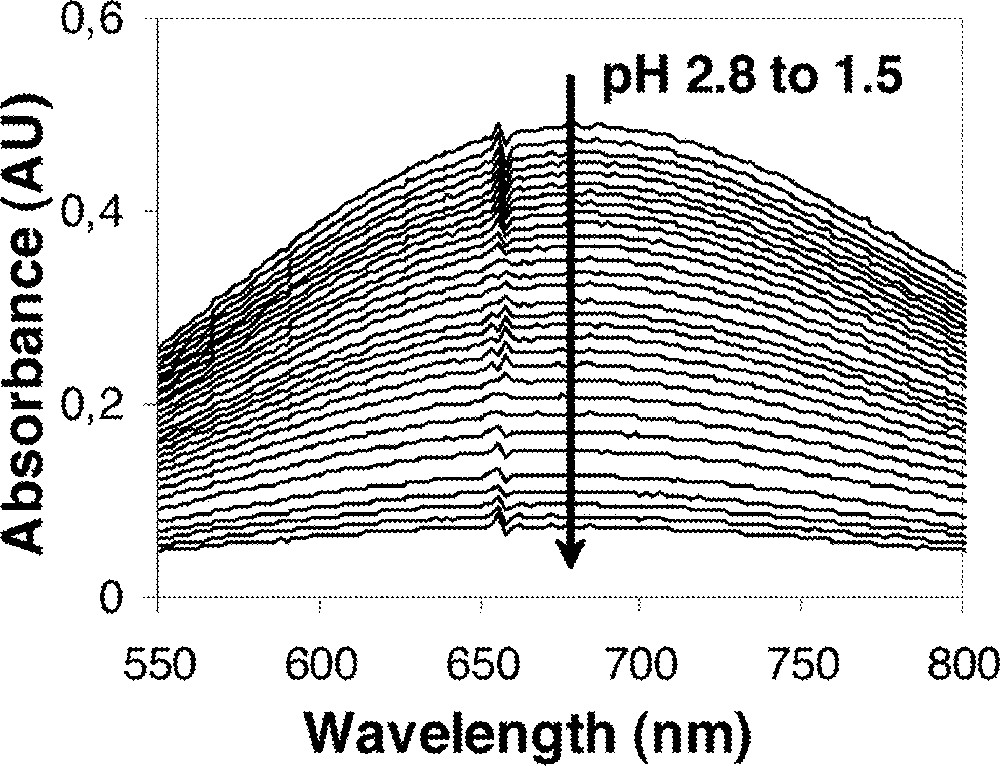
Representative visible spectra from a low pH titration illustrating the dissociation of the FeL complex.
For all of the ligands, the data were analyzed using a model of stepwise associations of the deprotonated ligand to the Fe(III) (L1 is used as the example here):
The values for the formation constants are summarized in Table 1. The notation for L4 is different from the other three ligands due to the two additional amine protons. The Fe(III) complexation is complete by pH 5, however the two terminal amines do not deprotonate until higher pH values. Thus the coordinating species should be referred to as the neutral H2L4, since the catecholates are deprotonated and the amines are protonated. Note that this ‘H2L4’ microspecies is a tautomer of the ‘H2L4’ noted in the protonation constant determination and illustrated in Fig. 4. The constants were fit to the model shown below:
The constants K112, K124, and K136 are a composite of the Fe(III)–ligand association constant and the two protonation constants (per ligand) of the terminal amines (108.43 and 109.24, K012 and K013, Table 1). Removal of the protonation constants gives the contribution of the metal–ligand association to K112, K124, and K136. These values are noted in Table 1 as K110, K120, and K130 and in this fashion L4 can be directly compared to the other three ligands. Note that it is H2L4 and not the fully deprotonated (L4)2–, which is chelating the metal at intermediate pH.
For the Fe(III)–L4 system, one titration was conducted to pH 11 to ensure that the acidity of the terminal amines was not affected by Fe(III) complexation. Six deprotonation steps of the metal complex were observed and the equilibrium constants calculated to be 7.67, 8.18, 8.42, 9.11, 9.40, and 10.66, a statistical distribution of the six deprotonations, yielding a mean log K of 8.91. This value is nearly identical to the average log K (8.83) of the amino groups (8.43 and 9.24) in the free ligand (K012 and K013, Table 1).
The stepwise association constants for each of the four ligands with Fe(III) are given in Table 1. The two ligands containing no charged substituents, L1 and L2, have similar formation constants with log β130 values of 42.67(5) and 42.1(1), respectively. The negatively charged ligand L3 has the lowest overall formation constant (log β130 of 40.29(7)), while the positively charged ligand L4 has the highest overall formation constant (log β130 of 45.32(4)). We attribute this trend, in which a greater negative charge on the complexing ligand leads to a lower overall formation constant, to the increasing electrostatic repulsion between the ligands in the higher order complexes (Fig. 8).
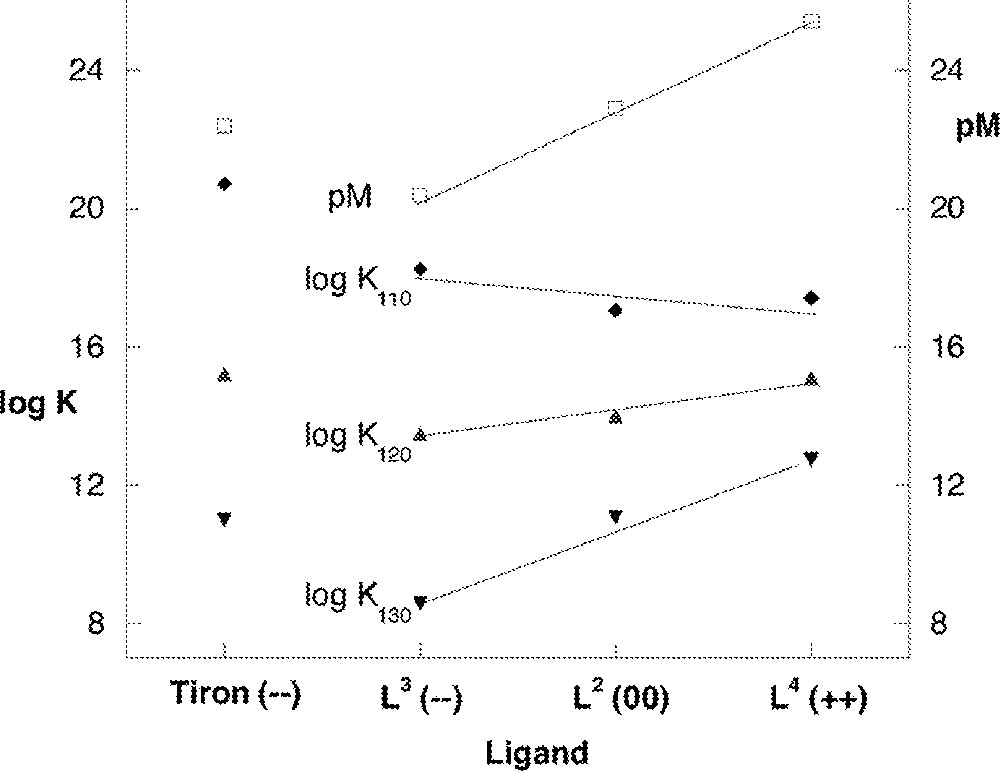
The effect of net complex charge and ligand charge on the equilibrium constant (left side) and pM (right side). Analogous values for Tiron are included (first data set); trendlines for the TAM data are qualitative.
The binding of subsequent ligands with lower association constants is generally attributed to the decreasing acidity of the metal ion as ligands are bound. In the present case, the amount by which K120 and K130 decrease for each of the four ligands is also consistent with electrostatic repulsion provided by each successive ligand, i.e. buildup of overall charge on the higher order complexes. For L3, each association constant is approximately five orders of magnitude smaller than the previous one. The charge on the metal complex increases from –1 to –5 to –9. For L1 and L2, the difference between each constant is three orders of magnitude with charges of +1, –1 and –3. In the case of L4, the constants decrease by 2.3 log units with each step; the chelating species of this ligand has a net neutral charge, so the charge on the metal complexes remain constant at +3. Since the stepwise association constants decrease so dramatically for the more negatively charged ligand, the result is that β130 and K130 decrease dramatically in the order L4 > L1 ∼ L2 > L3. These trends are illustrated in Fig. 8.
A useful comparison can be drawn between this series of ligands and the commercial Fe3+ chelator, Tiron 〚28–40〛. Tiron has the largest formation constant known for any bidentate ligand with Fe3+; the stepwise and overall formation constants for this system are included in Table 1. For this negatively charged ligand, K110 is very large, consistent with charge neutralization when one ligand is complexed with Fe3+. A dramatic decrease is seen in the stepwise constants K120 and K130, which is analogous to the decrease seen in this study with L3, the negatively charged ligand investigated in this study.
Another measure of the strength of a given ligand as a metal chelator can be seen in the pM value 〚41〛, defined as: –log 〚Mn+〛. The set of conditions used here for the calculation are 〚L〛 = 10–5 M, 〚Mn+〛 = 10–6 M, at pH = 7.4. The pM values show that at pH 7.4 L4 is the strongest ligand in this series, followed by L1 and L2, and finally L3. This may be the expected trend in this series of ligands, since this is the same order as β130, but does not hold in every metal–ligand system or for every pH. The very high value of pM for L4 reflects both the lower protonation constant of the first catecholate proton (K011) and the high value of β130. The effect of protonation constants upon pM can also be seen with Tiron: the higher constants of the catecholate protons (12.52 and 7.63) are reflected in a lower pM value, even though β130 is large. A conclusion that may be drawn is that Tiron’s stability is limited by the build-up of negative charge in the higher order complexes. Note that the TAM class of ligands form Fe(III) complexes of comparable stability as Tiron (cf. log β130 and pM, Table 1 and Fig. 8), and actually exceed its stability over most of the range of pH in terms of pM value.
4 Conclusion
This series of 2,3-dihydroxyterephthalamide ligands displays the effect of charge on stability in a series of ligands in which the substituents are systematically varied to include negative, neutral, and positive charges. The charge on the ligand has a significant effect on the overall stability of the corresponding Fe3+ complexes, even when the charged substituent is distant from the metal coordination site. An increased negative charge on a ligand is accompanied by an increase in FeL association constant K110, but a decrease in the overall FeL3 formation constant β130.
Acknowledgements
This research was supported in part under Grant SF17SP23, Environmental Restoration/Waste Management Science Program, Office of Science and Technology, United States Department of Energy under Contract No. DE-AC03–76SF00098.