

1 Introduction
Among the various classes of multifunctional ligands, the outstanding status of polyaminocarboxylic acids, also known as complexones, of which ethylenediaminetetraacetic acid (EDTAH4) is by far the most important, relies on their extraordinary affinity for almost all metals of the periodic table, including the strongly Lewis acidic actinide cations [1]. The anchoring of the negatively charged acetate oxygen atom in the inner coordination sphere favors the binding of the neutral amine nitrogen atom. Tethering several acetate groups onto a polyamine scaffold results in the simultaneous formation of multiple five-membered rings, which imparts some additional stability to the metal complexes, a phenomenon that is classically referred to the so-called chelate effect. The high stability of lanthanide(III) and actinide(III/IV) complexes with EDTA4− is the combined result of large and positive entropies together with exothermic reaction enthalpies [2,3]. The former effect is easily rationalized in terms of solvation. As a consequence of their high but opposite charge, both reactants are highly hydrated. Thus, complexation releases a large number of water molecules into the bulk, while the solvation shell around the resulting chelate is much more diffuse due to partial or total charge cancellation. Negative enthalpies can be understood on the basis of multiple-bond formation and chelate effect. These thermochemical properties contrast with the positive binding enthalpies, and less favorable entropies reported for simple carboxylate ligands.
Although the basic phenomena behind complex formation with polyaminocarboxylic acids are nowadays well understood, there have been only very few thermodynamic studies dealing with plutonium(IV), even for the most common complexone, EDTA4− [3–7]. This situation can be understood if one considers the rarity and toxicity of transuranides, but one should also keep in mind the experimental difficulties encountered by handling these elements. Most of those are inherent to their peculiar chemical properties, like the high propensity of the plutonium(IV) to undergo hydrolysis [8–13], to coordinate anions of the supporting electrolyte (e.g., NO3−) [14–18], and to disproportionate [19,20], even in strongly acidic solutions ([H+] < 1 M). Nevertheless, the low amount of basic information is somewhat puzzling, considering the technological, environmental, medicinal (e.g., in vivo decorporation) and analytical significance of these ubiquitous sequestering agents [1,3,21–24]. EDTA salts have found wide applications in the nuclear industry, mostly related to atomic weapons' manufacturing and to the disposal of the thereby generated highly radioactive wastes. The storage tanks on the Hanford site are reputed to contain ca. 80 tons of EDTA among the 350 000 m3 of wastes. Leakages have resulted in the release of an estimated amount of 4000 m3 of liquids into the environment, representing a total activity of more than one million curies [25]. Moreover, soil contaminations at several other US Department of Energy (DOE) sites have been documented [26,27]. Whereas the free concentration of tetravalent plutonium in environmental conditions is limited by the extremely low solubility of amorphous PuO2, several investigations have underlined the mobility enhancement of plutonium [28,29] and of other radionuclides such as 60Co in contaminated sediments containing EDTA [26,30].
The first cation exchange, potentiometric, and spectrophotometric characterizations of the plutonium(IV) complex formation equilibria with EDTA4− date back to 1957 [31,32], followed in the late 1960s and early 1970s by two other studies, one by Mikhailov, who performed solubility measurements of plutonium phenylarsonate in the presence of EDTAH4 [33], and the other by Cauchetier and Guichard, who used poloragraphy and spectrophotometry [34]. As recently pointed out in a recent critical review issued by the OECD Nuclear Energy Agency, none of these aforementioned studies are credited by the Thermochemical Data Base (NEA–TDB) reviewers [35], who recommend to consider instead the data selected for uranium(IV) for speciation calculations [36]!
Disregarded for almost three decades by the scientific community, the plutonium(IV)–EDTA system has attracted some new attentions after the turn of the century. Spurred by environmental issues, two studies funded by DOE have been published in 2001 [28] and 2004 [37], although none has been evaluated by the NEA–TDB reviewers [36]. Rai et al. have conducted solubility measurement of well-characterized PuO2(am) suspensions at fixed EDTA concentrations ranging between 10−5 and 9 × 10⁻² M as a function of pH in the presence of NaCl [28]. Corrected solubility data for ionic strength effects using the Pitzer ion-interaction model were interpreted by considering the formation of [Pu(EDTA)(OH)h]h− species with h = 1–3, but not of Pu(EDTA). The tetravalent oxidation state of the solutions in equilibrium with the solid phase was further ascertained by XANES. On the other hand, Boukhalfa et al. realized that a single hexadentate EDTA4− molecule is unable to saturate the inner coordination sphere of Pu4+, which admits coordination numbers comprised between 8 and 12 [24], and therefore searched for the possibility of forming bis-EDTA chelates and ternary complexes with citrate or carbonate [37]. Performing potentiometric titrations in 0.1 M NaNO3 for various metal over ligand molar ratios, they reported stability constants for [Pu(EDTA)(OH)]− (log β11−1 = 22.0(1)), [Pu(EDTA)(OH)2]2− (log β11−2 = 15.3(1)), [Pu(ED-TA)2]4− (log β120 = 35.4(2)), [Pu(EDTA)2H]3− (log β121 = 42.8(1)), and [Pu(EDTA)2H3]− (log β123 = 47(1)), while Pu(EDTA) was found to be already formed at pH values close to 2. Hence, the corresponding formation constant (log β110 = 26.4(2)) was derived in 0.9 M HClO4 from absorption spectrophotometry, albeit at a much higher ionic strength (I = 1 M) using NaCl as complementary supporting electrolyte. Since no efforts were made in the original paper to correct changes in activity coefficients, this work can at best be viewed as a guideline for further investigations [38].
As part of our ongoing actinide chelation studies, we have revisited the complexation thermodynamics of the plutonium(IV)–EDTA system in aqueous solutions ([NO3−] = 1 M) by combining visible absorption spectrophotometry and potentiometry, while complying to the NEA–TDB recommendations [10,12,36]. This work is intended to fill a gap in the scientific literature, providing self-consistent thermodynamic data collected under rigorously controlled experimental conditions. Moreover, extrapolation to zero ionic strength was achieved using the specific ion-interaction theory, thus affording a useful set of equilibrium constants for environmental speciation modeling or for further solution equilibrium studies involving EDTA as a competing ligand.
2 Experimental
2.1 Safety note
Plutonium-239 is a highly radioactive α-emitter with a half-life of 2.4 × 10⁴ years. For safety reasons, all operations were conducted inside low-pressure glove boxes designed for containment of radioactive materials (air renewal rate of ca. 4 m3 h−1) in commissioned “hot” laboratories located at the CEA Valduc facilities. Standard radiochemical procedures were followed throughout.
2.2 Solution preparations
Unless otherwise noted, all analytical-grade chemicals and starting materials were obtained from commercial suppliers and used without further purification. All solutions were prepared with boiled and argon-saturated double-deionized high-purity water (18.2 MΩ cm) obtained from a Millipore cartridge system. Acid and base titrant solutions were prepared from Merck concentrates (Titrisol®) diluted with water and stored under an atmosphere of purified argon using Ascarite II (Acros, 20–30 mesh) scrubbers in order to prevent absorption of carbon dioxide. Their ionic strength was adjusted to I = 1 M by adding the appropriate amount of KNO3 (Normapur Analytical Reagent, >99%, Prolabo). The carbonate-free KOH solution was standardized by titrating against oven-dried (120 °C for 2 h) potassium hydrogenphthalate (Aldrich, 99.99%), while 0.1 M HNO3 was titrated against oven-dried (120 °C for 2 h) TRIS buffer (Aldrich, 99.9%) using the equipment described hereafter and a combined Ag/AgCl glass semi-microelectrode (pHc 3006, Radiometer) filled with a solution saturated with KCl and AgCl. Equivalent points were calculated by the second-derivative method. The concentration of the standardized solutions corresponded to the average of at least five replicates and was known with a relative precision of less than 0.15%.
For the potentiometric measurements of the protonation constants, carefully weighed samples of ultra pure ethylenediaminetetraacetic acid (99.999%, Aldrich) were directly dissolved in the titration cell before each experiment. For the complexation studies, a 0.1 M stock solution of Na2[(EDTA)H2]·H2O (>99%, Aldrich) was prepared by dissolving the salt in water and adjusting the ionic strength to I = 1 M with KNO3.
The Pu(IV) stock solutions were obtained by dissolving a ca. 500 mg ingot of 99.96(4)% plutonium supplied by CEA (MP2 reference material, 97.7% 239Pu, 2.2% 240Pu, 0.1% other isotopes) in 5 mL concentrated HNO3 (14 M) using a “Picotrace” Teflon-lined digesting apparatus (1 h at 90 °C followed by 20 h at 140 °C). The resulting liquor was allowed to slowly evaporate at 90 °C until the final volume reached 2–3 mL, diluted again by adding 10 mL of 7 M HNO3 and reconcentrated. This process was repeated three more times with 1 M HNO3, affording a ca. 0.25 M stock solution of Pu(IV) containing traces of Pu(III) and Pu(VI), as evidenced by absorption bands at 630 and 830 nm, respectively. Hence, the fresh stock solution was stored for 1 month before use to reach depletion of both undesired Pu3+ and PuO22+ species. The final plutonium concentration was calculated from the initial mass of the metallic sample and was confirmed spectrophotometrically after oxidizing an aliquot to Pu(VI) with silver oxide (ɛ830 = 515 M−1 cm−1).
2.3 Potentiometric titrations
Potentiometric titrations were carried out in a water-jacketed cell connected to a Lauda RE106 water circulator ensuring a constant temperature of 298.2(2) K. Magnetically stirred solutions were maintained under a low-pressure argon stream to exclude CO2 from the headspace. Titrant aliquots were delivered through a polypropylene line crossing the glove box wall from a calibrated automatic ABU901 (Radiometer-Tacussel) 10 mL piston burette situated outside the glove box. Volumes were corrected according to a linear calibration function obtained by weighing known quantities of water and taking into account the buoyancy effect [39]. A PHM240 (Radiometer-Tacussel) ionometer was used to record at 0.1-mV resolution the electromotive force between a XG100 (Radiometer-Tacussel) glass-bulb electrode and a XR110 (Radiometer-Tacussel) KCl-saturated calomel reference electrode. The latter was separated from the bulk of the solution by a sintered glass bridge filled with 1 M KNO3. Both instruments were controlled by the Windows-based multitasking and interactive high-resolution titration software HRT Acid–Base Titration developed under the TestPoint environment by Mustin [40]. Unlike most commercial titrators, this system enables to monitor the transient signal after each incremental titrant injection, thus allowing a visual control of the pH variations during the equilibration time. Moreover, a flexible algorithm has been implemented for detecting stable readings with particularly harsh potential fluctuation, rather than drift, criteria (|ΔE| ≤ ±0.1 mV over a 4-min period).
Prior to each experiment, the electrochemical cell was calibrated to read hydronium ion concentrations (pH = −log [H3O+]) by titrating 4.000 mL of standardized 0.1 M HNO3 diluted in 20 mL of 1 M KNO3 with 9.000 mL of 0.1 M standardized KOH in 0.120 mL increments. The titration data comprised about 68 points collected between pH 1.79–2.28 and 10.75–11.92. The sum of the unweighed square residuals on the observed potential readings (Emes) was minimized according to the four-parameter extended Nernst equation (Emes = E0 + S log[H3O+] + Ja[H3O+] + JbKw[H3O+]−1) by using the Solver routine implemented in Microsoft Excel [41,42]. The minimization procedure allowed the simultaneous refinement of the standard cell potential (E0), the Nernst slope (S), the correction terms accounting for the changes in liquid-junction potential in strongly acid (Ja) or alkaline (Jb) media [43], together with the base-concentration factor (γ). The ionic product of water (pKw = 13.73, I = 1 M KNO3, T = 298.2 K [44]) was maintained constant during all refinements. Calibration data were rejected when the standard deviation of the residuals exceeded 0.1 mV, indicating a carbonate contamination of the base usually higher than 0.5%.
Equilibrium constants were determined in the pH range 1.6–10 by titrating 0.05 mmol of plutonium in the presence of 1 or 2 equivalents of EDTA4− dissolved in 20 mL of supporting electrolyte. The plutonium solution was introduced into the cell first, followed by EDTA and 1 M KNO3 solutions to avoid the formation of precipitates. The electrochemical cell was then allowed to equilibrate for several minutes before starting the stepwise addition of a standardized 0.1 M KOH solution containing 0.9 M KNO3. In order to minimize local oversaturations leading to colloid or solid Pu(OH)4(am) formation during the addition of each 0.03 mL increments, the lowest dispensing rate was chosen (1 μL s−1).
2.4 Spectrophotometric titrations
Electronic absorption spectra were collected from 400 to 900 nm with a uniform data point interval of 0.8 nm on a Cary 4000 (Varian) spectrophotometer. The rear path was outfit with a Series II rear beam attenuator (RBA) from Varian, the attenuation level being set to 1.65 absorbance units (AU). The reference cell in QS quartz or BF glass of 1-cm path length (Hellma) contained 1 M KNO3. The front light path was equipped with a standard cell holder and a fiber-optic cable interface (Hellma, ref. 662.000-UV). To ensure a dark environment in the measuring compartment located in the glove box, a cell holder (Hellma, ref. 664.000) equipped with an electronic magnetic stirrer (Model 300, Brothers Ltd.) was placed inside a homemade black box. The optical set-up was connected to the spectrometer with 4-m-long fiber-optic cables possessing a SMA connector at one extremity and a collimation lens at the other (Hellma, ref. 041.002-UV). Since the temperature of the cell holder compartment could not be strictly controlled, it was instead monitored. Fluctuations inside the glove box did not exceed ±1 K over the entire duration of an experiment. All solutions were allowed to thermally equilibrate before each run in the air-conditioned laboratory (T = 296(1) K).
Spectrophotometric titrations were conducted in a custom-made cell consisting either of a QS quartz or a BF optical glass cuvette having 1-cm path length (Hellma) topped by a five-necked titration vessel of 15-mL capacity. The five branches allowed to outfit the cell with a pHc 3006 Ag/AgCl combined glass semi-microelectrode (Radiometer) filled with a solution saturated with KCl and AgCl, a T201 temperature probe (Radiometer), a burette tip, a Teflon gas supply tube, and an oil-filled gas bubbler. The electrode was calibrated ex situ as described above. Magnetic stirring and gentle argon bubbling ensured a good mixing of the reagents. Electronic absorption spectra were recorded 2 min after each aliquot addition or after stabilization of the ionometer readings, with optical densities not exceeding 0.5 units. Prior to the titration, the reference spectrum of the electrolyte solution was acquired in the 400–900-nm range. The standard deviation of the measured absorbance for the baseline was approximately constant over the entire wavelength region and did not exceed 0.0003 AU.
The formation constant of Pu(EDTA) at constant ionic strength was measured by titrating 0.035 mmol of Pu(IV) diluted in 10 mL nitric acid (0.7 or 0.9 M, I = 1 M adjusted with KNO3) with a 0.1 M solution of EDTA. The 30 aliquots of 0.03 mL each were added manually with a calibrated Eppendorf micropipette (1-μL resolution). Potentiometric measurements coupled with a spectrophotometric detection were performed likewise: 0.5 mmol of Pu(IV) was added to either 0.05 or 0.1 mmol EDTA in 15 mL of supporting electrolyte (1 M KNO3). The equilibrium pH of the mixture was approximately 1.6. Standardized base was delivered in 0.03-mL aliquots by the automatic 10-mL piston burette up to a total volume of 7 mL.
2.5 Data processing
For each potentiometric titration curve, the collected potential readings were converted into pH values with the help of a Microsoft Excel spreadsheet by iterative solving of the four-parameter calibration function. The data were then analyzed individually by the weighed nonlinear least-squares procedure implemented in Hyperquad 2006 [45]. The selected weighing scheme derived from the error-propagation law seeks to reduce the weight of the less accurate measurements (i.e. points located in the steep region of a titration curve) [46]. On the basis of the instrument's calibration, the uncertainties associated with the experimental pH values (σpH) and the volumes delivered by the piston burette (σv) were estimated as 0.003 pH unit (or ∼0.1 mV) and 0.005 mL, respectively. In the final refinement step, the total amounts of titrated plutonium or initially added acid were also allowed to vary in order to check for consistency. The goodness of fit was evaluated through the squared sum of residuals (1.0 < σ < 1.8) and an approximately normal distribution of the residues [46]. The final values are reported as the arithmetic mean of the independent measurements together with their standard deviations that were systematically higher compared to those, derived for a single experiment from the full variance/covariance matrix [47]. Alternatively, all nine potentiometric data sets were merged together, thus allowing a global refinement of a single set of equilibrium constants corresponding to the complete model. Species distribution diagrams were computed with the Hyss program [48].
The multiwavelength data sets were decomposed into their principle components by factor analysis with the Specfit 32 program [49–51]. The formation constants and extinction coefficients corresponding to each species were subsequently adjusted to the reduced data sets by the Marquardt nonlinear least-squares algorithm. To allow convergence, the protonation constants of the uncolored EDTA4− species were fixed. The soluble plutonium hydroxo and nitrato complexes were ignored, as these were shown to be minor species in the explored pH range. Nitrato complexes were shown to form in appreciable amounts only at very low pH and thus may impact the formation constant of Pu(EDTA) which is regarded as an apparent value only (vide infra).
Furthermore, the data were also processed by the program Hyperquad, which allows the simultaneous treatment of potentiometric and spectrophotometric data [45]. While Specfit uses the measured pH values to calculate directly the free H3O+ concentrations, the mass-balance equations for all components, including the hydronium ion, are solved at each titration point by the program Hyperquad. Since the precision of spectrophotometric and potentiometric measurements is different, it is of prime importance to define a proper weighing scheme relying on the error-propagation rule that gives to each type of observations an approximately equal contribution to the residual sum of squares. Although a quadratic absorbance error function (σA = a + bA + cA2) is implemented in Hyperquad [45,46], a constant error (σA = 0.0003) appeared to be the most realistic choice.
3 Results
3.1 Auxiliary data
3.1.1 Definitions
Throughout, the complex formation equilibria are expressed in the generic form given by Eq. (1), where M, L, and H refer to the unhydrolyzed metal cation, the ligand, and the hydronium ion, respectively. The associated stoichiometric coefficients are labeled m, l, and h, whereas charges are omitted for clarity. If water molecules occur as a reactant to form a hydroxo species, H2O is considered as a ligand. By convention, the index h takes a negative value in this case. Overall stability constants βmlh related to Eq. (1) are defined by Eq. (2) in the molar scale (M or mol L−1). Stepwise ligand protonation constants (K01h) are related to the overall equilibrium constant (β01h) by Eq. (3):
| (1) |
| (2) |
| (3) |
For ionic strength corrections and estimation of the molal activity coefficients γi of an ion of charge zi (Eq. (4)), the Brønsted–Guggenheim–Scatchard Specific Ion Interaction Theory (SIT) was applied [52–54]. Constants extrapolated to zero ionic strength (i.e. infinite dilution) are noted with a superscript . The empirical ion interaction coefficients ɛ(i,j) pertaining to a pair of ions of opposite charges zi and zj were taken from the NEA–TDB reviews [36]. Standard deviations of values were computed according to the error-propagation rule [55]:
| (4) |
Molar concentrations were converted into molalities (mol kg−1 or m) using the solution densities compiled by Söhnel and Novotny [56]. Accordingly, the following molalities were obtained for the 0.9 M HNO3 + 0.1 M KNO3 mixture (mH+ = 0.930 m, mK+ = 0.103 m, ) and for a molar KNO3 solution (). In the molal scale, equilibrium constants are noted as and calculated according to the relationship (5), where is the sum of the stoichiometric coefficients of a general reaction expressed as , while mi and ci refer to the molality and the molarity of solute i, respectively:
| (5) |
3.1.2 Plutonium hydroxo complexes
Plutonium(IV) is well known to form even in strongly acidic conditions both soluble and insoluble hydrolyzed species of general formula [Pu(OH)y](4−y)+ and Pu(OH)4(am), respectively. Hydrolysis is further complicated by its propensity to form small clusters and what are referred to as eigencolloids or polymerized hydrous oxyhydroxo polymetallic species at pH values slightly above the solubility limit of amorphous Pu(OH)4(am).
The formation constants at infinite dilution for four soluble hydroxo complexes (y = 1–4) are reported in the NEA–TDB review [10]. The appropriate SIT formula given by Eq. (6), where Δz2 = (4−y)2 + y − 16 and Δɛ = ɛ(Pu(OH)y(4−y)+,NO3−) + yɛ(H+,NO3−) − ɛ(Pu4+,NO3−), enabled to derive the corresponding apparent equilibrium constants (β10−y) in 1 M KNO3 solutions (Table 1):
| (6) |
Formation constants at zero ionic strength for [Pu(OH)y](4−y)+ and [Pu(NO3)y](4−y)+ and specific ion interaction coefficients (kg mol−1) with NO3− considered in this work
| [Pu(OH)y](4−y)+ | y | ɛ(Pu(OH)y(4−y)+,NO3−) | |
| 1 | 0.6(2) | 0.10(1) | |
| 2 | 0.6(3) | 0.097(9) | |
| 3 | −2.3(4) | 0.095(9) | |
| 4 | −8.5(5) | 0 | |
| [Pu(NO3)y](4−y)+ | y | ɛ(Pu(NO3)y(4−y)+,NO3−) | |
| 1 | 1.9(1) | 0.68(4) | |
| 2 | 4.5(4) | 0.96(6) |
The water activity in 1 M KNO3 (aw = 0.9722) was calculated from the molal osmotic coefficient tabulated by Robinson and Stokes [57]. While the value for ɛ(H+,NO3−) = 0.07(1) kg mol−1 was retrieved from Ref. [36], no data are available for ɛ(Pu4+,NO3−) in the literature. Hence, this parameter was assumed to be equal to that reported for thorium, ɛ(Pu4+,NO3−) ≈ ɛ(Th4+,NO3−) = 0.11(2) kg mol−1. The unknown interaction coefficients between the plutonium hydroxo species and nitrate anions were approximated according to the relation given by Ciavatta (Table 1), although Eq. (7) was originally proposed only for y = 1 or 2 with an estimated average deviation of 0.05 kg mol−1 [58]. For y = 4, the interaction coefficient was neglected, as Pu(OH)4 is neutral:
| (7) |
The NEA–TDB recommended solubility product of aged Pu(OH)4(am) at infinite dilution and T = 298.15 K [12] was used in conjunction with the corresponding SIT formula to extrapolate the equilibrium constant related to equilibrium (8) at I = 1 M KNO3. The value of log K10−4(am) = 0.4(5) was considered throughout in speciation calculations. These enabled to estimate the pH above which precipitation of plutonium hydroxide should occur and thereby the truncation limit of the refined titration data:
| (8) |
3.1.3 Plutonium nitrates
As evidenced by a number of experimental techniques, including ion-exchange chromatography, solvent extraction, visible absorption spectrophotometry, 15N NMR spectroscopy, and EXAFS [14–16,18,59], Pu4+ is able to bind up to six nitrate anions to form moderately strong complexes of [Pu(NO3)y](4−y)+ general formula, although the pentanitrato compound has not yet been identified [10]. In the range of 0–3 M nitric acid concentrations, the solution speciation is restricted only to the mono- and the dinitrato complexes. The NEA–TDB review gives for the formation of the monocomplex [Pu(NO3)]3+, but provides neither a critical value for the stability constant pertaining to the dinitrato species [Pu(NO3)2]2+, nor the associated specific ion interaction coefficients [10]. For these reasons, the reliable data in perchloric acid available in Ref. [10], enriched with the most recent values proposed by Berg et al. [18], were reanalyzed by the SIT method using the following expression for Δɛ = ɛ(Pu(NO3)y(4−y)+,ClO4−) + yɛ(H+,NO3−) − ɛ(Pu4+,ClO4−). Best estimates of and ɛ(Pu(NO3)y(4−y)+,ClO4−) for y = 1 and 2 obtained by linear least-squares minimization are summarized in Table 1. In the following, the unknown interaction coefficient ɛ(Pu(NO3)y(4−y)+,NO3−) is taken equal to ɛ(Pu(NO3)y(4−y)+,ClO4−). Extrapolated formation constants of [Pu(NO3)]3+ and [Pu(NO3)2]2+ in 0.9 M HNO3 + 0.1 M KNO3 and 1 M KNO3 are included in Table 2.
Thermodynamic parameters considered in this work for EDTA4− (L4−) protonation and plutonium(IV) complex formation with nitrates, hydroxides, and EDTA4−
| Reaction | Constanta (I = 1 M, T = 298.2(1) K) | |||
| Pu4+ + NO3− ⇌ [Pu(NO3)]3+ | log β110 | −0.4(1) | −0.2(1)b | |
| Pu4+ + 2NO3− ⇌ [Pu(NO3)2]2+ | log β120 | 0.5(4) | 0.9(4)b | |
| Pu4+ + H2O ⇌ [Pu(OH)]3+ + H+ | log β10−1 | −0.7(2) | ||
| Pu4+ + 2H2O ⇌ [Pu(OH)2]2+ + 2H+ | log β10−2 | −1.6(3) | ||
| Pu4+ + 3H2O ⇌ [Pu(OH)3]+ + 3H+ | log β10−3 | −5.0(4) | ||
| Pu4+ + 4H2O ⇌ Pu(OH)4 + 4H+ | log β10−4 | −11.2(5) | ||
| L4− + H+ ⇌ LH3− | log K011 | 9.80c | 10.15d | 10.34e |
| LH3− + H+ ⇌ LH22− | log K012 | 6.16c | ||
| LH22− + H+ ⇌ LH3− | log K013 | 2.39c | ||
| LH3− + H+ ⇌ LH4 | log K014 | 2.07c | ||
| LH4 + H+ ⇌ LH5+ | log K015 | 1.33c | ||
| LH5+ + H+ ⇌ LH62+ | log K016 | −0.03c | ||
| Pu4+ + L4− ⇌ Pu(L) | log β110 | 25.8(2)f | 26.2(4)a | |
| Pu4+ + L4− + H2O ⇌ [Pu(L)(OH)]− + H+ | log β11−1 | 21.78(4)g | 21.86(1)h | |
| Pu4+ + 2L4− ⇌ [Pu(L)2]4− | log β120 | 35.68(4)g | 35.70(1)h | |
| Pu4+ + 2L4− + H+ ⇌ [Pu(L)2H]3− | log β121 | 42.72(4)g | 42.67(1)h | |
| Pu4+ + 2L4− + 2H+ ⇌ [Pu(L)2H2]2− | log β122 | 45.41(2)g | 45.34(1)h |
a Unless noted otherwise, the supporting electrolyte is 1 M KNO3.
b Calculated for I = 1 M (0.9 M HNO3 + 0.1 M KNO3).
c Calculated for [K+] = 1 M according to Eq. (9) and the data taken from Ref. [36].
d Calculated for [K+] = 0.3 M according to Eq. (9) and the data taken from Ref. [36].
e Calculated for [K+] = 0.1 M according to Eq. (9) and the data taken from Ref. [36].
f I = 1 M (0.9 M HNO3 + 0.1 M KNO3), T = 296(1) K. Average value of five independent replicates measured by visible absorption spectrophotometry.
g Arithmetic mean and standard deviation of at least three independent replicates measured by potentiometry. If the error on log β110 is included, the standard deviation becomes equal to 0.4.
h Value obtained by simultaneous refinement of all potentiometric data corresponding to nine independent titrations. If the error on log β110 is included, the standard deviation becomes equal to 0.4.
3.1.4 Ligand protonation
Although the acid–base properties of the hexaprotic ligand EDTA4− (0 ≤ h ≤ 6) are now well understood and reliable protonation constants are available for a wide spectrum of experimental conditions [36], commercial EDTAH4 of high purity (≥99.999%) was subjected to glass-electrode potentiometric titrations. Numerical analysis of the alkalimetric titration curves acquired between pH 1.5 and 11.2 in 1 M KNO3 solutions at 298.2(1) K enabled to determine only four out of the six stepwise protonation constants. The experimental values found for log K011 = 9.78(1), log K012 = 6.17(3), log K013 = 2.36(3), and log K014 = 1.99(6) correspond to the average of six replicates and are in excellent agreement with the NEA–TDB recommended ones summarized in Table 2 for [K+] = 1 M [36]. Hence, only the later critically selected values were used in further studies for the sake of consistency.
The apparently lower than expected value for the first protonation constant (K011) reflects the direct competition between H3O+ and K+ from the background electrolyte present in high concentration. Hence, the apparent K011 values at any potassium concentrations different from 1 M were computed by Eq. (9), which takes into account the formation of [K(EDTA)]3− (log β110 = 0.58 ± 0.73, I = 1 M KNO3, T = 298.2 K) [36]:
| (9) |
3.2 Plutonium complexation
3.2.1 Spectrophotometric studies at [HNO3] > 10−2 M
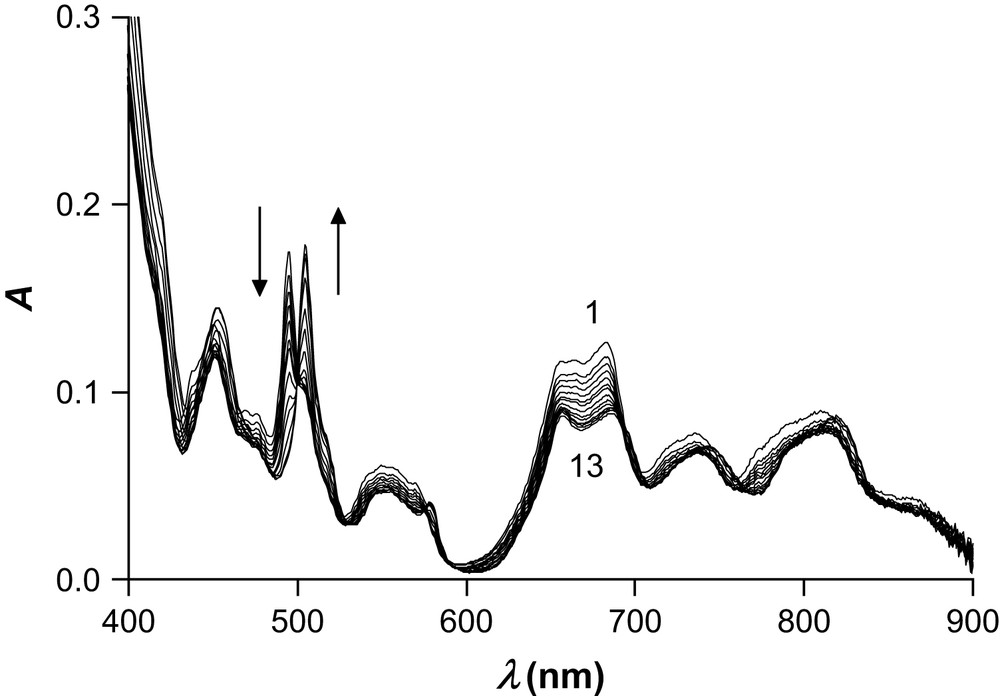
Following the procedure of Boukhalfa et al. [37], plutonium(IV) chelation was monitored at 296(1) K by absorption spectrophotometry as a function of Na2[(EDTA)H2] concentration at fixed nitric acid concentrations, while maintaining the total ionic strength constant at 1 M by adding the required amount of KNO3 ([HNO3] = 0.9 M + [KNO3] = 0.1 M and [HNO3] = 0.7 M + [KNO3] = 0.3 M). The initially brown solutions turned to a pale orange after addition of 2.5 equivalents of ligand without appearance of a precipitate. A typical set of spectra recorded between 400 and 900 nm is depicted in Fig. 1. It shows the progressive decrease of the characteristic absorption peak of plutonium(IV) nitrato species centered at 476 nm and the concomitant appearance of new ones at 451 and 496 nm. The three bands assigned to free plutonium that appear above 600 nm experience both a bathochromic shift and a hyperchromic effect, whereas the feature at 854 nm vanishes into a broad shoulder upon EDTA addition.
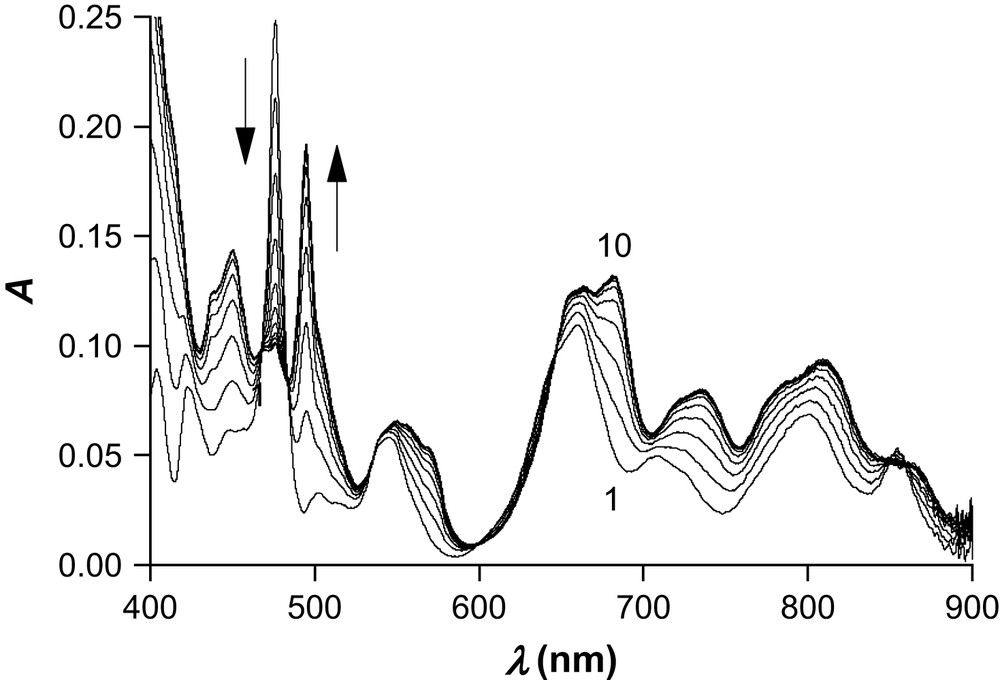
Spectrophotometric titration of Pu(IV) with increasing amounts of Na2[(EDTA)H2] in aqueous solution. I = 1 M ([HNO3] = 0.9 M + [KNO3] = 0.1 M), T = 296(1) K, nPu = 0.035 mmol, nEDTA = 0–0.0875 mmol, V0 = 10.15 mL, l = 1 cm. Only one spectrum out of three is shown for the sake of clarity.
At both nitric acid concentrations, the occurrence of several isosbestic points suggests a single equilibrium with only two spectroscopically distinguishable species (a definite mixture of nitrato species and EDTA-bound Pu(IV)). This assumption was further confirmed by factor analysis of the complete multiwavelength data array with the program Specfit. Subsequent refinement by nonlinear least-squares of the observed absorbance data confirmed the hypothesized model that included the six protonated EDTA species and the Pu(EDTA) complex. As found previously [37], consideration of protonated [Pu(EDTA)Hh]h+ or dileptic [Pu(EDTA)2Hh](4−h)− species did not afford acceptable adjustment, suggesting that all six donor atoms of a single molecule are bound to plutonium(IV). The best estimates of the apparent formation constant β110 at both nitric acid concentrations were in good agreement (log β110 = 25.8(1) and 25.5(1) for [H+] = 0.9 and 0.7 M, respectively). Moreover, for each titration, identical values within experimental error were obtained by fitting the spectrophotometric data either with Hyperquad or with Specfit. The arithmetic mean of five independent measurements is presented in Table 2, while Fig. 2 shows the calculated absorption spectra of both Pu(EDTA) and Pu(IV) in 1 M nitric medium. The characteristic bands of Pu(EDTA) at λmax = 451 and 496 nm have a molar absorption coefficient of 45.7 and 59.1 M−1 cm−1, respectively.
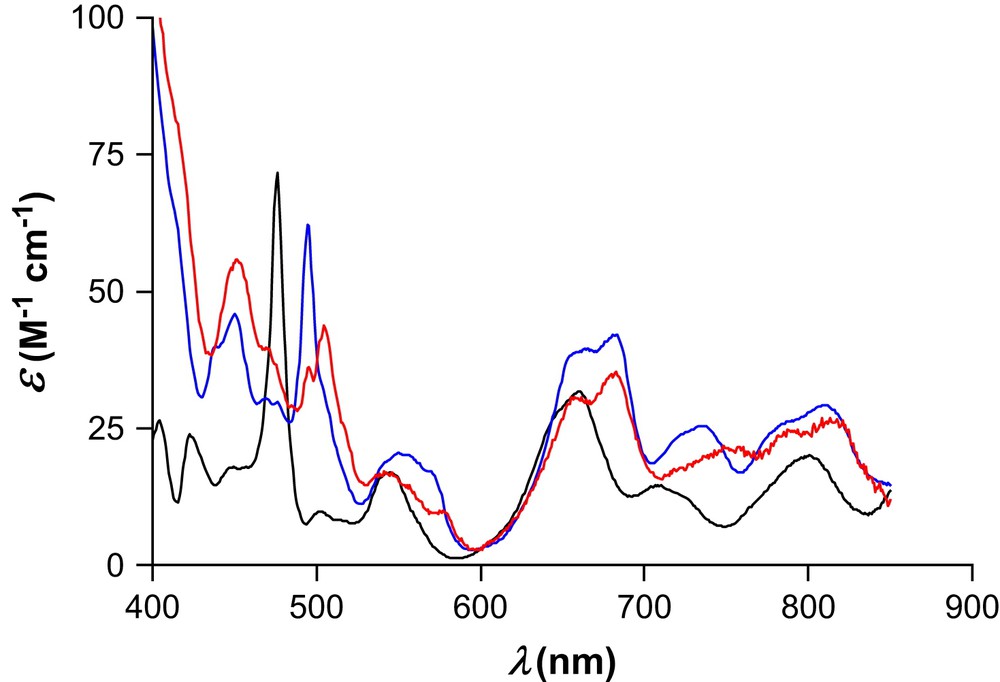
Calculated electronic absorption spectra in aqueous solution of Pu(IV) (black line, I = 1 M (H,K)NO3, T = 296(1) K), Pu(EDTA) (blue line, I = 1 M (H,K)NO3, T = 296(1) K), and [Pu(EDTA)(OH)]− (red line, I = 1 M KNO3, T = 298.2(1) K). (For interpretation of the references to color in this figure legend, the reader is referred to the web version of this article.)
An additional spectrophotometric control experiment was conducted by titrating equimolar amounts of plutonium(IV) and Na2[(EDTA)H2] at I = 1 M with molar nitric acid, thus covering the range from [H+] = 10−2 down to 0.88 M (data not shown). After correcting the collected absorption spectra for dilution, the sole spectral evolution that could be detected was related to the progressive dissociation of the Pu(EDTA) complex upon acidification below [H+] ∼ 0.1 M (100% formation above), in agreement with the species distribution calculations (vide infra). However, due to a large dilution effect and concomitant variation of the K+ concentration over the titration, no attempts to refine these data were made.
3.2.2 Medium effect corrections of β110
Since the β110 formation constant has been determined at a fixed total nitrate concentration of 1 M, it is necessary to take into account the stability of both [Pu(NO3)]3+ and [Pu(NO3)2]2+ nitrato complexes (Table 1). Correction of the experimentally measured apparent value is readily achieved with Eq. (10). Accordingly, β110 is underestimated by 0.96 logarithmic unit if the competition of NO3− anions for plutonium binding is neglected under the present conditions:
| (10) |
Extrapolation of to zero ionic strength using the SIT approach is not as straightforward as expected at first sight. Indeed, the formal description of Pu(EDTA) formation using Eq. (11) has no direct physical meaning, as it does not take into account the effective protonation state of the ligand interacting with Pu4+ under the real experimental conditions. Due to the high stability of the plutonium chelate, spectrophotometric measurements were performed at high acid concentration ([H+] = 0.9 M) in a mixed medium composed of HNO3 and KNO3. It follows that both background electrolytes have to be considered for estimating the activity coefficient of EDTA4− according to the SIT expression given by Eq. (4). While the interaction coefficient ɛ(K+,EDTA4−) = 1.07 ± 0.19 kg mol−1 is given in the literature [36], the value for ɛ(H+,EDTA4−) is unavailable and moreover directly inaccessible from experience:
| (11) |
Considering a chemical equilibrium involving only cationic and neutral species (e.g. Eq. (12)) enables to circumvent most conveniently this problem. Indeed, the apparent equilibrium constant K∗ defined by Eq. (13) can be extrapolated to zero ionic strength (K0∗) using the SIT approach. Expression (17) is obtained by combining Eqs. (13)–(16), while ignoring the interaction coefficients for the uncharged species (ɛ(Pu(EDTA),KNO3) = ɛ(Pu(EDTA),HNO3) = 0 kg mol−1). Although Hummel et al. derived the coefficient ɛ(U(EDTA),NaClO4) = −(0.19 ± 0.19) mol kg−1 from experimental data and recommend to use by analogy the same value for ɛ(Np(EDTA),NaClO4) [36], the large uncertainty together with the dissimilarity in supporting electrolytes supports our assumption:
| (12) |
| (13) |
| (14) |
| (15) |
| (16) |
| (17) |
| (18) |
It can then be easily shown that the sought value is related by Eq. (18) to K0∗ and to the corresponding overall protonation constant , available from the NEA–TDB review [36]. To convert K∗ from the molarity into the molality concentration scale (Km∗) with relation (5), it was necessary to know the density (ρ) of the supporting electrolyte solution. Since no value for ρ could be found in the literature, the density of a 0.9 M HNO3 and 0.1 M KNO3 mixture (average molecular weight of 0.06682 kg mol−1) was experimentally determined by weighing 100 mL of this solution in a calibrated volumetric flask. The measured weights were also corrected for the buoyancy effect. The average of eight replicates yields ρ = 1.0343(4) kg dm−3 at 22.5(5) °C, which is in good agreement with the approximation given by the method of Young and Smith (ρ = 1.042 kg dm−3) based on colligative properties of single electrolytes [60,61].
Applying this procedure to the reaction between Pu4+ and EDTAH62+, EDTAH5+ or EDTAH4 affords three values for that are consistent within 0.05 logarithmic unit. The mean value was retained and used to estimate the apparent equilibrium constant valid at I = 1 M KNO3 required for processing the potentiometric data (log β110 = 26.2(4)). All the specific interaction coefficients involved in these calculations were retrieved from Ref. [36]: ɛ(H+,NO3−) = 0.07 ± 0.01, ɛ(Th4+,NO3−) = 0.11 ± 0.02, ɛ(EDTAH62+,NO3−) = −(0.20 ± 0.16), ɛ(EDTAH5+,NO3−) = −(0.23 ± 0.15), ɛ(EDTAH4,KNO3) = −(0.29 ± 0.14), ɛ(K+,EDTA4−) = 1.07 ± 0.19, and ɛ(K+,NO3−) = −(0.130 ± 0.002) kg mol−1.
3.2.3 Potentiometric studies at [HNO3] < 10−2 M
If Pu(EDTA) is the only species formed up to pH 2, a number of hydrolyzed [Pu(EDTA)(OH)h]h− (h = 1–3) and dileptic [Pu(EDTA)2Hh](4−h)− complexes has been proposed to appear at higher pH values [28,37]. Therefore, potentiometric titrations were performed between pH 1.8 and ∼10 at three different metal-over-ligand molar ratios (1:1, 1:1.5, and 1:2). The shape differences of the pH-metric titration curves shown in Fig. 3 confirm this behavior. However, appearance of precipitates precluded the investigation of the higher pH region.
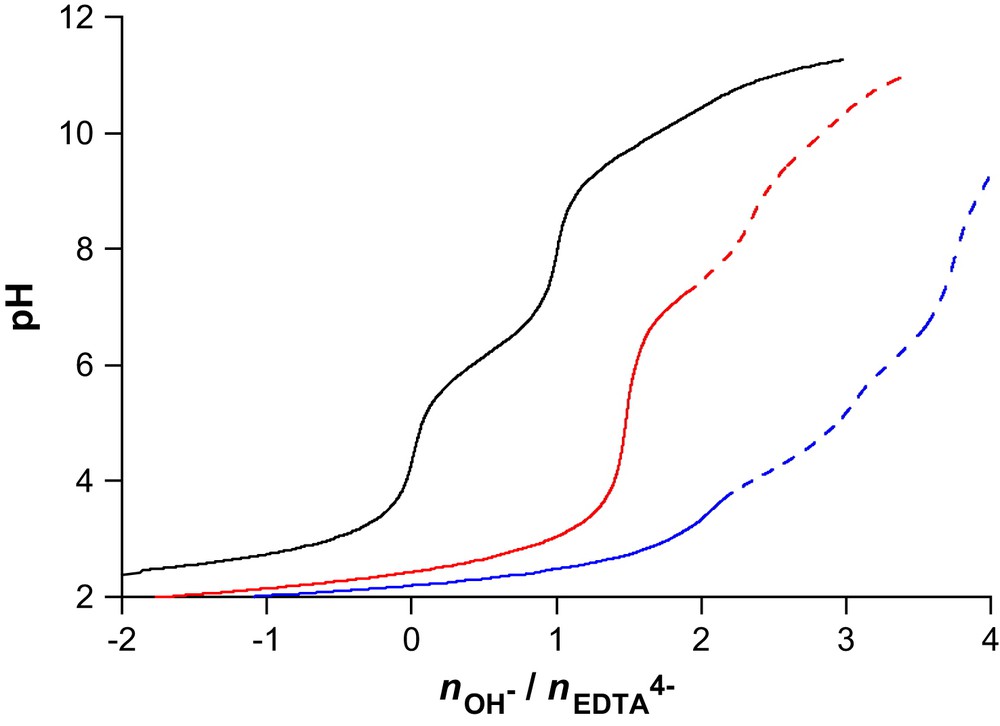
Potentiometric titration curves for the Pu(IV)–EDTAH4 system using standardized 0.100 M KOH as base. I = 1 M KNO3, T = 298.2(1) K, nEDTA = 0.10 mmol (black line), nPu = nEDTA = 0.05 mmol (blue line), nPu = 0.05 mmol, nEDTA = 0.10 mmol (red line). Data corresponding to the dotted section were excluded in the final refinement cycle due to the precipitation of Pu(OH)4(am). (For interpretation of the references to color in this figure legend, the reader is referred to the web version of this article.)
Although special care was taken to allow enough time between each addition of a base increment to reach a stable potential reading, green precipitates could be observed when solutions were allowed to stand overnight even at pH values higher than 7–8, indicating some very slow hydrolysis. This observation prompted us to analyze the potentiometric data collected for a given Pu:EDTA molar ratio according to an iterative process sought to ensure internal consistency of the final model. In the first step, the entire data sets were processed by the nonlinear squares refinement program Hyperquad. Once the optimal fit was obtained, distribution curves were calculated as a function of pH with the program Hyss using the same concentrations and best estimates of the equilibrium constants retrieved from Hyperquad, but taking also into account the solubility product of Pu(OH)4(am). This procedure allowed to predict the pH value at which insoluble plutonium hydroxide should start to precipitate out. Consequently, all points recorded under pseudo-equilibrium conditions were excluded and the truncated data set reanalyzed in the same way until convergence was reached.
Following this conservative procedure, reliable data for a 1:1 molar ratio ([Pu]tot = [EDTA]tot = 4.67 mM) are restricted to a rather narrow pH range (1.8–3.5) where formation of [Pu(EDTA)(OH)]− occurs exclusively (Table 2). No evidence for any higher order hydroxide was found in this region, although the presence of a third inflection point in the titration curve corresponding to 4 equivalents of added base suggests the appearance of a second hydrolysis product above pH 6 [37], which has not been considered in the present work based on the abovementioned arguments.
At a 1:2 molar ratio, precipitation was predicted to spoil the titration data at pH values higher than 6.5 (vide infra). The best fit was obtained by taking into account three dileptic complexes of formula [Pu(EDTA)2Hh](4−h)− (h = 0–2), while fixing the previously found equilibrium constants β110 and β11−1 in addition to the protonation constants of EDTA4− (β01h, h = 1–6) as well as the hydrolysis constants of plutonium hydroxide (β01−y, y = 1–4). To further ascertain the internal consistency of our model, the data sets corresponding to a 1:1 molar ratio were reanalyzed by maintaining the estimates of β12h constant and reoptimizing β11−1. When a slightly different value was found, this procedure was repeated until convergence to a unique set of equilibrium constants. The final values corresponding to the average of three experiments are summarized in Table 2. Since both mono- and bis-EDTA chelates are prevailing in the distribution diagram computed at a 1:1.5 molar ratio, this cyclic approach proved to be particularly valuable. Finally, all the nine independent titration curves were merged into a single file and a global fitting of the whole set of potentiometric data was attempted in order to check the robustness (i.e. presence of minor species) of the proposed model. As expected, the simultaneously refined values of β11−1, β120, β121, and β122 were in excellent agreement with the averages derived from single-curve modeling (Table 2), although lower errors were returned by the global fitting routine. Standard deviations (σN−1) of the arithmetic means reported in Table 2 might reflect more accurately the real experimental error.
Species distribution diagrams for both 1:1 and 1:2 molar ratios shown in Fig. 4 were generated with the thermodynamic parameters summarized in Tables 1 and 2 for I = 1 M KNO3. The chemical model included the five [Pu(EDTA)lHh](4−4l+h)+ complexes characterized so far, the six protonated species of EDTA4−, the four [Pu(OH)h](4−h)+ (h = 1–4) and the two [Pu(NO3)y](4−y)+ (y = 1, 2) complexes, as well as the possibly precipitating solid phase Pu(OH)4(am). These speciation calculations highlight the strong propensity of plutonium(IV) to hydrolyze and to fall out as the insoluble tetrahydroxide, even at moderately low proton concentrations. In equimolar conditions, Pu(EDTA) is the only species present over the pH range 0.8–2, while the molar fraction of [Pu(EDTA)(OH)]− is close to reach its maximum at pH values where Pu(OH)4(am) starts to precipitate. The higher hydrolyzed complexes [Pu(EDTA)(OH)h]h− (h = 2–3) evoked in the literature [28,37] were not considered in the present work as these might form only above the saturation limit of Pu(OH)4(am) under the present experimental conditions. Hence, the species distribution shown in Fig. 4a might not be representative of the exact situation above pH 3.5. In the presence of a twofold excess of EDTA, millimolar amounts of plutonium(IV) are maintained in solution at least up to pH 6.5, as a direct consequence of the formation of [Pu(EDTA)2H2]2− but mainly of [Pu(EDTA)2H]3−, which is the predominant species between pH 3.5 and 6.5. The fully deprotonated dileptic [Pu(EDTA)2]4− species starts to appear around pH 5 as suggested by Boukhalfa et al. [37]. For both molar ratios, none of the soluble [Pu(OH)y](4−y)+ hydroxide is formed in any appreciable amount, while [Pu(NO3)2]2+ is the only form of free plutonium present at very high H3O+ concentrations, albeit in a small proportion that does not exceed 20% in 1 M nitric acid.

Speciation diagrams for the Pu(IV)–EDTAH4 system. I = 1 M KNO3, T = 298.2(1) K. (a) [Pu(IV)]tot = [EDTA]tot = 2.5 mM, (b) 2 [Pu(IV)]tot = [EDTA]tot = 5 mM.
3.2.4 Spectrophotometric studies at [HNO3] < 10−2 M
The hydrolysis of the Pu(EDTA) chelate has also been studied by visible absorption spectrophotometry from pH 1.5 to 3.8. A representative set of raw spectra is displayed in Fig. 5. Besides an overall decrease of the optical density due in part to dilution, the most prominent changes of the spectral morphology concern the absorption band centered at 496 nm that undergoes a hypochromic effect together with a slight bathochromic shift. Since the [Pu(OH)y](4−y)+ (y = 1–4) hydroxo complexes do not form in any appreciable amount, these species were excluded from the model used to fit simultaneously the potentiometric and spectrophotometric data with Hyperquad and Specfit. Moreover, it has recently been shown that the normalized absorption spectra of at least the first and the second hydroxo complex do not differ from those of the hydrated Pu4+ ion in 0.5 M (H,Na)Cl [13]. The average value of the first hydrolysis constant of Pu(EDTA) from two independent measurements (log β11−1 = 21.79(1)) is in excellent agreement with the potentiometric value reported in Table 2, while the calculated absorption spectrum of [Pu(EDTA)(OH)]− is included in Fig. 2.
Spectrophotometric titration of Na2[(EDTA)H2] in the presence of Pu(IV) as a function of pH in aqueous solution. I = 1 M KNO3, T = 298.2(1) K, [Pu(IV)]tot = 4.67 mM, [EDTA]tot = 4.67 mM, [KOH] = 0.100 M, V0 = 10.713 mL, l = 1 cm. Spectra 1–10: pH = 1.55 (Vb = 0 mL), 1.58 (Vb = 0.483 mL), 1.62 (Vb = 0.983 mL), 1.69 (Vb = 1.484 mL), 1.76 (Vb = 1.984 mL), 1.84 (Vb = 2.485 mL), 1.93 (Vb = 2.986 mL), 2.05 (Vb = 3.486 mL), 2.23 (Vb = 4.087 mL), 2.39 (Vb = 4.488 mL).
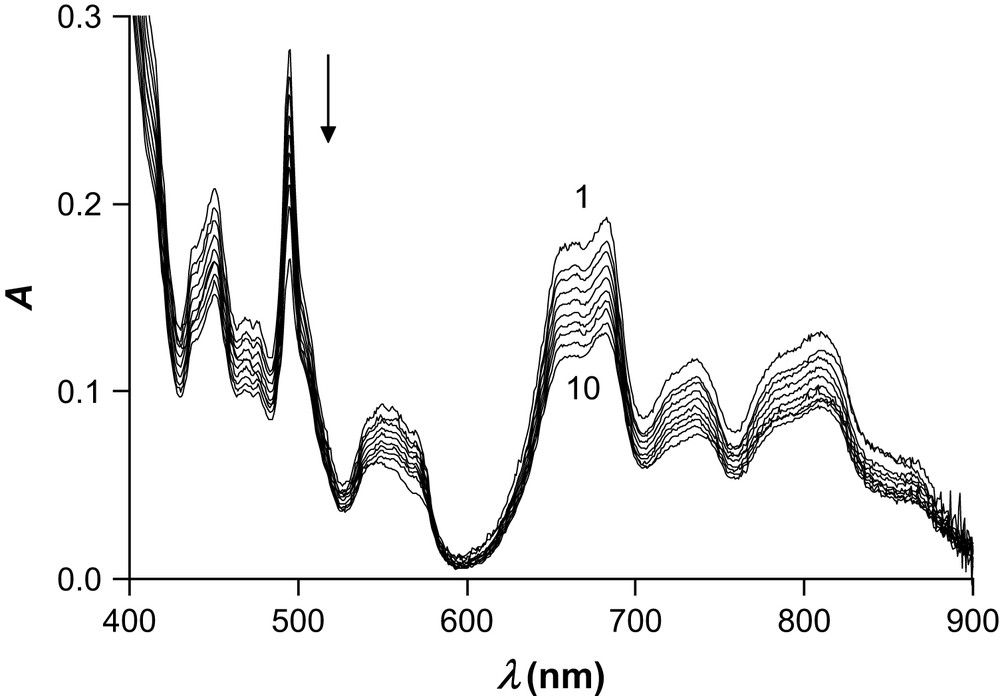
As suggested by the potentiometric studies and distribution diagrams, three dileptic complexes can form in solutions containing 2 equivalents of EDTA. In an attempt to better characterize these species and their formation equilibria, additional measurements were performed using visible absorption spectrophotometry. The evolution of the electronic spectra as a function of increasing pH for a 1:2 Pu(IV):EDTA mixture shown in Fig. 6 is consistent with the conversion of Pu(EDTA) into new complexes, as evidenced by the progressive disappearance of the characteristic band at 496 nm and concomitant growth of a new peak at 505 nm. Morphological changes can also be observed in the 650–700 nm range, where the absorption manifold undergoes a much larger hypochromic effect than expected from dilution alone. Although the spectra seem to cross around 500 nm, a closer examination of this region reveals the absence of a genuine isosbestic point, as would be expected for a single equilibrium involving two absorbing species. The complex spectral behavior between 400 and 500 nm definitively rules out the latter possibility. From the nonmonotonous absorption profile extracted at λ = 505 nm, the occurrence of at least three different absorbing species can be postulated.
Spectrophotometric titration of Na2[(EDTA)H2] in the presence of Pu(IV) as a function of pH in aqueous solution. I = 1 M KNO3, T = 298.2(1) K, [Pu(IV)]tot = 3.08 mM, [EDTA]tot = 6.17 mM, [KOH] = 0.100 M, V0 = 16.213 mL, l = 1 cm. Spectra 1–13: pH = 1.70 (Vb = 0 mL), 1.84 (Vb = 0.983 mL), 1.98 (Vb = 1.984 mL), 2.15 (Vb = 2.485 mL), 2.30 (Vb = 2.986 mL), 2.39 (Vb = 3.236 mL), 2.64 (Vb = 3.737 mL), 2.91 (Vb = 4.087 mL), 3.16 (Vb = 4.287 mL), 3.61 (Vb = 4.988 mL), 4.21 (Vb = 4.588 mL), 5.98 (Vb = 4.688 mL), 6.63 (Vb = 4.788 mL).
This qualitative interpretation was further substantiated by singular value decomposition of the absorption matrix, which enabled to identify at least three statistically significant eigenvalues. Nonlinear least-squares adjustment using Hyperquad and Specfit provided the following values, log β121 = 42.76(1) and log β122 = 45.33(1), which agree very well with those reported in Table 2. However, the formation constant β120 pertaining to [Pu(EDTA)2]4− could not be determined because of the low number of spectra at pH values close to 6.5 and low degree of formation of the species (vide infra). The electronic absorption spectra of both protonated complexes are displayed in Fig. 7. Characteristic bands are located at λmax = 453 (ɛ = 75.0 M−1 cm−1) and 504 nm (ɛ = 96 M−1 cm−1) for [Pu(EDTA)2H]3− and λmax = 451 (ɛ = 50.2 M−1 cm−1), 495 nm (ɛ = 47.1 M−1 cm−1), and 503 nm (ɛ = 55.0 M−1 cm−1) for [Pu(EDTA)2H2]2−. Uptake of a second proton by [Pu(EDTA)2H]3− gives rise to the splitting into a doublet of the most intense band, which is accompanied by a hypochromic effect, as evidenced by an approximately twofold decrease of the extinction coefficient. As a general trend, the spectra undergo both a slight bathochromic shift and hyperchromic effect following the sequence Pu(EDTA), [Pu(EDTA)2H2]2−, and [Pu(EDTA)2H]3−. Compared to the free plutonium absorption spectrum, which corresponds to a mixture of mono- and dinitrato complexes, the disappearance of the absorption feature centered at 476 nm upon complex formation is a clear indication that at least one and most probably both nitrate anions are displaced by the polyaminocarboxylic chelator. Furthermore, the strong electric field imposed by the bound EDTA4− ligand might explain greater transition probabilities for these forbidden 5f–5f transitions and thus the higher absorption intensities [4].

Calculated electronic absorption spectra in aqueous solution of Pu(IV) (black line, T = 296(1) K, I = 1 M (H,K)NO3), Pu(EDTA) (blue line, T = 296(1) K, I = 1 M (H,K)NO3), [Pu(EDTA)2H2]2− (red line, T = 298.2(1) K, I = 1 M KNO3), and [Pu(EDTA)2H]3− (magenta line, T = 298.2(1) K, I = 1 M KNO3). (For interpretation of the references to color in this figure legend, the reader is referred to the web version of this article.)
4 Discussion
EDTA4− is a hexadentate chelator, which exhibits an extraordinary affinity for tetravalent plutonium. Table 3 summarizes the thermodynamic data available in the open literature. Based on the almost nine orders of magnitude span for β110 (the range reduces to two orders if the apparent values of Foreman and Smith at pH = 3.3 are ignored [31,32]), it becomes obvious that the previously reported formation constants of Pu(EDTA) are essentially unreliable. The high discrepancies might not be unexpected owing to the experimental difficulties inherent to plutonium chemistry and to the graphical instead of computerized data processing used in early studies. Moreover, as outlined in the NEA–TDB volume dedicated to EDTA complexes [36], the reviewer panel could identify numerous shortcomings. Among them, plutonium hydrolysis and some highly protonated forms of EDTA were ignored by Foreman and Smith [31,32], although Klygin et al. [62] and later Krot et al. [63] reevaluated the original data while considering the neglected EDTAH5+ and EDTAH62+ species. Other deficiencies include the use of auxiliary equilibrium constants that were uncorrected for medium effects, the negligence of competitive plutonium binding by anions from the background electrolyte, or the failure to report essential experimental parameters (values of the protonation constants, temperature, calibration procedure of the pH electrode…) [33,34,62].
Summary of the equilibrium constants reported in the literature for the plutonium(IV)–EDTA system
| Reaction | Reference | ||||||||
| This work | [37] | [28] | [34] | [33] | [31] | [32] | |||
| Pu4+ + L4− ⇌ Pu(L) | log β110 | 25.8(2)a | 32.2(3)b | 26.4(2)c | 25.6(6)d | 26.0(5)e | 17.66f | 17.10g | |
| 32.7(3)h | 24.2(1)i | ||||||||
| Pu4+ + L4− + H+ ⇌ [Pu(L)H]+ | log β111 | 28.2(2)j | |||||||
| Pu4+ + L4− + H2O ⇌ [Pu(L)(OH)]− + H+ | log β11−1 | 21.9(4)k | 22.5(5)l | 22.0(1)m | 22.4(4)n | ||||
| Pu4+ + L4− + 2H2O ⇌ [Pu(L)(OH)2]2− + 2H+ | log β11−2 | 15.3(1)m | 16.8(4)n | ||||||
| Pu4+ + L4− + 3H2O ⇌ [Pu(L)(OH)3]3− + 3H+ | log β11−3 | 7.8(4)n | |||||||
| Pu4+ + 2L4− ⇌ [Pu(L)2]4− | log β120 | 35.7(4)k | 36.4(5)l | 35.4(2)m | |||||
| Pu4+ + 2L4− + H+ ⇌ [Pu(L)2H]3− | log β121 | 42.7(4)k | 43.3(5)l | 42.8(1)m | |||||
| Pu4+ + 2L4− + 2H+ ⇌ [Pu(L)2H2]2− | log β122 | 45.3(4)k | 46.0(5)l | ||||||
| Pu4+ + 2L4− + 3H+ ⇌ [Pu(L)2H3]− | log β123 | 47(1)m |
a I = 1 M (0.9 M HNO3 + 0.1 M KNO3), T = 296(1) K.
b Value extrapolated to I = 0 M using the SIT model, T = 296(1) K.
c I = 1 M (0.9 M HClO4 + 0.1 M NaCl), T = 298 K, visible absorption spectrophotometry.
d I = 0.1 M NaClO4, pH = 2.2, T = 293(1) K, polarography.
e I = 0.3 M HNO3, T = 291(3) K, solubility measurements.
f I = 0.1 M KCl, pH = 3.3, T = 293.0(2) K, cation exchange measurements.
g I = 0.1 M KCl, pH = 3.3, T = ?, visible absorption spectrophotometry.
h Value extrapolated to I = 0 M using the SIT model, reported by Boukhalfa et al. in Ref. [38].
i I = 1 M HNO3, T = ?, visible absorption spectrophotometry. This value was later corrected by Klygin et al. (log β110 = 26.15) [62] and by Krot et al. (log β110 = 25.75) [63] for the contribution of EDTAH62+ and (EDTAH5+ + EDTAH62+), respectively. These major species at [H+] = 1 M, were neglected by Foreman and Smith [32].
j I = 0.1 M NaClO4, T = 293(1) K, visible absorption spectrophotometry.
k I = 1 M KNO3, T = 298.2(1) K, potentiometry (global fit). The standard deviation includes the error on log β110.
l Value corrected for the formation of nitrato complexes in 1 M KNO3 using , T = 298.2(1) K. The standard deviation includes the error on log β1l0 for Pu(EDTA) and nitrato complexes.
m I = 0.1 M NaNO3, T = 298 K, potentiometry.
n Value extrapolated to I = 0 M using the Pitzer ion-interaction model, T = 296(2) K.
Although the results of Boukhalfa et al. [37] have not been critically evaluated by Hummel et al. [36], it can be pointed out that no efforts have been made to use NEA selected auxiliary constants for plutonium hydrolysis and EDTA4− protonation (β01h values at I = 0.1 M were retrieved from the compilation of Smith and Martell [64]). Moreover, background electrolytes differing in nature and concentration were used without taking the resulting medium effects into account. Accordingly, β110 was determined by spectrophotometry at I = 1 M in 0.9 M HClO4 with 0.1 M NaCl (log β110 = 26.4(2)), whereas the other equilibrium constants reported in Table 3 were measured by glass-electrode potentiometry at I = 0.1 M using NaNO3 as supporting electrolyte. Considering the rather low NaCl concentration and the weak stability of the chloro complexes (log β110 = 0.3(3) for [PuCl]3+ [10,12]), the influence of chlorides is predicted to be almost insignificant . Most recently, the same authors have published a revised value for log β110 = 27.3(2) [38], but provided no justification for the one-order-of-magnitude difference between the new and the original values. In an attempt to correct β110 for medium effects, other than those due to Cl−, that should impact much more the equilibria, they have extrapolated the overall formation constant to zero ionic strength with the SIT approach. Although the calculations were oversimplified (cf. Section 3.2.2) by assimilating the effective medium to a 1 M NaClO4 solution, the proposed value (log β0110 = 32.7(3)) is in fair agreement with ours (log β0110 = 32.2(3)).
In addition to the great disparity of the overall binding constant for Pu(EDTA), the solution chemistry with respect to the identity of the formed species is still a matter of debate [28,37]. Foreman and Smith inferred from potentiometric titrations the formation of partially hydrolyzed mono- ([Pu(EDTA)(OH)]−) and bimetallic chelates ([Pu2(EDTA)(OH)2]2+), but without quoting any stability constant [31]. However, their results are unreliable, because hydrolysis of free plutonium was ignored. Cauchetier and Guichard claimed the formation of a monoprotonated [Pu(EDTA)H]+ complex (log K111 = 2.6(2)), but found no evidence of hydrolyzed [Pu(EDTA)(OH)h]h− species [34]. In contrast, they were considered by Rai et al. (h = 1–3) for interpreting the solubility data of PuO2(am) suspensions in NaCl solutions containing known quantities of EDTA varying between 10−5 and 9 × 10⁻² M [28]. These authors corrected all equilibrium constants for ionic strength effects using the Pitzer ion-interaction model. Besides the formation of monochelates, partially protonated bis-EDTA complexes have also been documented, albeit only very recently [37]. Their late discovery is somewhat surprising, as a single molecule is obviously unable to fulfill the stereochemical demand of large cations such as Pu4+, which can accommodate from 8 to 12 donor atoms in the first coordination sphere [24,65]. It can therefore be anticipated that the remaining solvent molecules bound to the metal center in Pu(EDTA) can be displaced by a second molecule, thus affording dileptic species when the ligand is in excess.
One of the main aims of the present work was to escape from the aforementioned shortcomings. Hence, all experiments were performed with the same supporting electrolyte system, namely 1 M (H,K)NO3, the most up-to-date thermodynamic parameters available from the NEA–TDB reviews were considered, and medium corrections were applied using the SIT approach when required. Considering the extreme propensity of plutonium(IV) to hydrolyze and to form most insoluble amorphous Pu(OH)4(am), special care was taken with respect to these phenomena in order to minimize systematic errors. Slow kinetics, especially with respect to hydrolysis, represents an additional source of such errors. Therefore, it is of outmost importance to exclude spoiled data points from the refinement process. Since insoluble species cannot be taken into account in the chemical model used to fit the equilibrium constants, it is advisable to perform separate speciation calculations and to check thereby the possible precipitation of a solid phase. Following this conservative approach, it can be shown that Pu(OH)4(am) appears at pH values where no significant instability in potential readings or turbidity of the solution can be visually detected during the course of a potentiometric or spectrophotometric titration, although slow precipitation can occur after several hours or days of standing.
Noteworthy, the first stepwise hydrolysis constant found herein (log K11−1 = 4.3(4)) is in perfect agreement with that reported by Boukhalfa et al. [37]. However, these authors were probably not aware of the aforementioned complications and so they modeled their potentiometric data up to pH 7.5. Based on the presence of a third inflection point in the titration curve, they proposed the formation of an additional hydroxo complex, [Pu(EDTA)(OH)2]2− (log K11−2 = 6.66). Nonetheless, when the latter value and the solubility product of Pu(OH)4(am) are also implemented into the chemical model given in Table 2, speciation calculations performed under the experimental conditions used by Boukhalfa et al. ([Pu(IV)]tot = [EDTA]tot = 25 mM) show that the maximal proportion (αmax) of [Pu(EDTA)(OH)2]2− does not exceed 3% at pH 7.3, while other predominant species are [Pu(EDTA)(OH)]− (αmax = 24% at pH 4.2), [Pu(EDTA)2H]3− (αmax = 44% at pH 5.6), and [Pu(EDTA)2]4− (αmax = 27% at pH 7.4). Whereas the solid Pu(OH)4(am) still starts to fall out at a pH value close to 3.5, the simulated titration curve also shows a third inflection point, but it corresponds to the precipitation of the entire amount of plutonium around pH 9 and not to the second hydrolysis of Pu(EDTA). Occurrence of precipitates is an obvious limitation of the potentiometric technique, which should be systematically tracked in order to avoid misinterpretations. Therefore, the work by Rai et al., who performed careful solubility measurements of amorphous PuO2 as a function of pH ranging from 1 to 13.5 [28], is pertinent and should be considered as the only reliable proof of the existence of such hydroxylated species. However, these authors could get a better fit of their data at pH values lower than 3 by assuming the formation of [Pu(EDTA)(OH)]− instead of Pu(EDTA) and thus neglected the latter species.
If the present study confirms the formation of bis-EDTA complexes first suggested by Boukhalfa et al. [37], a discrepancy remains as far as their exact protonation state is concerned. They reported stability constants for [Pu(EDTA)2]4− (log β120 = 35.4(2)), [Pu(EDTA)2H]3− (log β121 = 42.8(1)), and [Pu(EDTA)2H3]− (log β123 = 47(1)), but not for [Pu(EDTA)2H2]2−. Although there are some precedents in the literature for “missing” complexes in a stepwise sequence [2], such behavior is seldom and was attributed to two overlapping equilibria that could not be resolved. No evidence for [Pu(EDTA)2H3]− was found in the present study as the potentiometric data could be adjusted by considering only the mono- and diprotonated dileptic EDTA complexes. However, applying the truncation method outlined above, only a limited number of data points reflect the formation of [Pu(EDTA)2]4−, and therefore no realistic absorption spectrum could be computed for this species.
Linear Free-Energy Relationships (LFER) provide an other mean to corroborate the reliability of the value derived herein, since it is now well recognized that tetravalent actinides follow the same trends along the series Th4+, U4+, Np4+, and Pu4+ [7]. As an example, a linear correlation is obtained by plotting on bilogarithmic scales the formation constants of EDTA4− complexes (β110) as a function of the first hydrolysis constant (β10−1) of the corresponding metals, which holds not only for trivalent lanthanides, but also for tri- and tetravalent actinides [37], highlighting the electrostatic nature (i.e. ionic character) of the binding interaction. As the most acidic cation, Pu4+ possesses also the highest affinity for EDTA4−. Based on these considerations, a linear dependence of values with the charge density of the metal ion (z2/ri) or with the reciprocal of the ionic radius (1/ri) might be anticipated. The Born theory provides a theoretical background for these empirical relationships for cations of same charges. To draw Fig. 8, formation constants at zero ionic strength for the uranium(IV) and neptunium(IV) complexes of EDTA4− were taken from the NEA–TDB review [36]. For thorium(IV), the IUPAC [5,66] and NIST [2] recommended value of Schwarzenbach et al. (log β110 = 23.2(1), I = 0.1 M KNO3, T = 293 K) [67] has been corrected for [Th(NO3)]3− formation (log β110 = 1.22(3), I = 2 M H(NO3,ClO4) [68]; ) and extrapolated to zero ionic strength to afford . The excellent alignment of the values for the four An(EDTA) complexes as a function of 1/ri for ionic radii corresponding to a coordination number equal to eight [69] confirms the preponderance of electrostatic interactions and provides additional confidence for the accuracy and consistency of the Pu(EDTA) binding constant measured in this work.

Correlation between the formation constant at zero ionic strength of An(EDTA) complexes and the reciprocal ionic radii (ri) of the ligated An4+ cations (An4+ = Th4+, U4+, Np4+, Pu4+); ri values corresponding to a coordination number equal to eight are taken from Ref. [69]. Stability constants for Th4+, U4+, Np4+ (●) were retrieved from Refs. [36,67], while those for Pu4+ correspond to the value determined herein (■) or that proposed by Boukhalfa et al. (□) in Ref. [38]. T = 298.2(1) K.
Besides electrostatic interactions, several other factors might affect the stability of actinide(IV) complexes, such a steric and stereochemical constrains, chelate ring sizes, coordination numbers, degree of covalency… Hence, it is often useful to correlate the Gibbs free energy of complexation pertaining to two different metal cations for a given ligand set. As an example, the thorium(IV) and plutonium(IV) binding constants at infinite dilution for a number of negatively charged donors encompassing monodentate and bidentate anions and ligands by higher denticity such as EDTA4− and the related complexones CDTA4− and DTPA5− [70], are compared in Fig. 9. Similar vs. plots were obtained when U4+ or Np4+ was considered as the metal of reference. Noteworthy, the slope of the regression lines is tending towards unity as the reference actinide is becoming closer to plutonium. According to these LFERs, the strain energy that could result from the formation of five-membered chelate rings around the metal center does not affect the binding free energy for polyaminocarboxylate ligands like EDTA4−. Although no structural data are currently available for Pu(EDTA), the linear plots in Figs. 8 and 9 suggest similar coordination geometries for the various An4+ cations. A search of the Cambridge Structural Database [71] returned the atomic coordinates of only two actinide(IV) complexes of EDTA4−, namely the isomorphous trisguanidinium salts of [U(EDTA)F3]3− and [Th(EDTA)F3]3− [72]. The coordination polyhedron is best described as a slightly distorted square antiprism with one nitrogen atom capping the (F,O,N,O) face, while the ethylenediamine fragment adopts a gauche conformation. All essential structural features of the uranium and thorium complexes are reminiscent of those formed with the trivalent lanthanides. However, coordination numbers as high as 12 have been reported for plutonium [73], and therefore other stereochemical arrangements of the ligand and water molecules in the first coordination sphere can be anticipated, which could also account for the formation of the protonated dileptic species.
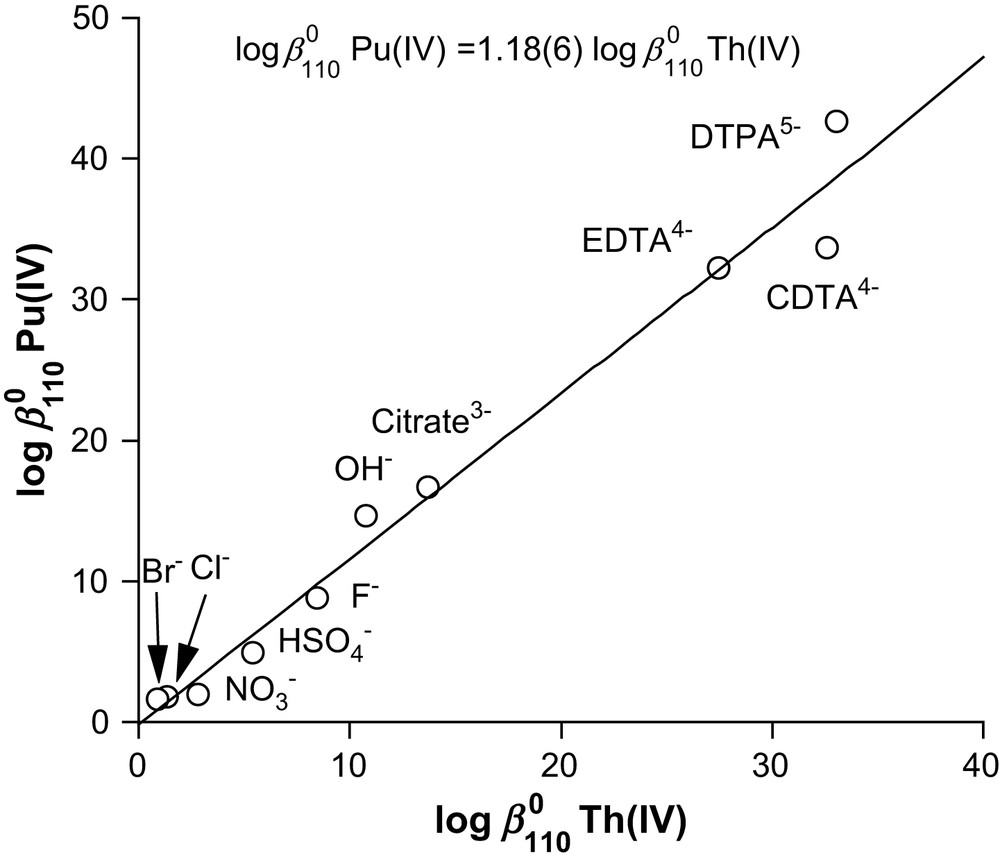
Linear free-energy relationship between the formation constant at zero ionic strength for plutonium(IV) and thorium(IV) complexes. T = 298.2(1) K. Values were taken from Refs. [2,10,12,36,67,68,70,74].
5 Conclusion
Although several authors have investigated the Pu(IV)–EDTA system during the last 50 years, all of these studies failed to produce reliable data, not only with respect to the stability of the formed species, but also with respect to their identity. The nonobservance of strictly controlled experimental conditions provides the most obvious explanation for this situation. To overcome this pitfall, data were acquired with great care as far as the plutonium disproportionation, formation kinetics, and Pu(OH)4(am) precipitation are concerned. Combining absorption spectrophotometric and high-precision potentiometric measurements with a global data refinement procedure, that progressively eliminates data points recorded under pseudo-equilibrium conditions due to the slow precipitation of the highly insoluble Pu(OH)4(am) phase enabled to propose a new set of NEA–TDB compliant equilibrium constants.
Because of its relevance to the nuclear industry, a nitric medium was chosen to revise the binding equilibria at a constant ionic strength of 1 M using KNO3 and HNO3 as supporting electrolytes. Under these conditions, the existence of at least five plutonium(IV) chelates of EDTA4− could be ascertained and their apparent formation constants derived. Their respective formation domain was deduced from speciation calculations by taking into account the most recent value of the solubility product recommended for Pu(OH)4(am). For the first time also, the electronic absorption spectra for four of these complexes, namely Pu(EDTA), [Pu(EDTA)(OH)]−, [Pu(EDTA)2H]3−, and [Pu(EDTA)2H2]2−, could also be calculated. However, a deficit of reliable data at pH values close to the neutrality did not enable to extract a realistic visible absorption profile for the fifth one, [Pu(EDTA)2]4−. Following the recommendations of IUPAC and NEA–TDB, the experimental formation constant found for Pu(EDTA) was extrapolated to zero ionic strength by applying the specific ion interaction theory . This estimate compares favorably well with the value predicted from linear free-energy relationships and conforms to the trend found for the complexation of tetravalent post-plutonium actinides (U4+, Th4+, and Np4+) not only by EDTA4−, but also by other polyaminocarboxylates, such as CDTA4− and DTPA5−. Thermodynamic studies related to the latter two ligands will be published in due course. As expected, the main factor responsible for the stability of Pu(EDTA) is related to the most favorable electrostatic interactions between the metal and the ligand of opposite charge.
Acknowledgments
This research was sponsored by the “Commissariat à l'e´nergie atomique” (direction des Applications militaires) and the “Centre national de la recherche scientifique” (CNRS). M.M. was a 2004 recipient of an “Action concertée” Incitative “Jeunes chercheuses, jeunes chercheurs” awarded by the “Ministère délégué à l'enseignement supérieur et à la Recherche”. R.B. is also indebted to the “Conseil régional de Bourgogne” for granting a PhD fellowship.