

1 Introduction
Thorium phosphate–diphosphate (TPD), Th4(PO4)4P2O7 in ceramic form, appears as a very nice host matrix for the immobilisation of long-lived radionuclides needed in new ways of waste management 〚1–3〛. This ceramics is obtained from powder, synthesised either by evaporation 〚4〛 of a mixture of solutions containing the components (thorium nitrate or chloride and phosphoric acid) or from a precursor compound, the thorium phosphate–hydrogenphosphate (amorphous Th2(PO4)2HPO4·(3–7) H2O 〚5〛 or crystallised Th2(PO4)2HPO4·H2O) 〚6〛). Both methods lead to the TPD ceramics by pressing the powder at room temperature then heating at 1150–1250 °C 〚7〛. The main qualities of this material are: high resistance to water corrosion 〚3, 8, 9〛, thermal and chemical stabilities, high density 〚7〛.
As a host matrix for radwaste, the TPD can be used to:
- • incorporate tetravalent actinides; this leads to solid solutions with a maximum value in mol% of 75 of uranium, 52 of neptunium, 41 of plutonium; the system remains as a single phase and most of the pure TPD properties are held for these solid solutions 〚3, 10–12〛;
- • incorporate trivalent cations such lanthanides and some actinides (Am, Cm); this leads to TPD ‘doped’ crystal structure that can only accommodate small amounts of these ions, less than 0.5 mol% 〚11〛.
Larger amounts form in the matrix a second phosphate phase MPO4 (monazite or xenotime structure, depending on the cation). Zirconium, and probably other tetravalent cations of small radii, form also separated phases of Zr2O(PO4)2 and/or ZrP2O7 〚11〛.
The TPD can be also ‘loaded’ with other phosphates of mono- and divalent cations, whose solubility is as low as that of the TPD. The solids obtained are polyphase systems. Such solids were already prepared, using 23 cations simulating fission products: caesium, calcium, cadmium, strontium, barium, lanthanides, and zirconium (6–7 wt% of total amount of all cations) 〚13〛. In these very complex systems, it is difficult to determine the chemical composition of each phase; therefore, we chose to study some of them containing monovalent and divalent cations (as the behaviour of the trivalent and tetravalent ones was already studied) frequently present, in liquid radioactive waste.
Since the 1960s', the literature gives several series of metal–thorium phosphates of general formulae MITh2(PO4)3 (MI = alkali metals, Ag, Cu, Tl), MIITh(PO4)2 〚14–21〛, (MII = Ca, Cd, Sr, Pb) 〚22〛, (MII = Ca, Sr, Ba, Cd, Pb) 〚23〛 and (MII = Ba, Pb, Sr; JCPDS files: 33-180, 33-775, 33-1354) 〚24〛. All these phosphates were obtained from mixture of thorium dioxide ThO2, metal carbonate M2CO3 or metal oxide MO and ammonium dihydrogenphosphate NH4H2PO4 using dry chemistry methods.
These compounds can be also obtained by soft chemistry by a co-precipitation process at pH > 5 〚13〛 or by evaporation of acidic solutions of the constituents. The products obtained by these ways have the same characteristics, after heat treatment, as those synthesised using the dry chemistry process.
In order to obtain the metal–thorium phosphates, we applied the evaporation method of acidic solutions since the radioactive wastes are usually stored in 1–2 M nitric acid. Synthesis of such compounds as MITh2(PO4)3 (MI = Na, Cs) and MIITh(PO4)2 (MII = Ba, Ca, Cd, Sr) were attempted. Furthermore, in the liquid waste, several anions are often present. In order to check whether some anions form phosphate compounds of the ThmA(PO4)m type (m = 1, 2, 4), syntheses with anions A = F–, SO42–, SiO44–were performed by soft chemistry methods.
2 Experimental section
Thorium chloride 2 M solution was from Rhône-Poulenc (France). Other chemical reagents were supplied by Aldrich-Fluka. For hydrothermal syntheses, Parr Instrument Company autoclaves supported with poly-tetrafluoroethylene (PTFE) containers (maximum volume 23 ml) were used. Samples were heated at 150 °C in order to increase the kinetics of the reaction of synthesis. In these conditions, the vapour pressure cannot be controlled but, depending on the temperature, may rise up to 300 bar.
The X-ray powder diffraction (XRD) data were collected with a Philips PW 1050/70 diffractometer using the monochromatic Cu Kα radiation and a nickel filter. Patterns were recorded form 10 to 60° (2 θ), with a step of 0.01°, using silicon powder as internal reference.
The infrared (IR) spectra were recorded from 4000 cm–1 to 400 cm–1 with a Hitachi I-2001 spectrophotometer. Samples of 1–1.5 wt% of the solids were prepared in KBr pellets.
The heating treatment of the samples (with a rate of 5 °C min–1) was performed in alumina boats as well as in a Pyrox MDB15 furnace or in an ADAMEL FR20 one.
Electron probe microanalyses (EPMA) were carried out by means of a CAMECA SX 50 apparatus usually working with a 15 kV voltage and a 10 nA current beam. ThO2 (Mα ray of thorium) and KTi2(PO4)3 (Kα ray of phosphorous) were used as calibration references.
The elementary analysis was performed using the Particle Induced X-ray Emission (PIXE) method. The element amounts were calculated from the surface of the bands.
Samples preparation
The concentrated phosphoric acid 15 M was diluted to 5 M. Other solutions (hydrofluoric acid, sulphuric acid...) were prepared as 1 M solutions. Barium and caesium chloride solutions were prepared by dissolving the salts in de-ionised water. The exact concentrations of the solutions were determined by conventional analytical methods.
Samples of metal–thorium phosphates described above were synthesised by mixing the solutions in the needed molar ratios of the reagents (in all mixtures phosphoric acid was always taken with a 2% excess). The procedures applied for the synthesis are described below.
In order to synthesise the thorium fluoride phosphate a mixture of phosphoric and hydrofluoric acids was added to thorium chloride solution in the molar ratio Th4+:H3PO4:HF = 1:1:1, diluted to a volume of 5 ml, then put in an autoclave and heated at 150 °C in a thermostat oven during two months. The same kind of mixture was prepared using sulphuric acid (instead of hydrofluoric acid) with the molar ratio Th4+:H3PO4:H2SO4 = 2:2:1. After two months, the solids obtained from these syntheses were filtered, washed with de-ionised water, then dried at 120 °C and analysed.
In order to synthesise the thorium phosphate silicate, thorium chloride and phosphoric acid solutions were mixed with tetra-ethyl-ortho-silicate (C2H5O)4Si (TEOS) with 2 % of excess in the molar ratio Th4+:H3PO4:H4SiO4 = 4:4:1 in a PTFE closed container (to avoid the evaporation of the very volatile TEOS during the reaction). The gel formed from the thorium ion, phosphoric acid and hydrolysed TEOS was dried at 150 °C, heated first at 500 °C, then at 1100 °C for 12 h.
In order to synthesise the caesium–dithorium phosphate, a mixture of thorium and caesium chloride solutions with phosphoric acid in molar ratio Cs+:Th4+:H3PO4 = 1:2:3 was evaporated on a sand bath at 150 °C. The residue was ground, first heated at 500 °C to evaporate residual water and HCl, then at 1100 °C for 12 h. The same method was applied to the system including barium ion (Ba2+:Th4+:H3PO4 = 1:1:2).
3 Results and discussion
3.1 Thorium fluoride phosphate
From the mixture containing Th4+–H3PO4–HF components, a white crystallised powder was obtained. The PIXE and EPMA results and the molar ratios of this product are given in Table 1. As it can be seen from this table, the experimental results for thorium and phosphorous amounts are in good agreement with the expected ones. The fluoride content is lower that the calculated value. This is due to the EPMA method used, which never gives results with good accuracy for atoms of atomic number below 10. However, the global formula of the thorium fluoride phosphate may be proposed as ThFPO4·H2O. Its XRD diagram and powder diffraction data are presented, respectively, in Fig. 1a and Table 2. This diagram is similar to that of uranium (IV) fluoride phosphate UFPO4·H2O (JCDPS file 13-0047) 〚25〛. Beside the thorium fluoride phosphate formed, a minor phase with a molar ratio Th:F:O = 1:2:1 in the solid appears from the EPMA results. This ratio could correspond to the thorium oxide fluoride ThOF2. Nevertheless, in the XRD diagram of this phase, no lines could be assigned, neither to the orthorhombic form (JCPDS 12-0096) nor to the hexagonal one (JCPDS 39-0620) of the ThOF2.
Results of elementary analysis of the synthesised compounds.
| Elements | Weight % | Molar ratios | ||||
| experimental | EPMA | PIXE | ||||
| EPMA | PIXE | calculated | ||||
| a | Th | 65.9 ± 3.0 | 63.6 ± 0.9 | 63.74 | — | — |
| P | 8.68 ± 0.35 | 8.4 ± 0.5 | 8.51 | |||
| F | 4.26 ± 0.71 | — | 5.25 | — | ||
| b | Th | — | 59.3 ± 0.5 | 58.89 | — | — |
| P | — | 7.7 ± 0.3 | 7.86 | — | ||
| S | — | 4.2 ± 0.3 | 4.07 | — | ||
| c | Th | 65.7 ± 2.16 | 65.5 ± 0.5 | 66.29 | — | — |
| P | 9.24 ± 0.84 | 9.0 ± 0.2 | 8.85 | |||
| Si | 1.87 ± 0.59 | 2.0 ± 0.9 | 2.01 | |||
| d | Th | 52.0 ± 2.5 | — | 52.62 | — | — |
| P | 10.18 ± 0.61 | — | 10.54 | — | ||
| Cs | 15.21 ± 0.42 | — | 15.07 | — | ||
| e | Th | 40.2 ± 0.8 | — | 41.50 | — | — |
| P | 10.77 ± 0.56 | — | 11.08 | — | ||
| Ba | 26.52 ± 0.52 | — | 24.52 | — |
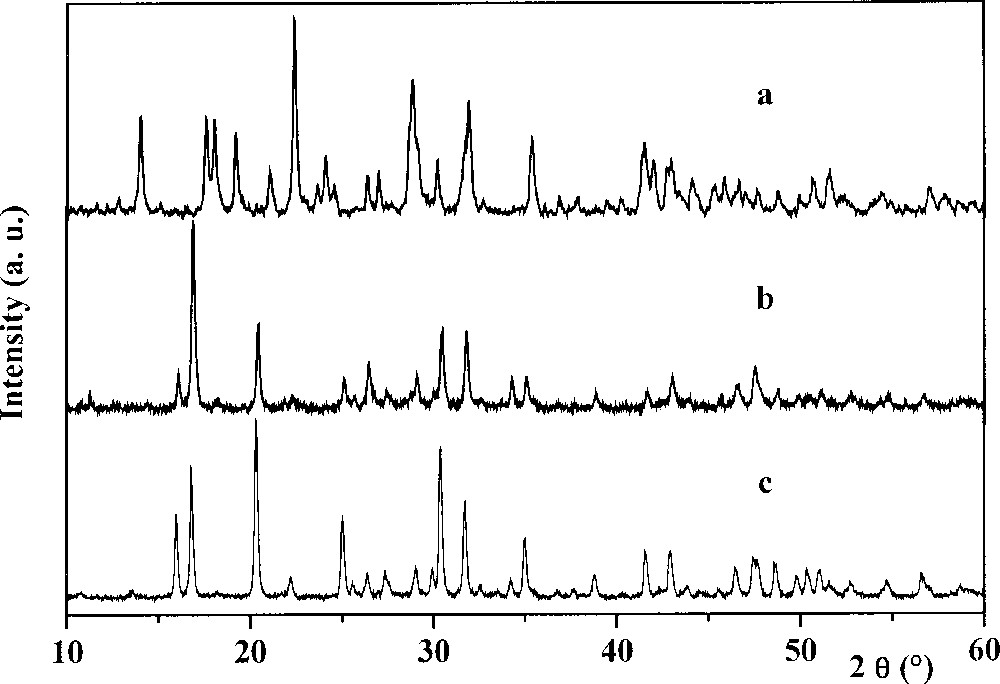
XR powder diffraction diagrams of the thorium fluoride phosphate (a), of the thorium silicate phosphate (b) and of the thorium phosphate–diphosphate (c).
Main lines of XRD powder data of the synthesised thorium phosphates.
| ThFPO4·H2O | Th4(PO4)4SiO4 | CsTh2(PO4)3 | BaTh(PO4)2 | ||||
| 2 θexp (°) | I/I0 | 2 θexp (°) | I/I0 | 2 θexp (°) | I/I0 | 2 θexp (°) | I/I0 |
| 12.85 | 9 | 10.76 | 3 | 13.63 | 20 | 14.17 | 100 |
| 14.01 | 51 | 11.26 | 10 | 16.15 | 4 | 15.97 | 6 |
| 15.12 | 7 | 14.31 | 3 | 16.90 | 22 | 17.06 | 4 |
| 17.59 | 49 | 16.09 | 19 | 18.29 | 39 | 17.80 | 11 |
| 18.05 | 49 | 16.89 | 100 | 19.86 | 79 | 19.46 | 6 |
| 19.20 | 42 | 18.20 | 4 | 20.43 | 13 | 20.93 | 51 |
| 21.08 | 22 | 20.42 | 45 | 22.30 | 8 | 20.33 | 24 |
| 22.39 | 100 | 22.35 | 6 | 25.23 | 30 | 23.89 | 7 |
| 24.01 | 20 | 25.10 | 15 | 25.52 | 18 | 25.15 | 6 |
| 24.10 | 30 | 25.65 | 7 | 26.67 | 78 | 26.28 | 48 |
| 24.56 | 15 | 26.44 | 25 | 27.28 | 25 | 27.05 | 84 |
| 26.40 | 19 | 27.44 | 9 | 28.87 | 100 | 28.54 | 51 |
| 26.98 | 22 | 29.08 | 17 | 30.72 | 50 | 30.52 | 9 |
| 28.84 | 69 | 30.03 | 9 | 31.84 | 6 | 32.85 | 48 |
| 30.20 | 28 | 30.47 | 41 | 32.55 | 21 | 34.34 | 4 |
| 31.88 | 57 | 31.78 | 41 | 33.63 | 7 | 36.56 | 4 |
| 35.36 | 37 | 32.41 | 4 | 35.41 | 5 | 38.15 | 5 |
| 36.86 | 9 | 34.28 | 16 | 37.27 | 8 | 39.09 | 7 |
| 37.83 | 9 | 35.05 | 16 | 38.30 | 6 | 39.64 | 14 |
| 40.20 | 8 | 36.81 | 2 | 40.28 | 27 | 42.73 | 29 |
| 41.48 | 37 | 37.70 | 2 | 41.11 | 26 | 43.45 | 20 |
| 41.95 | 28 | 38.97 | 7 | 42.27 | 17 | 43.70 | 21 |
| 42.93 | 29 | 41.71 | 8 | 42.68 | 10 | 44.80 | 17 |
| 43.39 | 12 | 43.04 | 16 | 44.24 | 8 | 47.81 | 3 |
| 44.13 | 16 | 43.93 | 3 | 45.67 | 6 | 49.28 | 3 |
| 45.31 | 14 | 45.67 | 5 | 45.95 | 8 | 49.77 | 4 |
| 45.83 | 18 | 46.52 | 12 | 46.60 | 18 | 51.09 | 3 |
| 46.63 | 19 | 47.56 | 20 | 46.93 | 18 | 51.90 | 8 |
| 46.96 | 12 | 48.78 | 8 | 47.55 | 4 | 52.81 | 8 |
| 47.02 | 10 | 49.90 | 5 | 48.52 | 28 | 52.88 | 8 |
| 47.62 | 11 | 50.41 | 5 | 49.86 | 10 | 54.26 | 10 |
| 49.92 | 10 | 50.47 | 5 | 51.27 | 5 | 55.60 | 8 |
| 50.63 | 19 | 51.09 | 8 | 52.31 | 20 | 55.71 | 8 |
| 51.60 | 23 | 51.75 | 4 | 53.50 | 12 | 57.25 | 5 |
| 52.42 | 10 | 52.78 | 7 | 53.68 | 9 | 58.66 | 4 |
| 54.04 | 7 | 54.82 | 6 | 54.41 | 9 | 59.21 | 7 |
| 54.41 | 10 | 56.66 | 6 | 55.07 | 6 | ||
| 56.99 | 14 | 58.96 | 3 | 57.12 | 10 | ||
| 57.92 | 10 | 59.77 | 8 |
In the IR spectrum in Fig. 2a, the bands can be assigned to the stretching and deformation modes of the P–O bond (1140–400 cm–1), to the stretching of O–H bond (3600–3400 cm–1) and the bending mode (1610 cm–1) of the water molecule 〚26–28〛. These results are consistent with the hydrated formula of the synthesised compound. On the other hand, it is impossible to define the frequencies of Th–F bond, since the space group of the thorium fluoride phosphate is unknown. Furthermore, it cannot be compared to that of UFPO4·H2O, because its structure is also unknown.
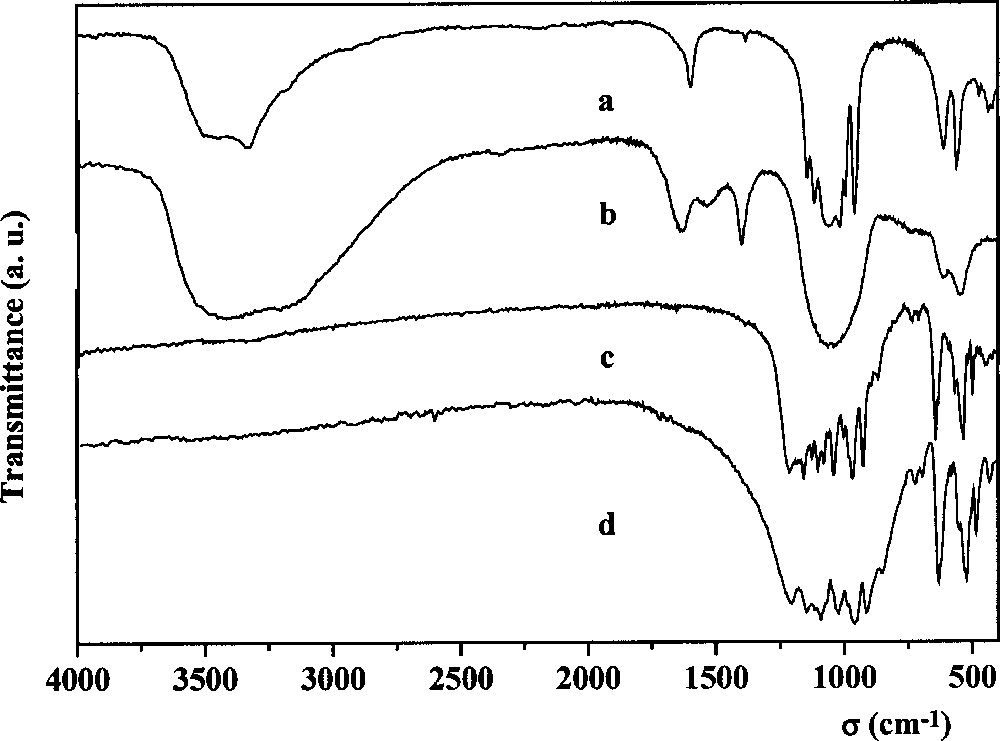
IR spectra of the thorium fluoride phosphate (a), of the thorium sulphate phosphate (b), of the thorium silicate phosphate (c) and of the thorium phosphate–diphosphate (d).
When heated at 650–700 °C, the ThFPO4·H2O is transformed into dithorium oxide phosphate Th2O(PO4)2 〚6〛. This conversion let us presume that the first stage is a hydrolysis reaction (equation (1)) leading to the formation of thorium hydroxide phosphate, followed by a condensation process (equation (2)):
| 1 |
| 2 |
3.2 Thorium sulphate phosphate
From the mixture Th4+–H3PO4–H2SO4, a white amorphous powder was obtained. The results of the PIXE analysis of this powder (Table 1) suggest the following global formula for the thorium phosphate sulphate: Th2(PO4)2SO4·2 H2O (the water content is calculated by difference). In the IR spectrum (Fig. 2b) the frequencies of the O–H bond and H2O bending mode are observed. The large bands between 1200 cm–1 and 400 cm–1, characteristic for amorphous thorium phosphates 〚5〛, include also the S–O and O–S–O vibrations of the SO4 tetrahedron 〚26〛. On the other hand, the S–O stretching frequencies may also spread up to 1500 cm–1 〚26〛. In Fig. 2b, two bands appear, at 1530 and 1402 cm–1. Heated at 450–500 °C, the product is decomposed, with occurrence of sulphuric acid. At higher temperatures (950–1100 °C), the remaining solid presents a XRD diagram corresponding to TPD with some rays of ThO2.
3.3 Thorium silicate phosphate
From the dried gel containing the Th4+–H3PO4–H4SiO4 mixture, a well-crystallised powder was obtained upon heating at 1100–1150 °C, after a step at 450–500 °C. From the analysis results, the molar ratios of the elements are in good agreement with the calculated ones (Table 1), corresponding to the expected general formula Th4(PO4)4SiO4. Its XRD diagram (Fig. 1b) is similar to that of the thorium phosphate–diphosphate Th4(PO4)4P2O7 〚4〛 (Fig. 1c) but with different intensities of the lines. The powder diffraction data are reported in Table 2. Similarities are also observed in the IR spectra of both compounds (Fig. 2c and d). The stretching modes ν1 (750–800 cm–1) and ν3 (800–1000 cm–1), as well as the deformation modes ν4 (450–600 cm–1) of the Si–O bond in the SiO4 tetrahedron 〚29〛 overlap with those of O–P–O ones (1200–400 cm–1) 〚27〛.
3.4 Caesium dithorium phosphate and barium thorium phosphate
In the system Cs+–Th4+–H3PO4, after evaporation of the volatile products and then after heating at 1100 °C, a well-crystallised residue was obtained. As it was shown from the EPMA results, the solid appears as single-phased. The elementary weight percent and molar ratio of the elements are presented in Table 1. This compound, caesium–dithorium phosphate, CsTh2(PO4)3 was obtained by Matković et al. 〚19〛 using the dry chemistry method, and crystallises in the monoclinic system (symmetry group C62h, Z = 4) with the following unit cell parameters: a = 1.773 nm, b = 0.688 nm, c = 0.817 nm, β = 102°06’ and the density d = 5.91. Neither XRD diagram nor powder diffraction data were published by the above-mentioned authors. They are shown in Fig. 3a and listed in Table 2. The same kind of diagram was obtained by heating caesium carbonate with thorium dioxide and ammonium dihydrogenphosphate 〚30〛.

XR powder diffraction diagrams of the caesium–dithorium phosphate (a) and of the barium–thorium phosphate (b).
The product obtained from the mixture Ba2+–Th4+–H3PO4 is also single-phased. The molar ratio obtained for the analysed samples is in good agreement with the expected one (Table 1). Thus, the proposed formula of this barium–thorium phosphate can be written as BaTh(PO4)2. The XRD diagram, presented in Fig. 3b, is different from those of the monoclinic compounds MIITh(PO4)2 (MII = Ca, Cd, Pb, Sr) brabantite type and of the cubic Ba7Th(PO4)6. The systems M2+–Th4+–H3PO4 (M2+ = Ca, Cd, Sr) were also tested in the same conditions as the barium–thorium phosphate system, i.e. with the soft chemistry method. Their XRD powder diagrams are consistent with those of Schwarz 〚22〛.
4 Conclusions
Using hydrothermal conditions, a partially crystallised compound, thorium fluoride phosphate ThFPO4·H2O was synthesised. This compound is unstable at 650–700 °C and is transformed into the dithorium oxide phosphate, the volatile products being hydrogen fluoride and water.
The amorphous product supposed to be thorium sulphate phosphate Th2(PO4)2SO4·2 H2O is also unstable, even at 450–500 °C.
Thorium silicate phosphate, Th4(PO4)4SiO4, caesium–dithorium phosphate CsTh2(PO4)3 and barium-thorium phosphate, BaTh(PO4)2 were obtained as well crystallised single phases, after evaporation of the initial mixture of the appropriate solutions, followed by heating at high temperatures (1100–1150 °C). From the XRD diagram, the first one resembles the TPD, and the second is consistent with that synthesised by other authors. The third compound seems to be different from the monoclinic MII–thorium phosphates (MII = Ca, Cd, Sr, Pb) as well as from the cubic Ba7Th(PO4)6.
It is interesting to compare the crystallographic systems of metal(II)–thorium phosphates in terms of ionic radii of the mentioned divalent cations (Table 3). Cations whose radii, in eight-fold coordination 〚31〛 (this coordination number was chosen because it is common to all cations below), spread from 0.110 to 0.129 nm (Cd2+, Ca2+, Sr2+, Pb2+) have MIITh(PO4)2 as chemical formula and form a monoclinic lattice. The lead–thorium and strontium–thorium phosphates are polymorphous. The Sr2+ and Pb2+ cations with the radii 0.126 and 0.129 nm respectively form also, like Ba2+ (0.142 nm), a cubic lattice of the type. The following question is still open: which is the crystallographic system of the barium–thorium phosphate BaTh(PO4)2?
Comparison of crystallographic systems of some cation (II)-thorium phosphates versus the cationic radii of M(II).
| Cation | Radius 〚8〛r (nm) | Compound | System | References |
| Cd2+ | 0.110 | CdTh(PO4)2 | monoclinic | 〚22〛 |
| Ca2+ | 0.112 | CaTh(PO4)2 | monoclinic | 〚22〛 |
| Hg2+ | 0.114 | ‘HgTh(PO4)2’ | ? | — |
| Sr2+ | 0.126 | SrTh(PO4)2 | monoclinic | 〚22〛 |
| Sr7Th(PO4)6 | cubic | JCPDS 33-1354 | ||
| Pb2+ | 0.129 | PbTh(PO4)2 | monoclinic | 〚22〛 |
| Pb7Th(PO4)6 | cubic | 24, JCPDS 33-775 | ||
| Ba2+ | 0.142 | BaTh(PO4)2 | ? | — |
| Ba7Th(PO4)6 | cubic | JCPDS 33-180 | ||
| Ra2+ | 0.148 | ‘RaTh(PO4)2’ | ? | — |
In the series of MII–thorium phosphates, two of them are missing, the mercury–thorium and the radium–thorium phosphates. No information about these compounds was found in the literature. Taking into account the mercury ionic radius 〚8〛r = 0.114 nm 〚31〛 the supposed ‘HgTh(PO4)2’ system should have a monoclinic lattice, while the ‘RaTh(PO4)2’ system (〚8〛r = 0.148 nm 〚31〛) should be similar to the BaTh(PO4)2 one.
With regard to thorium phosphate–diphosphate, it appears from the present results that monovalent and divalent cations such as Cs+, Ba2+, Ca2+, Cd2+, Sr2+ loaded into the TDP will form a polyphased system: TPD–CsTh2(PO4)3–MIITh(PO4)2. In the presence of minute amounts of anions such as silicate (or fluoride and sulphate), separate phases will also be present in the resulting solid during its synthesis. These experiments, as well as previous ones 〚11〛, show that the TPD can be a host matrix not only for tetravalent actinides 〚10–12〛 but also for other radionuclides, like fission products 〚13〛. The resistance to water corrosion of these systems is under investigation.
Acknowledgements
The authors would like to thank R. Podor from the University of Nancy (France) for the EPMA analyses and to G. Lagarde from the ‘Institut de Physique Nucléaire’ (Orsay, France) for the PIXE analyses.