

1 Introduction
The high-temperature properties of glass melts are of interest from both a scientific and a technological point of view. This contribution is focused on the high-temperature characterisation of silicate glass melts by spectral-optical and electrochemical methods. The experimental methods are described and some typical results for silicate glass melts are presented.
The measured melt properties include:
- • high-temperature optical absorption spectra, influenced by the presence of absorbing ions from transition metals like Fe and Cr and by OH groups in the glass melt;
- • the electrochemical oxidation state or redox state of a glass melt, characterised by the equilibrium partial pressure of oxygen, dissolved in the melt (pO2).
Compositional and structural effects on the above-mentioned glass melt properties are discussed.
Besides, the technological importance of these properties for industrial glass manufacturing is illustrated. Here, the attention is focused, respectively:
- • on the impact of the high-temperature spectral properties on the radiative heat transfer in the semi-transparent glass melts;
- • on the potential use of glass melt redox sensors for control of glass quality/colour.
2 Spectral optical properties of silicate glass melts
2.1 Experimental
The first efforts to determine the spectral absorption of glass at melting temperatures were made by Von Genzel and Neuroth in the late 1950s 〚1, 2〛. Later efforts by other researchers are reported in 〚3–11〛.
From a survey of these publications, it was concluded that systematic errors in the high-temperature spectral measurements can be significantly reduced by absorption measurements at different optical path lengths through the glass melt. The spectral extinction coefficient is calculated from the ratio between different absorption measurements (‘differential optical path method’), as explained in the following.
Recently, a unique high-temperature set-up for measurement of the spectral absorption of glass melts was developed at the TNO Institute of Applied Physics; it is described in 〚12〛.
A Perkin Elmer Spectrum 2000 Fourier Transform Infrared Spectrometer (FTS) is used for the actual optical measurements in the relevant spectral range 0.9–4 μm.
The variable optical path sample holder is shown in Fig. 1. The sample holder consists of a 150 mm × ∅ 85 mm alumina crucible with a ∅ 25 mm sapphire window mounted in the centre of the bottom. An alumina tube having a sapphire window at the end is immersed into the glass melt, creating a controllable measurement volume (glass melt thickness).
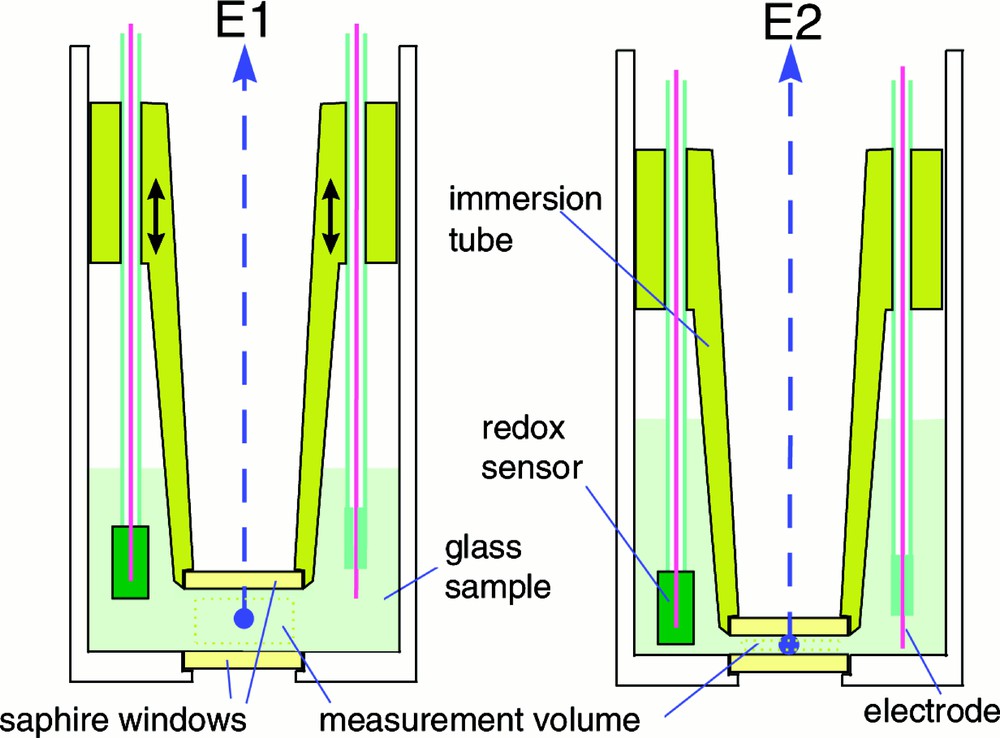
High-temperature sample holder with variable optical path length.
The weight of the glass sample is typically in the range 0.1–0.5 kg. The main reason for using such a large sample is that it will be easier to stabilise and control the oxidation or redox state of the melt and the content of volatile components like water, as compared to a small sample. Furthermore, by using the immersion tube, the part of the glass of which the optical properties are measured (the measurement volume in Fig. 1) is kept far away from the part of the melt that is in contact with the atmosphere. The redox state of the melt can be monitored by an oxygen sensor (see next section on redox properties of melts).
The sample holder can be applied for measurements in either the transmission or emission mode. For transmission spectroscopy, an external light source is used and the measurements are corrected for the sample self-radiation. In case of emission spectroscopy, only the sample self-radiation is measured.
In the high-temperature range (> 900 °C for common silicate glasses), for which the glass has a sufficient low viscosity, measurements are performed for different optical path lengths. The ratio of the measured spectra is used to calculate the spectral absorption. The exact distance between the two sapphire windows is difficult to determine, but a variation in the distance between the windows can be set accurately (better than 0.02 mm). Another advantage of this ratio method is that the effect of deterioration of the sapphire–glass melt interface, by e.g. crystallisation effects at the interface, is practically eliminated.
When the transmitted radiation T through the melt is recorded at different melt depths d, the spectral extinction coefficient K(λ) is calculated from the ratio between two transmittance spectra, recorded at different glass melt depths, using as a first estimate the formula:
2.2 Exemplary results
The above measurement method has been used to measure the spectral melt properties of a large number of industrially produced silicate glasses, including:
- • flint, green, amber and olive green soda lime glasses for containers;
- • soda lime float glass;
- • borosilicate glass for textile glass fibres (E-glass);
- • Ba- and Sr-containing silicate glass, used for TV screens;
- • lead crystal glass.
In Fig. 2, the absorption spectra of a typical TV-screen glass composition, recorded at 1100, 1200, 1300 and 1400 °C, respectively, are compared to the absorption spectrum at room temperature (21 °C). The maximum total error on the high-temperature absorption data is estimated to be 5%.

Spectral absorption of TV screen glass at room temperature and at melting temperatures.
2.3 Review of observed high-temperature spectral features
In general, the observed features in the high-temperature glass melt spectra can be ascribed to a combination of absorptions due to:
- • electronic excitations in the glass matrix in the short wavelength region (< 1 μm), generally intensifying with temperature;
- • absorbing species in the glass, especially colouring ions like Fe and Cr, and OH groups in the intermediate wavelength region (1–4 μm);
- • vibrational bands of the glass matrix for the long wavelength region (> 4 μm).
An interesting feature in the high-temperature spectra of Fig. 2, also observed for other silicate glasses, is the behaviour of the water-related absorption bands around 2.8 and 3.5 μm: the absorption around 2.8 μm, ascribed to ‘free’ OH (hydroxyl) groups, is stronger in the melt than in the solid state, but gradually decreases with temperature, when going from 1100 to 1400 °C. The absorption band around 3.5 μm, ascribed to stretching vibrations of water molecules and pronouncedly visible in the solid state, is considerably diminished at melting temperatures. A detailed analysis of these high-temperature spectral effects in terms of oscillator frequencies and oscillator strengths of the different optical transitions is given in 〚13〛.
By this kind of analysis, information can be obtained about structure (e.g., about different hydroxyl sites) and redox chemistry of the glass melt at high temperatures.
The following specific observations, derived from a review of the high-temperature spectra of all the above-mentioned silicate glass types, are of practical interest for studying the heat transfer in industrial glass melts, as will be explained below. A distinction is made between glasses/melts with relatively high and relatively low iron contents.
2.3.1 Spectra of glass melts with relatively high iron content (Fe2O3 > 0.05 wt%)
For coloured container glasses (green, olive green and amber), float glass and borosilicate glass, the absorption band of Fe2+ around 1.0–1.1 μm and the free OH-absorption band around 2.8 μm dominate the spectra between 0.5 and 4 μm.
In general, the absorption strength of the Fe2+ band in these glasses decreases with temperature.
Green glass, containing both Fe and Cr ions, shows a deviating behaviour at high temperatures. For this glass the absorption around 1.0–1.1 μm increases with temperature. This phenomenon is not fully understood, but it may be caused by redox reactions between Fe and Cr ions in the melt, resulting in the occurrence of charge transfer bands, which shift into the near infrared at melting temperatures.
2.3.2 Spectra of low-iron-content glass melts (< 0.05 wt% Fe2O3)
For low iron contents, oxidised glasses, especially flint container, TV-screen and lead crystal glasses, the Fe2+ absorption band around 1.0–1.1 μm is virtually absent at high temperatures and only the free OH band remains clearly visible in the high-temperature spectra.
The high-temperature absorption of flint glass and TV-glass types between 0.5 and 2.5 μm is low (K typically varies between 0.04 and 0.4 cm–1) and the spectral absorption of these two glass types in this wavelength region has only slight temperature dependence (Fig. 2).
Lead crystal glass melts show a peculiar behaviour in the spectral region between 0.5 and 2.5 μm: the absorption increases about a factor 10 over this spectral region, when heating the glass from 1100 to 1400 °C. Apparently, the specific network structure of lead silicate glass melts results in an intensification of the electronic transitions of the matrix at elevated temperatures.
2.4 Rosseland radiation conductivity
The main heat transfer mechanism in semi-transparent industrial glass melts is thermal radiation in the spectral region 1–4 μm. Therefore, detailed knowledge of the spectral optical properties of glass melts is essential in order to understand, to model and to optimise the heat transfer and melting processes in industrial glass tanks.
For comparing the radiative heat transfer characteristics in different glass types, it is useful to define a so-called photon or radiation conductivity.
For this, usually the Rosseland or diffusion approximation is used. In this approach, it is assumed that the glass melt system is optically thick for heat radiation. This implies that the mean free path of the photons, lm (m), is small compared to the thickness d (m) of the glass melt system, where the mean free path of the photons is defined as the reciprocal value of the absorption coefficient K (m–1).
Thus, it is assumed that:
The validity of the Rosseland approximation for the different silicate glasses under study is illustrated in Table 1.
Typical values for mean free path of photons lm (cm) in silicate glasses at melting temperatures (1200–1400 °C) in the most transparent spectral region between 1 and 2.5 μm (derived from high temperature spectra).
| Glass type | 1m (cm) |
| ‘Low iron’ glasses: | |
| Clear flint container | 20 |
| Lead crystal | 7 |
| TV screen | 5 |
| ‘High iron’ glasses | |
| Float | 4 |
| Borosilicate E-fiber | 1.5 |
| Olive green | 1 |
| Emerald green | 1 |
| Amber | 0.7 |
From Table 1 it is concluded that the Rosseland diffusion approximation can be applied in practically all cases for modelling industrial glass melting tanks, where the glass bath depth is of the order of 100 cm.
However, for modelling radiative heat transfer in the forehearth (typical depth 10–30 cm) of a glass furnace producing low iron content glass (e.g., flint container glass), the Rosseland approximation is no longer valid, since the condition lm << forehearth depth, is not satisfied.
Furthermore, it is clear that the Rosseland diffusion approximation cannot be used for modelling heat transfer during glass forming processes, in which the typical glass wall thickness varies from 0.1 cm (for thin-wall containers) up to a few centimetres (for TV screens).
Other radiation models, like ray tracing and discrete transfer models, must be used for describing radiative heat transfer in such glass melt systems.
The Rosseland radiation conductivity kr(T) is calculated from the high-temperature spectra by numerically solving the following formula, with integration over the spectral region, in which the glass melt is semitransparent, from about 0.5 up to 4 μm 〚12, 14, 15〛:
The calculated photon conductivity of the three ‘low-iron’-content glasses (TV screen, lead crystal and flint container glass) is plotted as a function of temperature in Fig. 3.
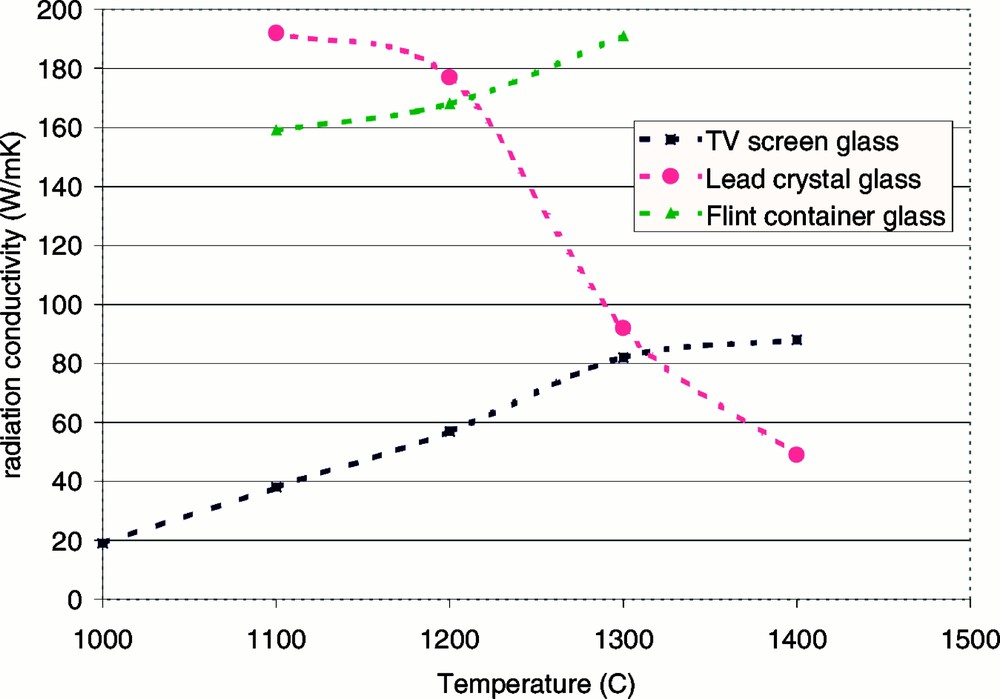
Rosseland photon conductivity for different oxidised glasses (with less than 0.05 wt% Fe2O3) as a function of temperature.
It can be seen in Fig. 3 that at temperatures below 1200 °C, the lead crystal glass has the highest radiation conductivity of the three low-iron-content glasses, whereas at temperatures higher than 1300 °C, the lead crystal glass has the lowest photon conductivity. The pronounced decrease of radiation conductivity with temperature for the lead crystal glass is caused by a strong increase in optical absorption with temperature, as mentioned above.
2.5 Effect of redox state on radiative heat transfer in glass melts
As outlined above, the optical absorption by Fe2+ ions has a large impact on the radiative heat transfer in industrial silicate glass melts. Since the Fe2+ content is determined by the redox state of the glass (see next section), the redox state has a major effect on the photon conductivity at melting temperatures. This effect is illustrated in Fig. 4, which shows the spectral absorption at 1200 °C of two float glasses with a similar chemical composition (total iron oxide content = 0.08 wt%), but with different redox states: The ‘reduced’ float glass has an iron redox ratio Fe2+/Fetot = 0.28 and the more ‘oxidised’ float glass has an iron redox ratio of 0.24 (room temperature ratio’s). Due to this redox difference, the absorption of the reduced float glass in the spectral region 1–2.5 μm is higher than the corresponding absorption spectrum of the oxidised float glass, as can be seen in Fig. 4.
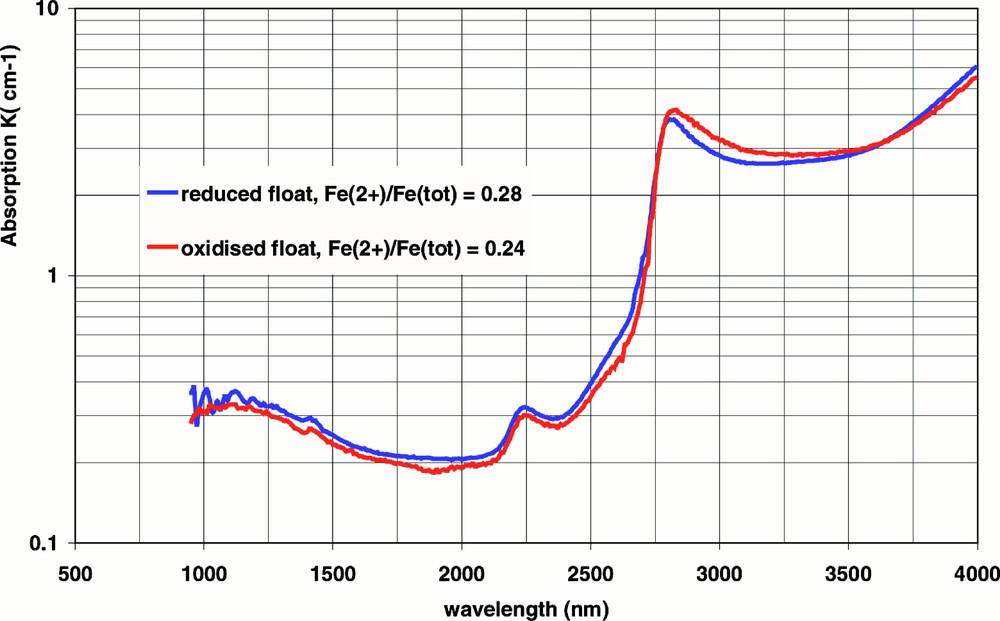
Absorption spectra at 1200 °C of two float glasses with different redox states.
Using the spectra of Fig.4, the radiation conductivity at 1200 °C was calculated to be 56 W mK–1 for the reduced float glass and 73 W mK–1 for the oxidised float glass.
So, a relatively small redox difference between two float glasses will have a large impact on the radiative heat penetration, when these glasses are melted in an industrial tank.
3 Redox properties of glass melts
3.1 Experimental
The oxidation state or redox of a glass melt can be defined as the equilibrium state of all oxidising and reducing components (especially the multivalent ions Fe2+, Fe3+, S2–, SO42–, Sb3+, Sb5+, etc.) in the glass at a certain temperature. The redox state of a glass melt is best characterised by the partial oxygen pressure or pO2 of the melt. The pO2 in a glass melt is measured with an oxygen sensor, developed by TNO TPD in co-operation with a sensor supplier 〚16, 17〛, and depicted in Fig. 5.

Scheme of oxygen sensor for glass melts.
This oxygen sensor consists of two electrodes: an inert iridium wire, sealed in fused silica (measuring electrode), and a reference cell, with a metal/metal oxide (e.g., Ni/NiO or Mo/MoO2) reference mixture. This reference mixture is physically and chemically separated from the glass melt by a partially stabilised zirconia tube, which acts as a solid electrolyte, conducting only oxygen ions. The oxygen activity aO2 (= pO2 assuming ideal gas behaviour at high temperature) of the reference mixture has a fixed and known value at a certain temperature.
When the sensor is dipped in a glass melt, the EMF (electro motive force) between the two electrodes is measured. This EMF value is directly related to the ratio of the pO2 in the melt and the known pO2 at the reference electrode, by the Nernst law:
Thus, by measuring the EMF and the temperature of the melt, the pO2 of the glass melt can be determined.
3.2 Exemplary results: correlation between melt redox state and glass colour
The redox state of industrial glass melts is a key property, affecting many glass melt parameters and product properties, including glass colour, radiative heat transfer and fining behaviour of the melt, and cooling rate of the melt during forming 〚18〛.
The effect of the redox state on the radiative heat transfer in glass melts has already been demonstrated by the above example of the two float glass types.
The correlation between the redox state of a silicate glass melt and the glass colour at room temperature is illustrated in Fig. 6.

Partial oxygen pressure as a function of temperature in silicate glasses of varying oxidation states and colours.
This figure shows the measured pO2 as a function of temperature, of four soda-lime silicate glass melts with similar chemical composition, but different colours. In this figure, the measured iron redox ratio (= Fe2+/Fetot) in the four samples, after cooling to room temperature, is indicated as well. The colour of these glasses, which all contain about 0.2 wt% Cr2O3 and 0.3 wt% Fe2O3, is determined by a combined effect of the colouring ions of Cr and Fe: Cr3+ ions in glass cause a green colour. When the glass becomes more reduced, i.e. when the Fe2+/Fetot redox ratio of the glass at room temperature increases and exceeds a value of about 0.4–0.5, the Fe3+–S2– amber chromophore is formed 〚19〛, which also influences the colour, resulting in a brownish-green (olive green) colour.
It is concluded from Fig. 6 that measurement of the pO2 at melting temperatures gives a good prediction of the Fe2+/Fetot ratio and glass colour at room temperature.
Therefore, the application of an oxygen sensor in continuous industrial glass melting tanks is of great practical interest. By continuously measuring the pO2 in the feeder channel (i.e. channel between melting tank and forming machines) with help of an in-line oxygen sensor, glass colour and glass colour changes can be monitored and controlled.
In Fig. 7, the EMF signal of an in-line oxygen sensor, installed in the feeder of a green container glass furnace at a constant temperature of about 1200 °C, is compared to the Fe2+/Fetot ratio of the produced glass during a period of three weeks. At a constant temperature, this EMF-signal is a direct measure of the redox state (pO2) of the glass melt. Since there is only a small time delay (< 1 hour) between glass flowing in the feeder channel and the forming and cooling process of the glass, the EMF signal and the iron redox ratio of the produced glass are directly correlated. Indeed, it can be seen in Fig. 7 that both curves show a similar trend. This confirms the practical use of oxygen sensors in industrial glass melting.
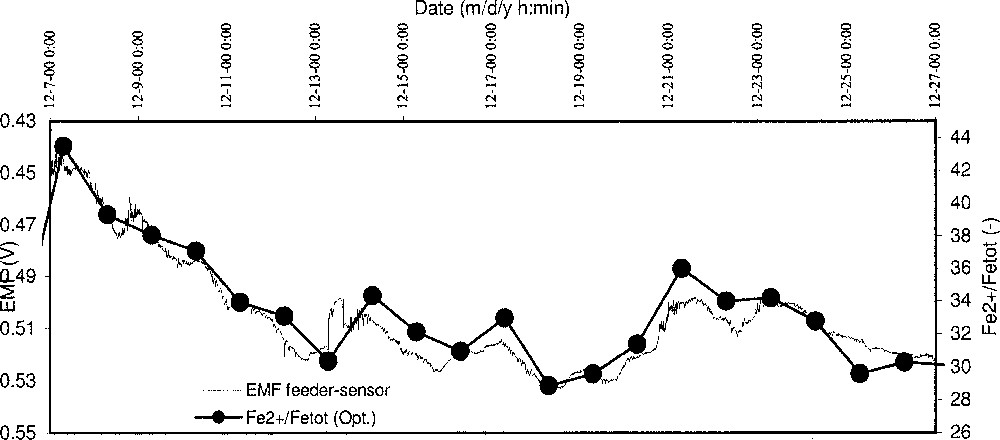
Correlation between the EMF signal of an in-line oxygen sensor in the feeder channel of a glass furnace and the iron redox ratio in the produced glass items during a period of three weeks.
Current technical developments focus on integration of the in-line sensor in advanced furnace control systems.
4 Concluding remarks
In view of technological improvements in industrial glass melting, a better understanding of the high temperature melt properties by advanced characterisation methods is required. In this paper the use of high temperature spectroscopy and electrochemical principles for characterisation of the spectral absorption and the oxidation state of glass melts is illustrated. It is shown that the high temperature spectral absorption and the partial oxygen pressure of glass melts have a major influence on the radiative heat transfer in glass melts and on glass colour, respectively.