

1 Introduction
The reduction in the OH–1 loss at 1340 nm in the standard silica fibres has resulted in the enhancement in the spectral transparency. By considering the 0.5 dB km–1 as the reference line, it is evident that the available window for long-haul, metro, and local area networks (LAN) is between 1280 to 1650 nm, across which the total attenuation is less than 0.5 dB km–1. The new silica fibres have therefore the enhanced capability to amplify signal simultaneously in the above wavelength region. However, recent developments in the wavelength division multiplexing (WDM) technology have mainly focussed on developing broadband amplifiers for the S- (1480–1520 nm), C- (1527–1563 nm) and L- (1570–1610 nm) bands both the RE-doped ion fibres and Raman fibres 〚1–6〛. The latter is based on undoped silica fibres with higher core refractive index than the standard silica single-mode and requires more than 10 km of fibres in length, depending on the index contrast and fibre non-linearity. Raman and RE-doped amplifiers have been employed together in the laboratory system demonstration to achieve gain-flatness across the 1480- and 1630-nm regions 〚7, 8〛. Although the silica-based technology have been developed for the S-, C-, and L-band amplifiers using a combination of Raman and RE-doped devices, the costs of such systems is a major limitation for their widespread use in the networks.
It is also important to note that as the data-transmission speed increases from 10 to 40 Gbit s–1, the dispersion penalty limits the transmission, and the system and sub-system costs increase further by incorporating more components for dispersion compensation, pulse reshaping, and retiming the signal. By considering the dispersion and fibre non-linearity, and the gain spectra of Er-doped fibre amplifiers (EDFA) and Raman amplifiers, the overall gain excursion before filtering is larger than 5 dB, which further limits the capabilities of Raman and RE-amplifiers without any gain-flattening device in the wavelength-division-multiplexing (WDM) networks. The need for gain-flattening filters, dispersion compensators, and pulse regenerators in the networks significantly add to the overall cost of a system. In particular, for the metropolitan area, the cost is quite important, as the network is likely to expand from a 2.5- to a 10-Gbit s–1 system, which is a significant leap in terms of transmission capacity. All future systems, therefore, must reduce the costs of installation and maintenance, which is where the novel non-silica based fibres and planar light-wave circuits may prove advantageous in driving down the unit cost of a system by reducing the size of the device for achieving comparable functions in the future systems. Erbium-doped waveguide amplifiers (EDWA) is the latest example of success for reducing the size of an amplifier device 〚9〛, for which the demand is expected to grow in the future for metropolitan and local area networks.
Tellurite-based Er3+-doped fibre amplifier (EDFA) was demonstrated by the Nippon Telephone and Telegraph (NTT) Optoelectronics Laboratories, in which they showed a gain-flattened amplification of 20 dB across a spectrum of 80 nm between 1530 and 1610 nm 〚4〛. Subsequently, the NTT group also combined a Tm3+-doped fluoride fibre device with an Er3+-doped device and demonstrated a parallel-type amplifier with a flat amplification bandwidth of 113 nm 〚5〛. A combined S-, C-, and L-band amplifier device comprising Er3+- and Tm3+-doped tellurite fibres may produce a continuous gain band extending from around 1400 to around 1610 nm 〚10〛. A Nd3+-doped amplifier operating around 1.34 μm is clearly desirable, since it would help bridging a wavelength gap in the 1340 and 1400 regions.
Recently tellurite glass has attracted an increasing interest in optical fibre lasers and amplifiers application. The glass has a reasonably wide transmission region (0.38–5 μm), compared with only 0.2–3 μm for silicate glasses. The oxide chemistry of the glass also contributes to its enhanced thermal, environmental, and structural stabilities and corrosion resistance compared to fluoride glass hosts, the deterioration of which poses a major problem for system design 〚11, 12〛. Some of the most attractive spectroscopic and optical properties of tellurite glasses are relatively low phonon energy (780 cm–1) amongst oxide glass-formers 〚13〛, high linear and nonlinear refractive indices 〚14〛, large rare-earth ion solubility, and absorption and emission cross-sections, which make it an attractive candidate for designing high-quantum-efficiency and power-efficient lasers and amplifier devices 〚11〛.
In this article, we elucidate mainly the compositional effects on the spectroscopic properties of Er3+, Tm3+, and Nd3+ doped tellurite glasses and fibres for their potential applications as tuneable broadband laser source and broadband gain flattened waveguide and fibre amplifiers. In particular the Er3+ and Tm3+-doped tellurite glasses and fibres have been examined in more detail than Nd-doped tellurite glasses for their spectroscopic properties because of the interest in C-, L-, and S-band amplifiers. The effect of the glass compositions on emission have been measured and discussed at room temperature and at 5 K. The concentration quenching effects and the role of co-dopants on the spectroscopy of RE-ions are discussed for designing efficient devices. The fluorescence properties of Nd3+ at 1.34 μm in tellurite and silicate glasses have also been compared and discussed in some detail.
2 Experimental procedure
2.1 Preparation of bulk glass
The rare-earth-doped samples of tellurite glasses were produced by melting of high-purity commercial oxides (≥ 99.99%) in a continuous stream of air atmosphere. The melting and homogenisation of mixtures were carried out at 800 °C for 2 h in a gold crucible, which was placed inside a silica-glass melting chamber. After homogenisation, the melt was quenched in a preheated brass mould at 270 °C. The quenched glass was annealed for several hours and was allowed to cool to room temperature naturally. Samples were cut from the cast glass block sample, and the surfaces were polished to a ∼1-μm finish for different optical and spectroscopic characterisation.
2.2 Preform preparation and fibre drawing
A similar melting procedure, as described for bulk glasses, was adopted for making core and cladding glass. The glass preform was made by suction and rod-in-tube methods. The rotational casting method was employed for the fabrication of jacketing tubes. The cladding tube made by suction casting and core rods were drawn to make a caned structure, which was then assembled together with the drawn jacketing tube for final drawing to single-mode fibre geometry. The refractive indices of core/clad and the jacketing structures were chosen in such a way to strip-off the cladding modes in the single-mode fibre structures with numerical aperture, NA = 0.2.
2.3 Absorption and emission spectrum measurement
The absorption spectrum of a polished glass was obtained by using a Perkin-Elmer UV/VIS/NIR Lamda 9 spectrometer. The sample was scanned in the range 300–3200 nm. The measured absorption data were used to calculate the absorption cross-section using the Beer–Lambert law.
The main excitation source used for fluorescence measurements was a Schwarz Electro-optic Ti-sapphire CWBB laser pumped by two Coherent 200 5-W argon ion lasers. The pump laser wavelength was 980 nm for the measurement of the spectra and the lifetimes of the 4I13/2 →4I15/2 transition at 1530 nm in Er3+ doped glasses. The laser wavelength for Tm3+ and Nd3+-doped samples was an 800 nm source from Ti3+ sapphire laser. For fluorescence spectrum measurement, the bulk glass sample was positioned so that the pump beam was allowed to be incident at the edge of the sample, and the optical path of emitted light through the sample to the detector was approximately 1 mm. For fibre emission spectrum, the pump was launched at one end of the fibre and the ASE wavelengths from the other end were detected. The strength of the emission line for each glass sample was recorded using a scanning spectrometer with an InGaAs detector (Macam Photometrics), for which the spectral resolution was approximately 2 nm. The values of stimulated emission cross-sections were calculated from absorption cross-sections using the McCumber method 〚15〛. The same set-up was also used for the measurement of lifetimes. A mechanical chopper was used to modulate the pump, the fluorescence was detected using a fast response InGaAs detector, and the fluorescence decay curves were recorded using a digital storage adaptor. The lifetimes were calculated by fitting an exponential function to the data. Fluorescence lifetimes were measured in all bulk glasses, and the emission spectra were recorded for both bulk glass and fibre geometries.
3 Results and discussions
3.1 Er3+-doped tellurite glass
3.1.1 The 4I13/2→4I15/2 transition in Er3+-doped TeO2–ZnO–R2O (R2O = Li2O, Na2O and K2O) glasses
Fig. 1 shows the Er3+ ion absorption spectra for the ternary compositions (90 – x) TeO2–9 ZnO–x Na2O–1 Er2O3 (x = 5, 10, 15 and 20), whereas Figs. 2 and 3 compare the values of absorption cross-sections at 800, 980, 1495 and 1532 nm and the peak values I1495/I1532, I980/I1532, and I800/I1532 as a function of alkali composition. Fig. 4 compares the normalised emission spectra for different glass compositions. The absorption spectra and the absorption cross-sections of the peaks in Fig. 4 change only marginally as a function of sodium ion concentrations. However, the lineshape of these absorption peaks remain similar in shape. The Er3+ absorption cross-sections for the three peaks at 800, 980, and 1495 nm decrease only slightly with increasing alkali-ion concentrations. Amongst the three pumping wavelengths, the absorption cross-section at 800 nm is less than half of the peak at 980 nm, whereas the peak at 1480 nm peak is nearly two times larger than the peak at 980 nm. The change in the absorption cross-section with the increasing concentrations of Na2O is expected, since the replacement of Na2O by TeO2 increases the refractive index of the glass, which in turn enhances the absorption cross-section. The effect of sodium oxide addition on the structure of TeO2 glass was also carried out to analyse the local changes in the environment of Er-ions.
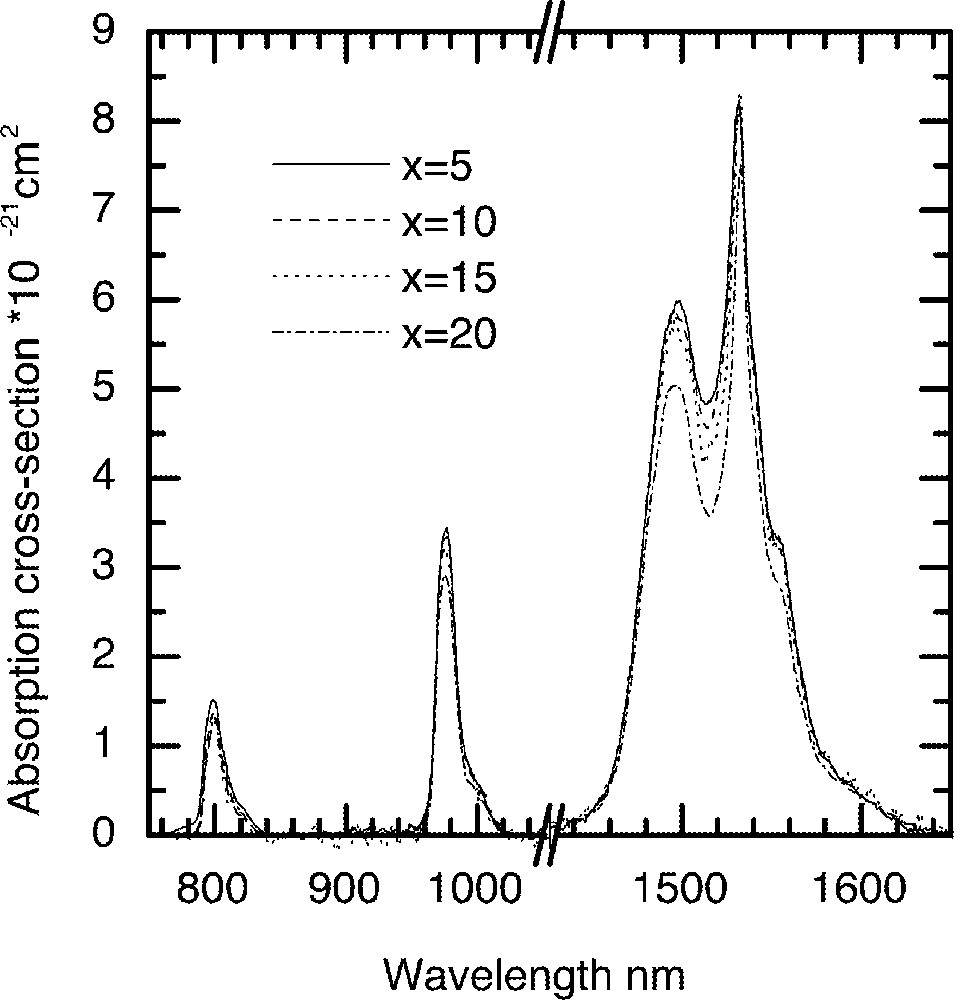
A comparison of Er-ion absorption spectra in the (90 – x) TeO2–x Na2O – 9 ZnO–1 Er2O3 (x = 5, 10, 15 and 20) glass as a function of Na2O concentration.
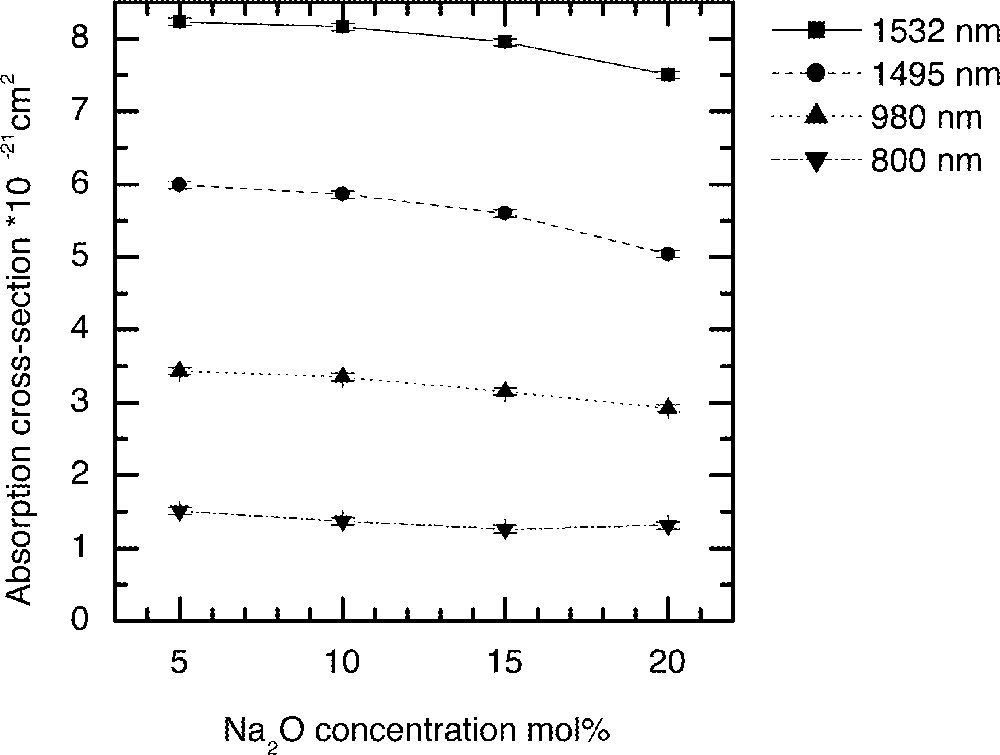
The dependence of Er-ion absorption cross-sections on the Na2O concentration in tellurite glasses discussed in Fig. 1.
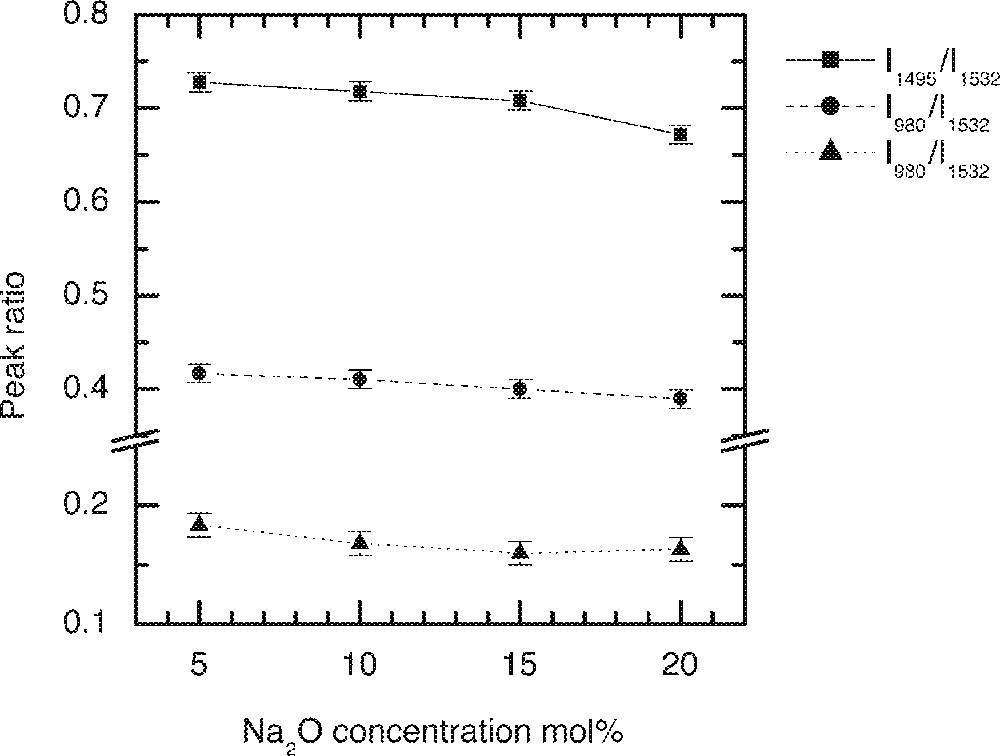
The dependence of intensity ratio of Er-ion absorption peaks on the Na2O concentration in tellurite glasses.
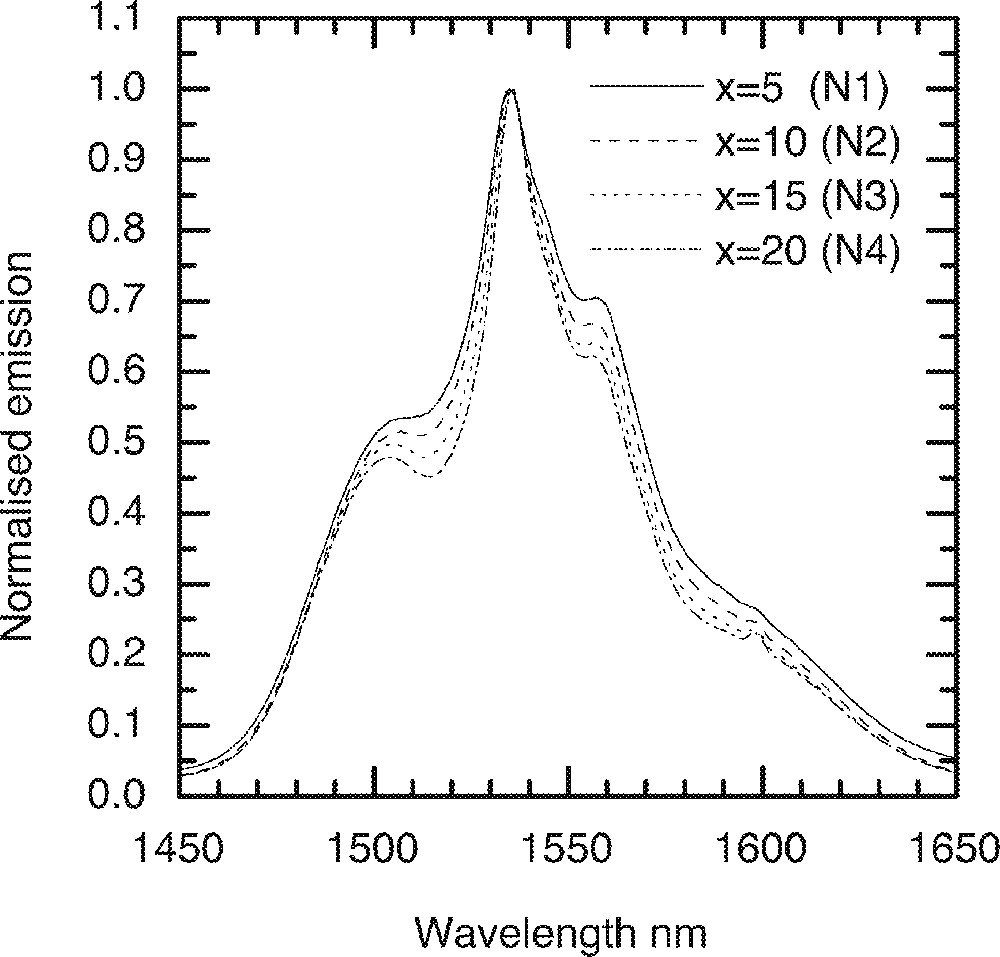
A comparison of the Er-ion emission spectra with various Na2O concentration in the (90 – x)TeO2–x Na2O–9 ZnO–1 Er2O3 (x = 5, 10, 15 and 20) glass.
It is evident from Raman spectrum studies that when the alkali ions substitute TeO2, the structure becomes less closed packed with more non-bridging oxygen and 〚TeO3〛 trigonal pyramid units 〚11, 13, 16〛; therefore, the ligand field interaction between the Er3+ ions and the host glass becomes weaker; this will also result in the decrease of absorption cross-section. The ratios I800/I1532 and I980/I1532 peaks virtually remain unchanged, as can be seen in Fig. 3, with the increasing alkali ion concentrations. However, the I1495/I1532 ratio initially remains unchanged, but changes only slightly beyond 15 mol%. The reason for the absorption cross-sections at 800 and 980 nm being less sensitive to the composition than 1495 and 1532 nm is that the energy levels (4I9/2 and 4I11/2) have smaller J (total angular momentum); thus the extent of Starck splitting is less compared to the splitting of 4I13/2 and 4I15/2 levels. These two peaks at 1495 and 1532 nm originate from the same 4I13/2 energy level; however, they emerge from different sub-levels. The intensity ratio between these two peaks reflects the distribution of the sub-levels, as it determines the breadth and flatness of the 4I13/2→4I15/2 transition. The weaker ion–host interaction consequently results in the narrower emission spectra, which are compared in Fig. 4 for increasing Na2O content in the glass.
The effect of replacement of Na2O by Li2O and K2O on the absorption and emission spectra, values of cross-section and peak heights are compared in Figs. 5–8, respectively. From Fig. 5, the lineshape of ground state absorption spectrum in the 1480-nm region are quite similar in glasses with different alkali ions, however there is a small but systematic decrease in the values of cross-sections when comparing a Li2O containing glass with its Na2O and K2O analogues in Fig. 5. The 4I13/2→4I15/2 transition in Er3+-doped glasses is dominated more by the magnetic dipole interaction than the electric dipole, which is why changing the refractive index (or the dielectric constant) of the hosts does not change the position of the emission and absorption peaks for the above transition. The decrease in the values of cross-sections in Na- and K-ion-doped glasses is a manifestation of the reduction in the overall interaction strength of the host. The interaction strength depends upon the molar polarisabilities and magnetic susceptibilities of the alkali compounds under consideration 〚17a, 18a〛. Note that the negative values of diamagnetic susceptibilities of alkali oxide increase from Li2O to K2O, which for Er2O3 (including other lanthanides) is large and positive of the order of 73 920 × 10–6 (in cgs units, see ref. 〚19〛), indicating the strong paramagnetic nature of the lanthanide oxides. The combined multipole O–RE–O–R (Li, Na, K) at the non-bridging sites in the tellurium oxide glass has therefore a strong paramagnetic coupling, which increases from potassium ion to lithium ion, in the same order as does the area under a line shape change in Figs. 4 and 5. The effect of increasing the concentrations of an alkali is same as increasing the value of diamagnetic susceptibility. It is because of a strong paramagnetic interaction that the values of the intensity ratio (I1495/I1532) for different alkali-containing glasses decrease from Li+ to K+, as do the breadth of the peaks in Fig. 6.
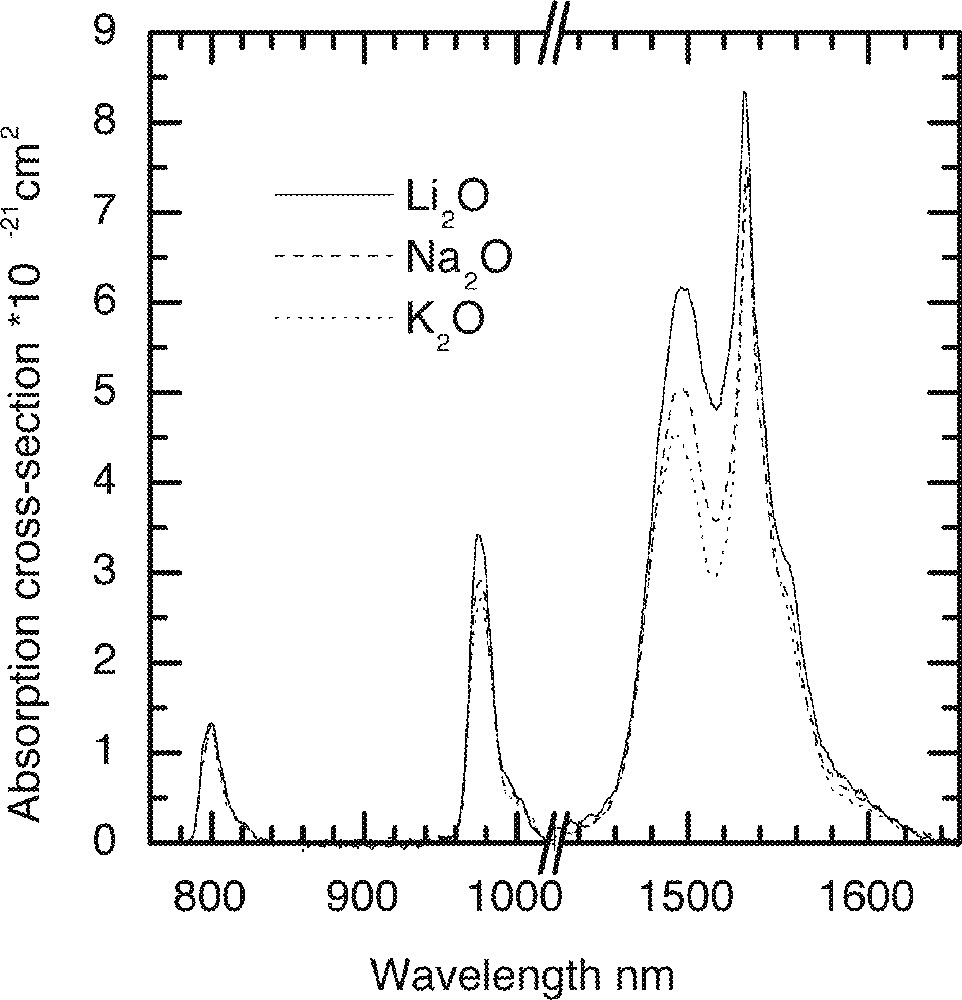
The effect of alkali oxide (X = Li2O, Na2O and K2O) on the Er-ion absorption spectra in 70 TeO2–9 ZnO–20 X–1 Er2O3 glass.
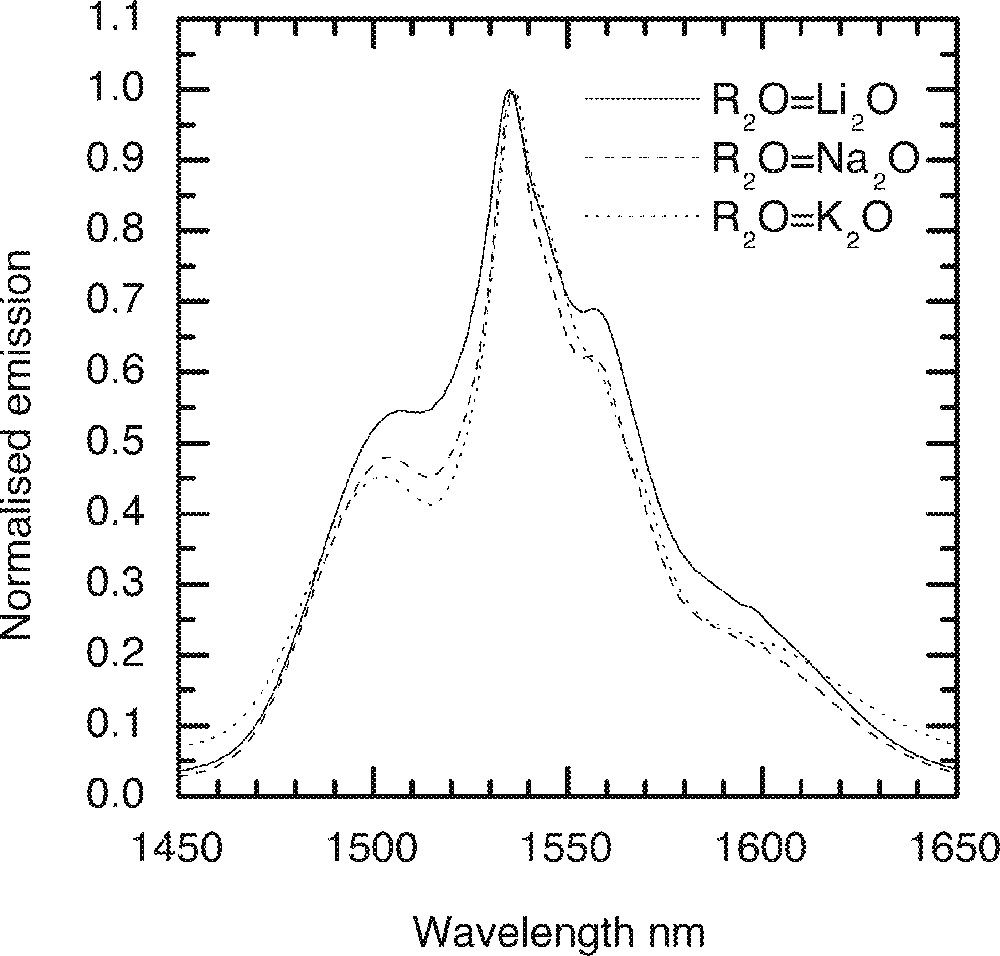
A comparison of the Er-ion emission spectra in alkali oxide containing tellurite glass (70 TeO2–9 ZnO–20 R2O–1 Er2O3, R2O = Li2O, Na2O and K2O).
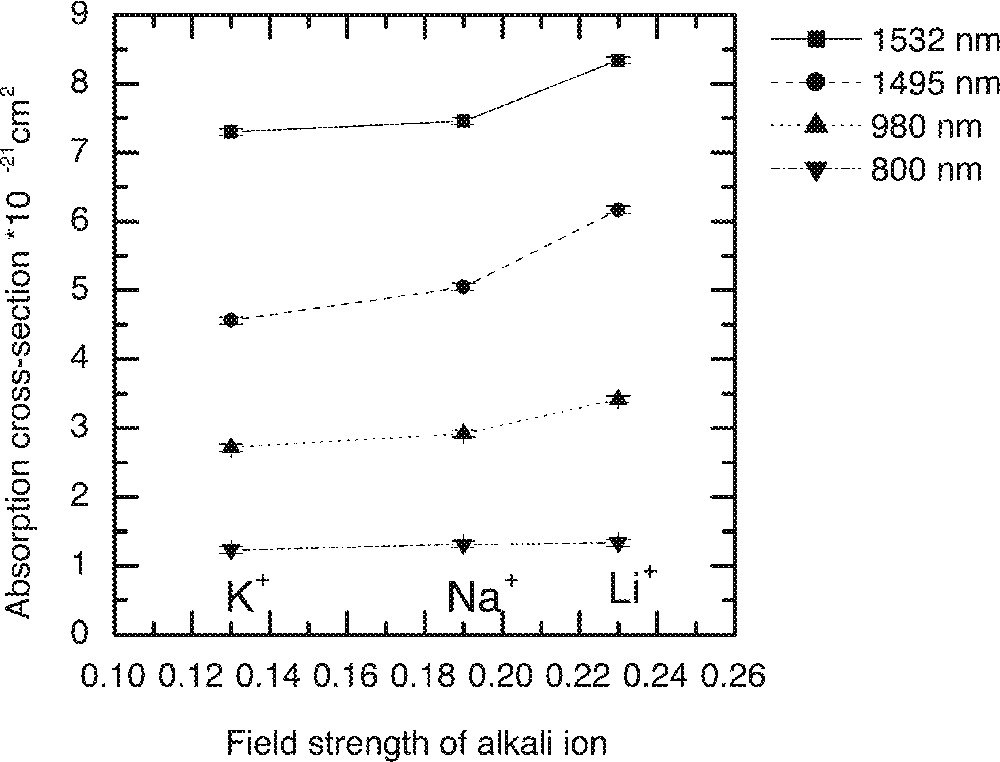
The dependence of the Er-ion absorption peaks on the field strengths of alkali ions in the 70 TeO2–9 ZnO–20 R2O–1 Er2O3 (R2O = Li2O, Na2O and K2O) glass.
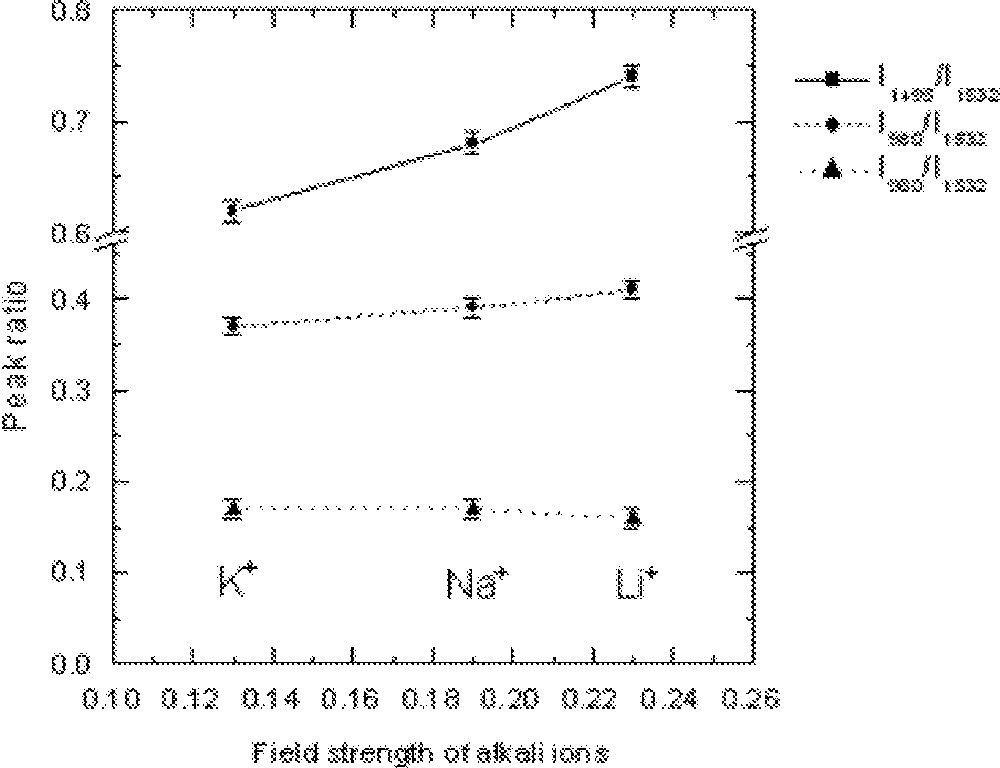
The dependence of the Er-ion absorption peak strength, determined by the absorption ratio, on the field strengths of alkali ions present in the glass 70 TeO2–9 ZnO–20 R2O–1 Er2O3 (R2O = Li2O, Na2O and K2O).
The substitution of ZnO in the glass composition (85 – x) TeO2–x ZnO–10 Na2O–1 Er2O3 at x = 4, 9, 14, 19 mol% in the TZN glass is designated by Z1, Z2, Z3 and Z4, respectively. Figs. 9–11 compare the changes in Er3+ ion absorption cross-section values, peak ratio and emission spectra change with various concentrations of ZnO. The observed changes in the line shape properties for the 4I13/2→4I15/2 transition in ZnO-modified tellurite glasses are less significant than the modification effects observed for the alkali ions shown in Figs. 5–8. The related compositional insensitivity of line shape in the presence of ZnO is due to a major difference in the structural role a Zn2+ ion plays compared to an R+-ion. ZnO acts as a network stabiliser by pairing with the lone-pair electron sites (LPE) at 〚TeO4〛, 〚TeO3〛, and 〚TeO3+d〛 structures 〚11, 13, 16〛. This pairing with an LPE site means that Zn2+ ions in the TeOn (n = 3–4) structure rarely encounter an Er3+-ion in its immediate vicinity, suggesting that the line shape is not affected by the presence of ZnO. On the other hand, an Er3+-ion due to its naturally large coordination number (CN ≥ 6) 〚19〛 tends to occupy a non-bridging site, as does an alkali ion such as Li, Na, and K ions. Consequently the probability of finding an Er-ion in the second coordination shell of an alkali ion increases, which is why multipoles O–RE–O–R (R = Li, Na, K) influence the absorption and emission cross-sections more than do the Zn-ions.
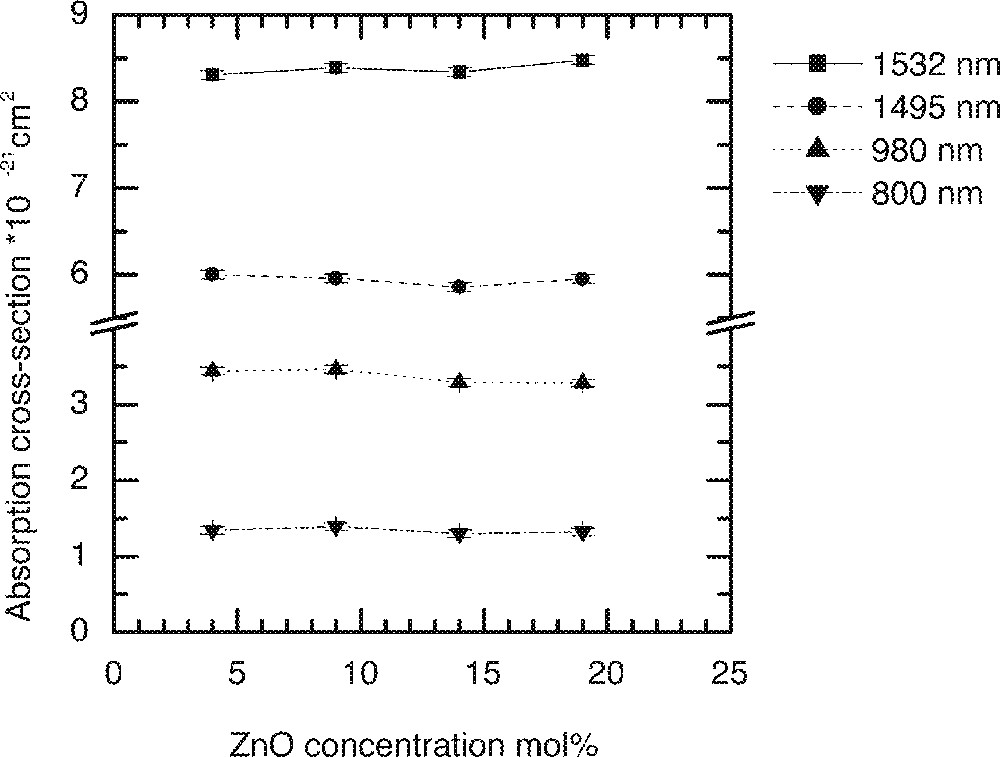
The dependence of Er-ion absorption cross-sections on the ZnO concentration in the tellurite glasses: (90 – x) TeO2–10 Na2O–x ZnO–1 Er2O3 (x = 4, 9, 14, and 19).
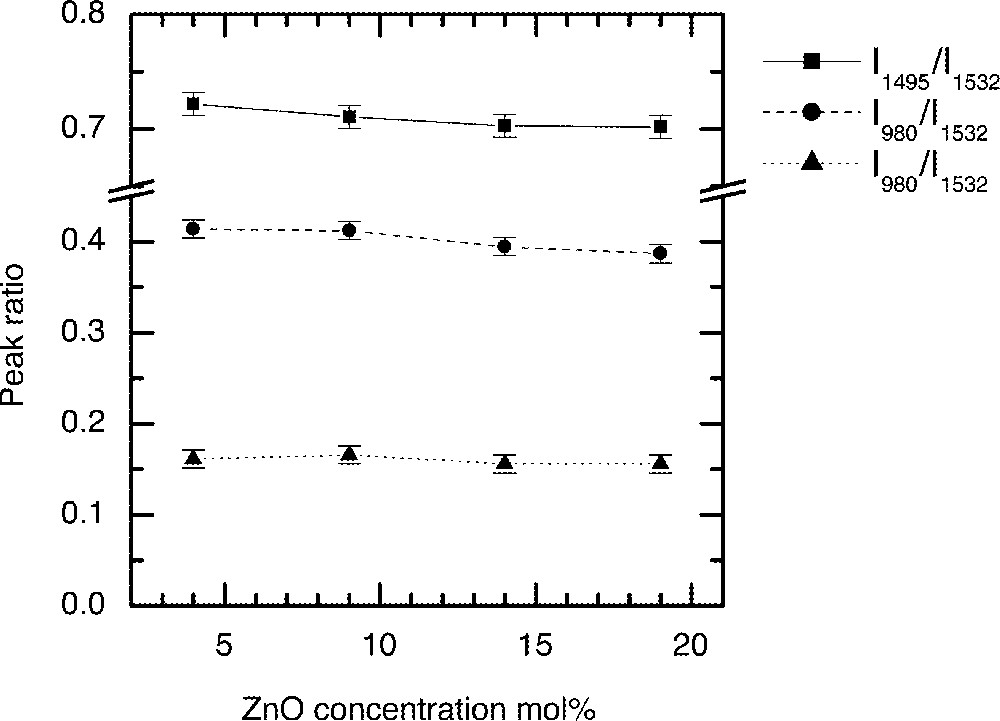
The dependence of intensity ratio of Er-ion absorption peaks on the ZnO concentration in tellurite glasses: (90 – x) TeO2–10 Na2O–x ZnO–1 Er2O3 (x = 4, 9, 14, and 19).
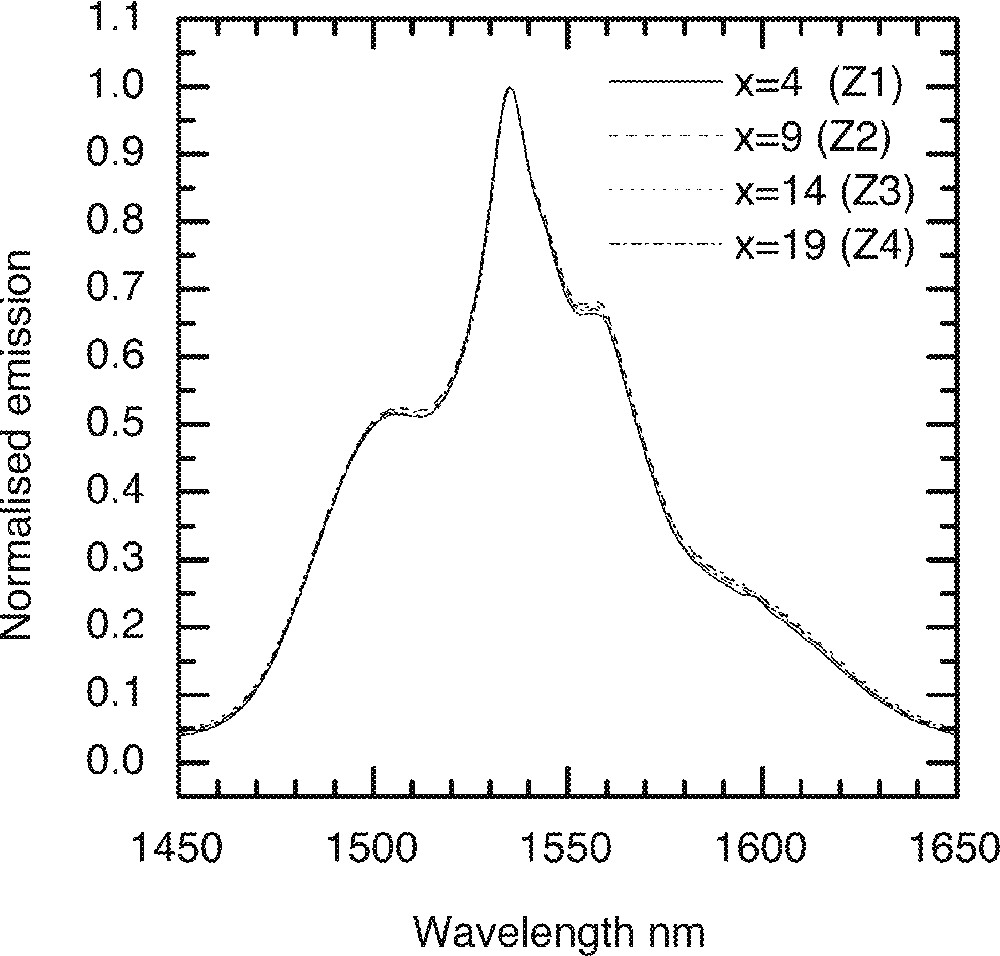
A comparison of the Er-ion emission spectra on the ZnO concentration in the tellurite glasses: (90 – x) TeO2–10 Na2O–x ZnO–1 Er2O3 (x = 4, 9, 14, and 19).
3.1.2 Er3+ emission at different concentrations
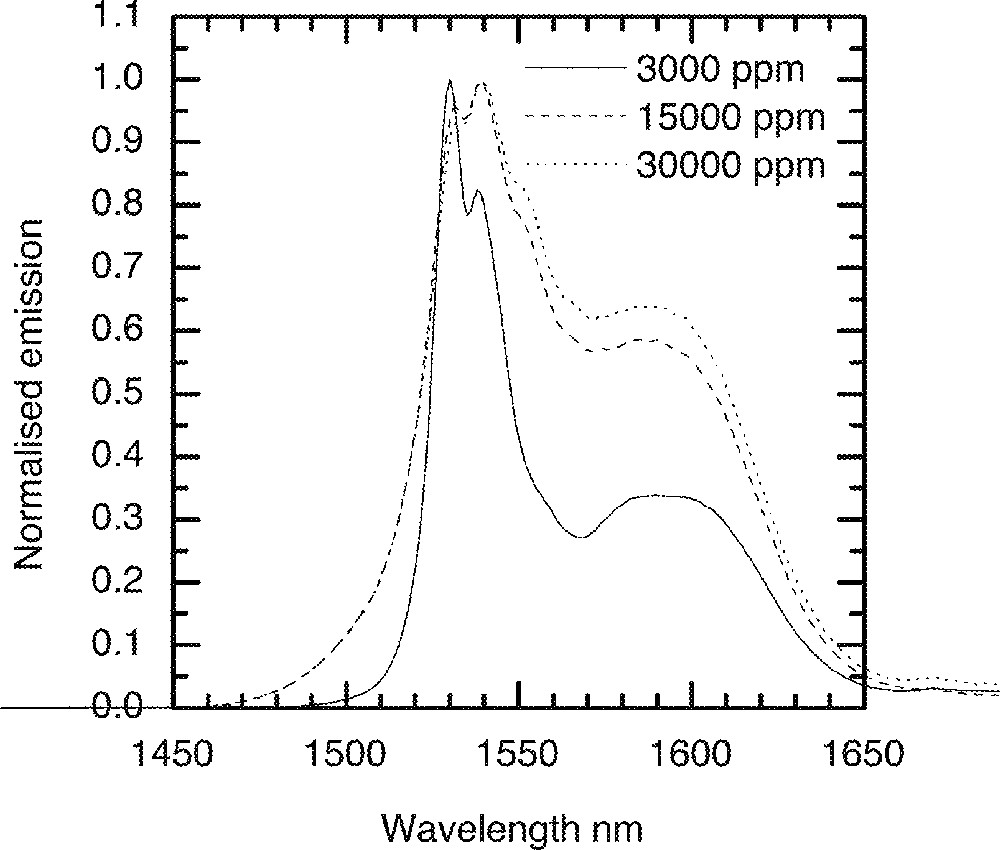
In the ternary 80 TeO2–10 ZnO–10 Na2O (mol%) tellurite glass, also called the TZN glass, the effect of Er2O3 concentrations on the emission spectrum and the lifetimes of 4I13/2 level is investigated. Fig. 12 shows the normalised emission spectra of Er3+ ions at different concentrations, in which a significant broadening of emission with increased Er3+ ion concentrations is clearly observed. Since neither the line shape nor does the peak position change with concentrations, it suggests that the broadening may be due to a large number of different sites being populated with the increasing Er-ion concentration in the glass. These sites may have a range of symmetries and site configuration, which may vary due to the local structure and also due to the different coordination of Er-ions. Note that by increasing the concentrations of Er-ions in the glass also enhances the paramagnetic contribution to the multi-pole interaction.
The dependence of emission lineshape on the Er-ion concentrations in 80 TeO2–10 Na2O–10 ZnO glass.
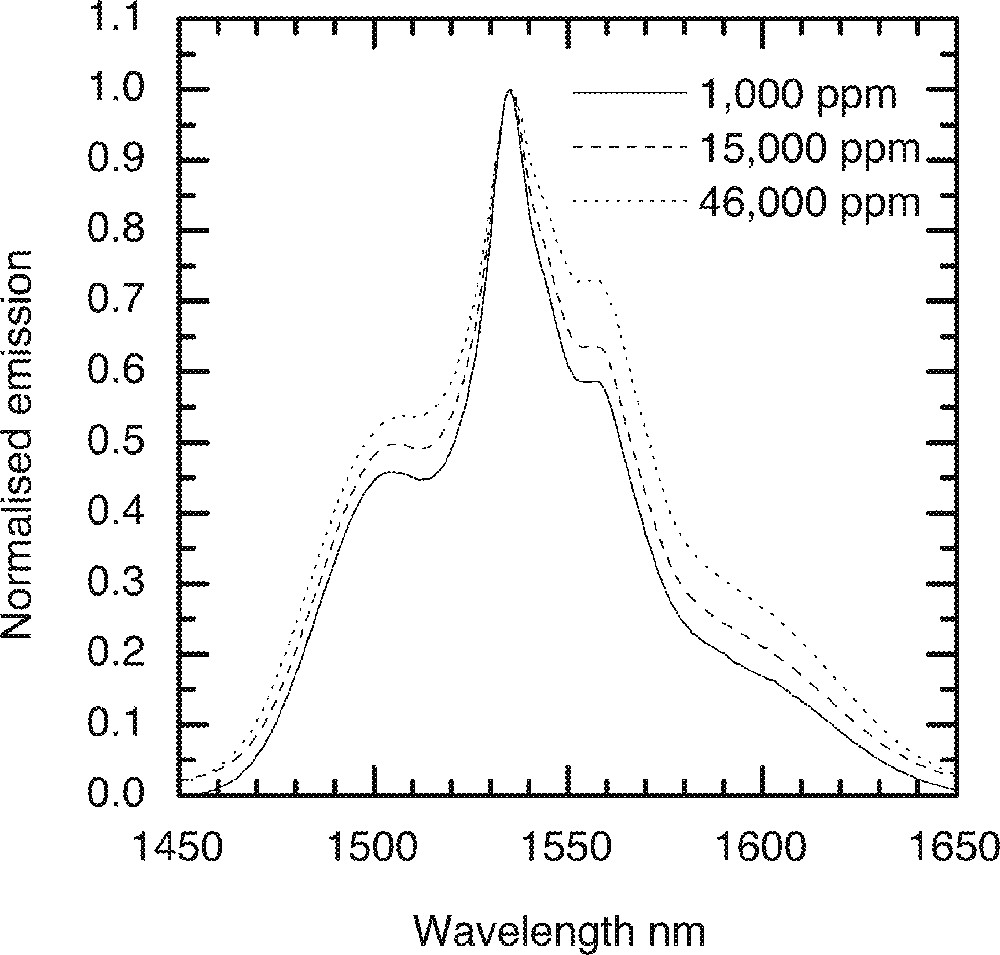
Concentration quenching is manifested by the shortening of the excited state lifetime, which reduces the quantum efficiency. The ion-ion cross relaxation process contributes to this effect, which sets in as the concentrations of the dopant ions in the glass increase. Fig. 13 depicts a complex behaviour of the dependence of the 4I13/2 level lifetime on the concentrations of Er-ions and residual OH– ions in the glass. In this figure, the lifetime first increases with the increasing concentrations of Er-ions, which then peaks at 7.6 ms at around 11 000 ppmw of Er-ion in low OH-containing glass, for example, and then begins to drops gently beyond 11 000 ppmw. In general, the lifetime decreases with the increasing Er-ion concentrations in all silicate and phosphate glasses 〚17b, 18b〛. However a similar trend, as shown in Fig. 13, was also observed in other types of tellurite glasses containing tungsten oxides 〚20〛.
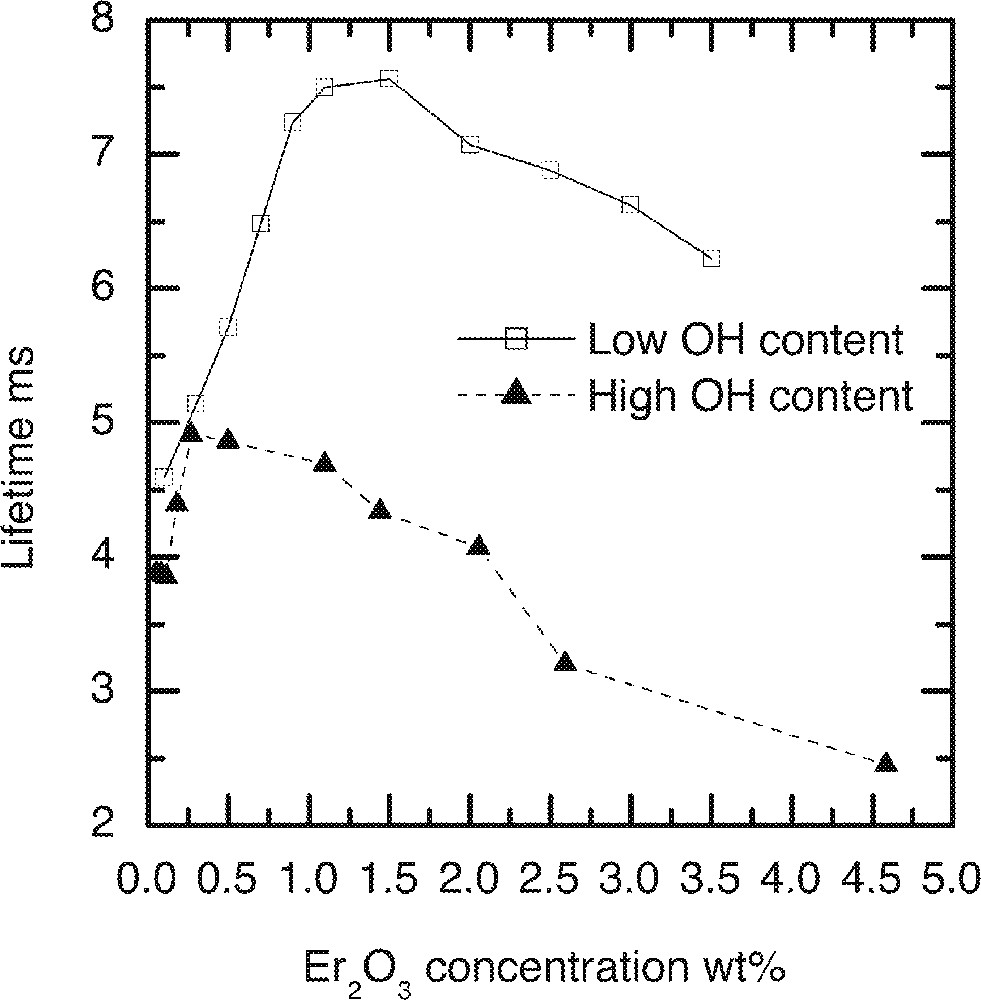
The lifetimes for 4I13/2→4I15/2 transition at 1.53 μm as a function of the Er2O3 and OH-ion concentrations in the TZN tellurite glass.
The concentrations of residual OH– present in the glass were controlled during melting by using the dried and wet atmospheres of air. Fig. 14 shows the OH– absorption peaks obtained after melting the glass samples in the two different atmospheres of air. The observed fundamental peak centred at 3.30 μm in tellurite glass is significantly shifted to a longer wavelength than those observed in fluoride and silicate glasses at 2.75 and 2.87 μm respectively 〚21, 22〛. The observed red-shift in the fundamental absorption peak of OH in TeO2 glass is due to a strong nephelauxetic effect, which is dominant in a high-refractive index medium such as a TeO2 glass. The lifetimes were measured by fitting the decay rate from 4I13/2 lasing level. It was found to be a single exponential function in all samples, regardless of Er3+ ion concentration.
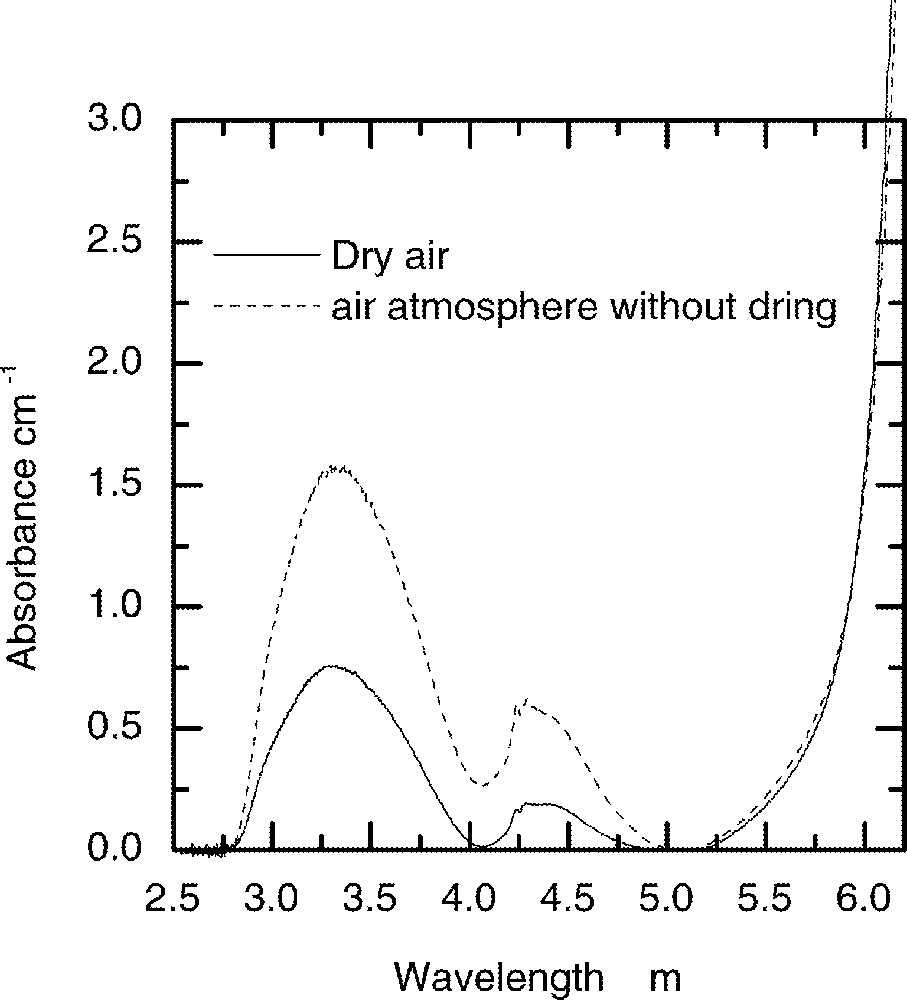
The influence of humidity in air on the absorption strength of OH– peak in the TZN glass melted under two different conditions.
The data analysis confirms that there is an absence of Er3+-ion clustering even at high doping levels higher than the 10 000 ppmw, as shown in Fig. 13. At concentration of Er3+- ions less than 10 000 ppm, the sharp increase in the lifetime of 4I13/2 level confirms that neither the OH– activated quenching nor the ion–ion transition is a dominating factor. Over 15 000 ppm, the lifetime drops more gently in low-OH– glass than in a high-OH–-ion-containing glass, indicating that the ion–ion transition process dominates only after 15 000 ppm. The lower values of the measured lifetimes in high-OH– glass are not unexpected, which is due to the increase in OH– ion induced quenching. The initial increase in the lifetime with rising concentrations has been explained in detail elsewhere by pointing out to a wide variation in the site occupancy 〚11〛. At low concentrations Er3+ ions preferentially occupy sites with slower decay rates, since the average ion–ion separation is larger than 0.31 nm. At higher concentrations, when Er-ions also begin to compete with the alkali and network stabilising oxides, the average ion–ion separation decreases, corresponding to the 20 000-ppmw concentration. It is also likely that at low concentrations, the energy migration from one Er-ion site to another Er-site may also become dominant, which will also disappear with the increasing concentrations of Er- and OH-ions.
3.1.3 Er3+ emission spectra at low temperatures
For Er3+-doped TZN glass, the emission spectrum was measured at cryogenic temperatures. A liquid helium cryostat was used to cool glass samples to 5 K. Fig. 15 shows the 4I13/2→4I15/2 emission spectra for N2 (composition in mol% : 80 TeO2, 9 ZnO, 10 Na2O, 1 Er2O3) and N4 (70 TeO2, 9 ZnO, 20 Na2O, 1 Er2O3) glasses. The line shape in N2 glass, as found from the room temperature spectroscopic data in Fig. 4, is broader than N4. The effect of Er-ion concentration on the line shape at 5 K is compared in Fig. 16, in which the effect of Er2O3 concentration on the breadth of emission is compared. By comparison of the emission data at room temperature with the spectra at 5 K, we find a major difference in the line shape. The short wavelength part of the emission (1450–1530 nm) becomes narrower and steeper, as the upper sub-Stark levels at low temperatures become sparsely populated. The shoulder region at 1500 nm almost becomes insignificant as the thermal or homogeneous population of sub-levels can no longer be possible at 5 K, due to the lack of sufficient energy. Consequently, the bottom most sub-levels are more densely populated, and thereby contribute to peaks at longer wavelengths, beyond 1630 nm. It should also be noted that the paramagnetic susceptibility of oxides also increases with decreasing temperature in accordance with the Curie–Weiss law. Consequently the overall enhancement in the emission line shape has also a significant contribution from the paramagnetic susceptibility of the dipole environment around the Er-ions in the tellurite glass.
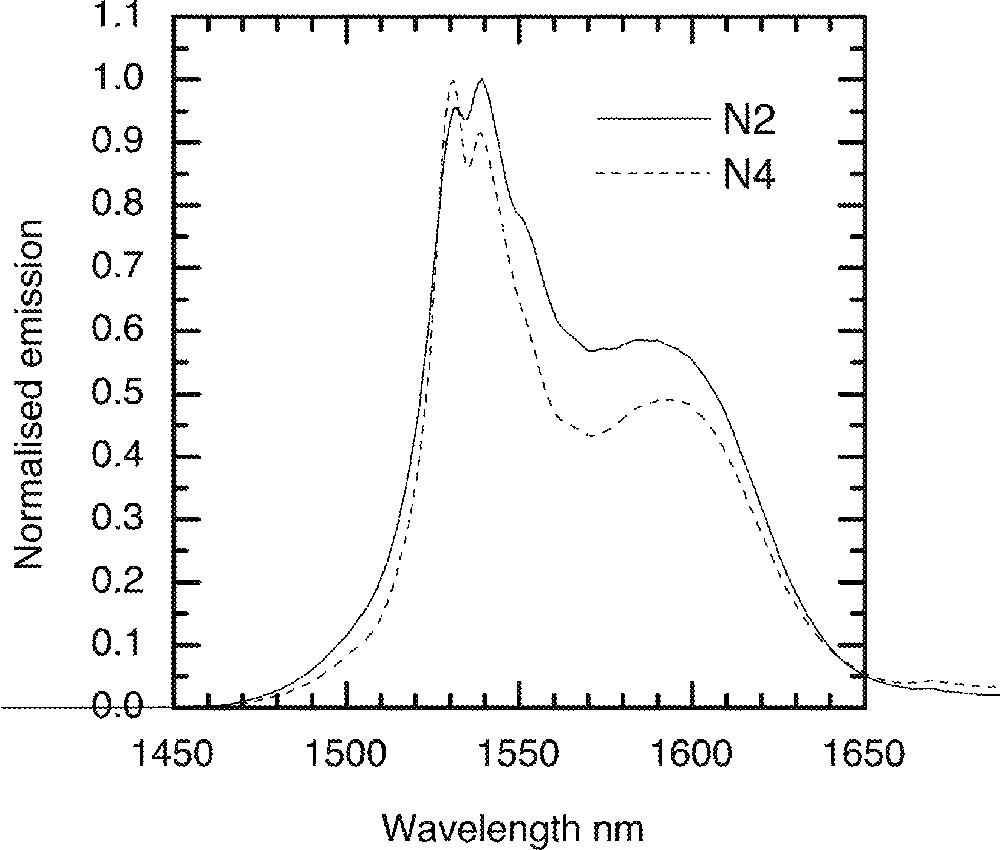
A comparison of the Er-ion emission with various Na2O concentration at 4 K. N2: 80 TeO2–10 Na2O–9 ZnO–1 Er2O3 (mol%); N4: 70 TeO2–20 Na2O–9 ZnO–1 Er2O3 (mol%).
The influence of the Er-ion concentrations on the emission spectra at 4 K in the TZN glass.
3.1.4 Er3+ emission spectra in fibre
Based on the study of Er3+-ion-doped tellurite glasses, a pair of core and clad glasses based on the TZN family of compositions was selected for preform fabrication and fibre drawing. The dopant concentration in the core glass was 0.5 mol%, and the index difference between the core and cladding glass yielded the value of NA = 0.2, with ncore = 2.085. In Figs. 17a and 17b, the cross-sections of caned preform and single-mode fibre (SMF) are shown respectively. The examination of fibre length for scattering was carried out using the IR imaging and near-filed spectroscopy, which revealed the presence of small gas bubbles as the main scattering centres, as shown in Fig. 18a. The SMF loss curve is shown in Fig. 18b, from which it is apparent that the absorption peak at 1480 nm is overlapping with the first overtone of OH– at around 1.65 μm, which, like the fundamental peak at 3.3 μm in Fig. 14, is also broad. The attenuation curve also shows the absorption peaks at 980 and 800 nm for the 4I11/2 and 4I9/2 levels. The minimum background loss in the 1200–1400-nm range is less than 800 dB km–1, which is much larger than the total intrinsic loss at the same wavelength by three orders of magnitude (4000–6000 times).
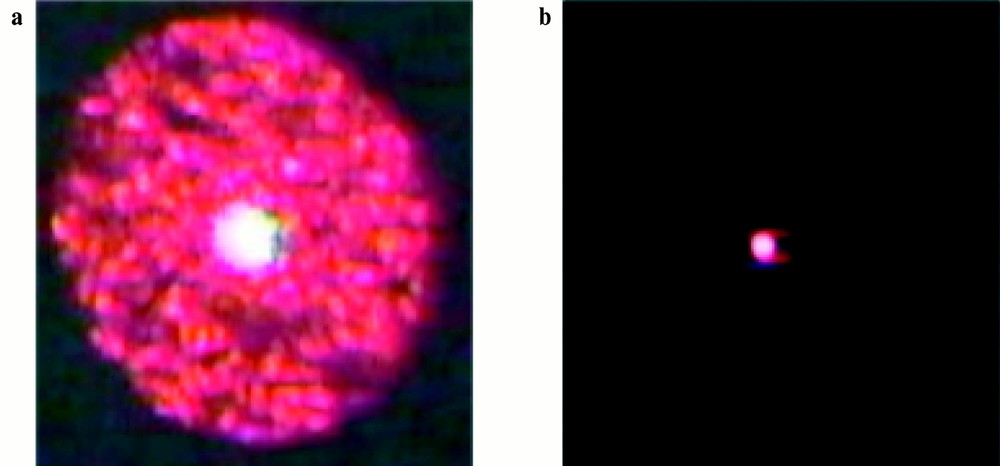
a. Cross-section of a multimode TZN fibre with ∼20 μm, showing a large number of cladding modes. Fibre diameter: 125 μm, loss < 1 dB m–1 at 1550 nm. b. Cross-section of a single mode fibre with ∼5 μm core diameter, fibre diameter: 125 μm, loss spectrum shown in Fig. 18b.
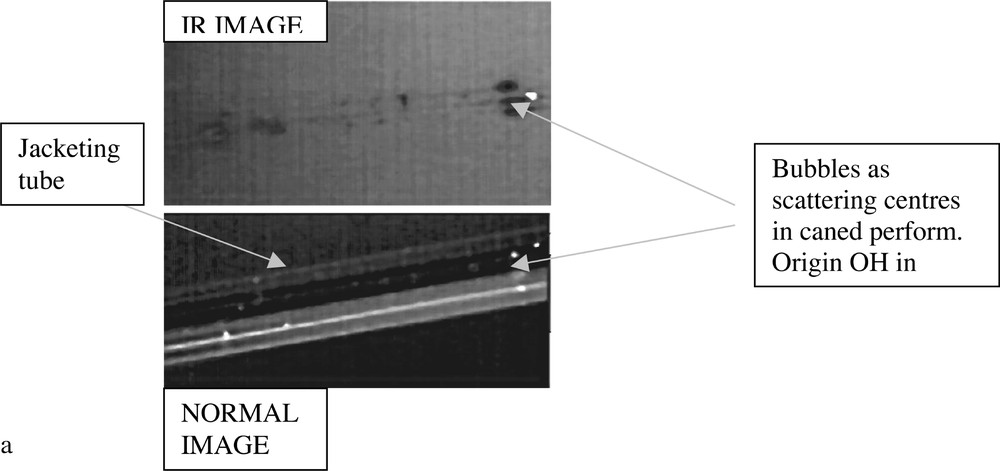
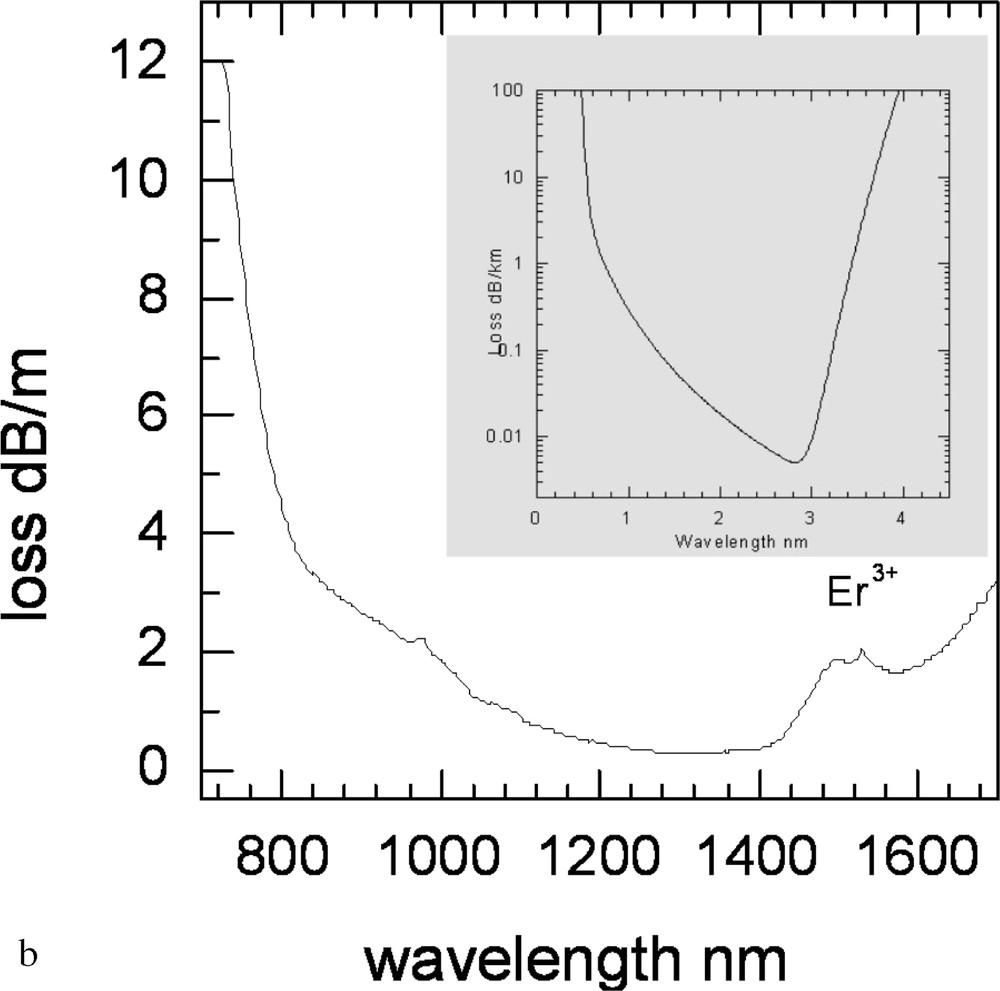
a. Photograph of TZN fibres showing gas bubbles contributing to scattering. b. The loss spectrum of Er-doped TZN single-mode fibre. Comparison of the intrinsic loss (inset) curve with the measured loss in tellurite fibres (courtesy: Jens Koblke).
The emission for the 4I13/2→4I15/2 transition at 1530 nm in single-mode fibres was measured at 980 nm pumping schemes. The changes in the shape of emission curves as a function of lengths were recorded and are compared in Fig. 19, from which it is apparent that the lineshape widens in the fibre waveguide, due to a significant re-absorption and re-emission of the propagating ASE. The longer is the length of the fibre, the greater is the extent of re-absorption at shorter lengths leading to the population of bottom sub-levels of 4I13/2, which from previous analysis 〚11〛 can be as broad as 150 cm–1. Consequently, the ASE spectrum shifts to longer wavelengths as a result of the transition occurring between the bottom sub-levels of 4I13/2 and top sub-levels of 4I15/2. The emission finally decays, as the ESA at 1480-nm wavelength begin to dominate at high Er-ion concentrations.
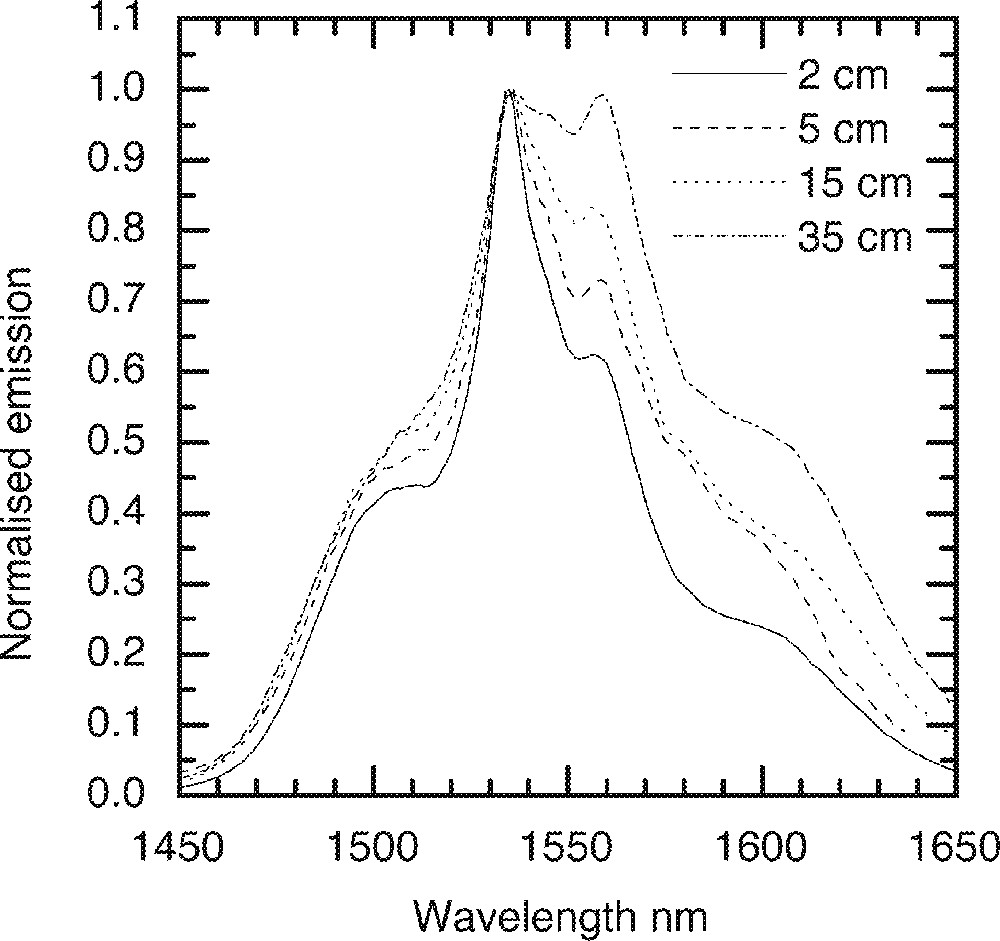
Comparison of ASE spectrum as a function of length in the Er-doped single-mode fibres pumped at 980 nm. The dopant concentration is 0.5 mol%.
3.1.5 Discussion of the emission spectrum broadening
In rare-earth-doped glass, the line strength and the shape of a transition between the two states is dependent on the electric and magnetic dipole interaction, which is determined by the intrinsic susceptibility and dielectric constants of compounds as described under section 3.1.1. The origin of spectral broadening in Er-doped tellurite glasses is explained elsewhere 〚11〛, where the importance of ion–host interaction was emphasised by considering the electric dipoles, and their structural dependence based on the analysis of chemical bonding. From the previous investigations 〚11, 23〛, the following main points were concluded.
(a) The multiplicity of sites in the TeO2 glass structure originates from the presence of TeO4, TeO3, and TeO3+d structures, which have different Te–O bond lengths, ranging between 0.188 and 0.222 nm.
(b) Each of the above three structural units in the TeO2 glass has an LPE site, which is equivalent to an oxygen ion charge. The dipole interaction due to an LPE is strongly dependent on the type of modifiers and network stabilisers incorporated, as discussed above in Section 3.1.1.
(c) Er3+-ions also exhibit more than one coordination (6–8-fold) due to its complex structure 〚24〛, which in combination with three different types of TeOn environments and LPE sites produce a range of possible sites variations.
(d) An analysis of the molar magnetic susceptibilities of alkali and RE-ions also exhibits that the 4I13/2→4I15/2 transition is dominated by the magnetic dipole interaction, and the observed changes in the line shape are also strongly dependent on the paramagnetic interactions of multipole pairs O–Er–O–R in the TeO2 glass.
The strength of these interactions is clearly manifested by the emission measurements at low temperatures, which identifies the dominant transition levels and their contributions to line broadening.
3.2 Tm3+-doped tellurite glass
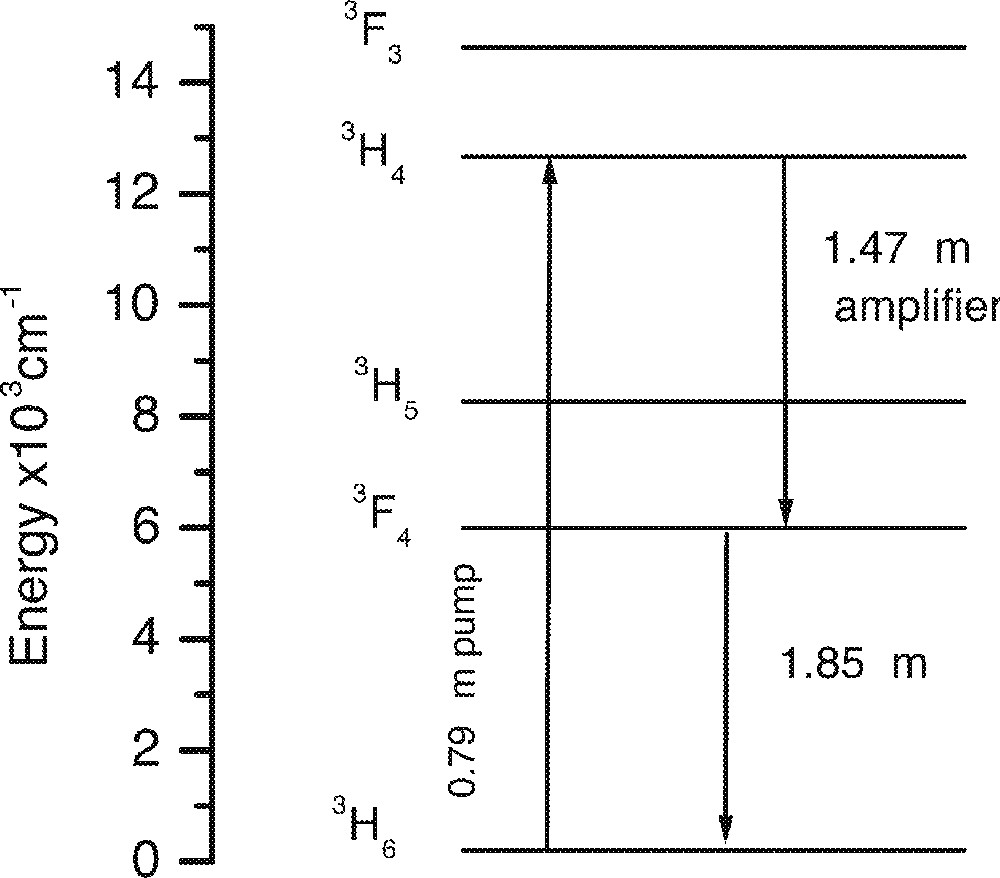
In recent years, Tm3+-doped fluoride fibre amplifiers (TDFA) at 1.46 μm have attracted considerable attention as a means of extending the transmission bandwidth of optical fibres beyond the range available from Er3+-doped fibre amplifiers (EDFA) 〚4–6〛. Several types of TDFA have been developed utilising different pumping schemes and methods of relieving the population in the lower lasing level 〚25–27〛. Fig. 20 shows the energy level diagram of Tm3+. The 1.46 μm transition is 3H4→3F4. The 3H4 level can be excited directly by a 790–800-nm pump. However, the lasing at 1.46 μm band is limited by the fact that the lifetime of the upper level, 3H4, is nearly 5 times less than that of the lower level, 3F4, which is also called the ‘self-terminating’ level for the 1.46-μm transition. The prolonged lifetimes of the lower lasing level makes the amplifiers and lasers difficult to operate, since the level cannot be rapidly depopulated to repopulate the ground state for promoting an efficient population inversion at the 3H4 level. The amplifier design must therefore include means of quenching the 3F4 level. Several successful schemes have been demonstrated in Tm-doped fluoride ZBLAN fibres. Upconversion pumping at 1064 nm and multiple pumping scheme using the sources at 1060/1200 nm and 1060/1200/1400 nm have been successfully adopted for amplification with better than 40% power conversion efficiencies 〚25–27〛. A dual pumping scheme using 800/1040 nm has also been used for small-signal gain 〚28〛. In another scheme, the fibre was co-doped with Tm3+ + Ho3+ and pumped at 0.79 μm into the 3H4 level of Tm3+ 〚29, 30〛. The 3F4 level is quenched via the energy transfer to the matching 5I7 level in Ho3+.
A partial energy level diagram of Tm3+ in TZN tellurite glass.
For Tm-doped amplifier devices, mainly three different types of hosts have been examined, and these are silicates 〚31〛, ZBLAN fluoride fibres 〚4–6, 32〛, and tellurite fibres 〚33〛. The quantum efficiency of Tm-doped silicate glass fibres 〚31〛 is less than 25%, due to the large phonon energy of host (1100 cm–1), which shortens the lifetime of the upper level via phonon-mediated decay by bridging the energy gap between the 3H4 and 3H5 levels. The energy gap is approximately 4400 cm–1. The emission bandwidth of the 3H4→3F4 transition is as large as observed in the case of ZBLAN fibres. Unlike silicates, the ZBLAN glasses are relatively low phonon energy glasses, with peak phonon energy at 580 cm–1. Consequently the phonon-mediated non-radiative decay rate is negligible, which prolongs the lifetimes of 3H4 level to nearly milliseconds. The quantum efficiency of the device is nearly 100%. However due to the low phonon energy of the glass host and the prolonged lifetimes of the upper, 3H4, and the lower 3F4 lasing levels the upconversion process leading to the emission of blue light, which damages the fibres, is unsuitable for amplifier operation. It is for this a number of complex pumping schemes has been devised to avoid using the 800-nm pumps for directly populating the 3H4 level. The long-term durability of fluoride fibres, although the technology is well advanced compared to the present status in tellurite glass fibres, still remains questionable.
By comparison, the tellurite glasses have much lower phonon energy (780 cm–1) than silicates, which reduces the probability of non-radiative rate at 3H4 level. The high-refractive index of the glass (> 2) compared to silicates and ZBLAN enhances the probability of radiative transition, leading to a quantum efficiency of better than 90%. The large index also causes the broadening of the emission and absorption lineshape. These specific aspects of rates are discussed below in detail together with the effects of co-dopants. Tellurite glasses also exhibit much improved resistance to environmental durability, which is comparable with the performance of silicates. The structural durability is however weaker than silicates, due to the intrinsically weaker chemical bonding, manifested by the magnitude of the phonon energy of the hosts under consideration. The structural durability of the fibres is improved by acrylate coating.
In this part, we have studied the changes in the emission spectra change of Tm3+-doped tellurite glasses for 3H4–3F4 transition at 1.46 μm, the effects of concentration quenching and co-dopants Ho3+ and Tb3+ on the energy transfer.
3.2.1 Tm3+ emission spectral change with glass compositions
For Tm3+ doped S-band amplifier, the leading edge of the gain spectrum should overlap with the trailing end of the gain spectrum for EDFA in order to improve the signal-to-noise in a broadband multi-channel amplifier operating in the 1450-1580-nm region. As has been demonstrated above that the glass composition can significantly change the spectra, depending upon the nature of dipole–dipole interactions involved. In order to assist with selecting and optimising the Tm-ion spectra, a range of glass compositions were studied. Fig. 21a shows the dependence of the line shape on the composition of Na2O and TeO2 in a TZN glass, in which, the Tm3+-ion emission spectra change with various TeO2 content. As Na2O replaces TeO2 in the ternary TeO2–Na2O–ZnO glass system, it is clear that the Tm3+ emission spectra become broader, the emission intensity at the shoulder around 1520 nm continue to increase and shift to longer wavelengths.
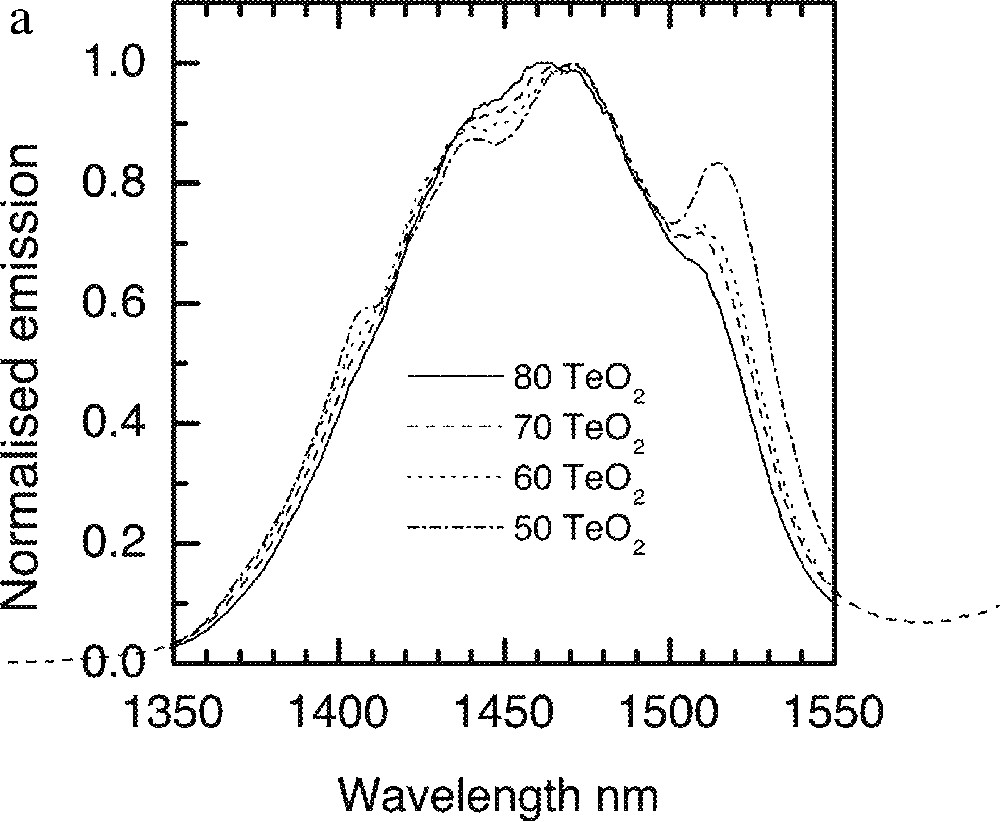
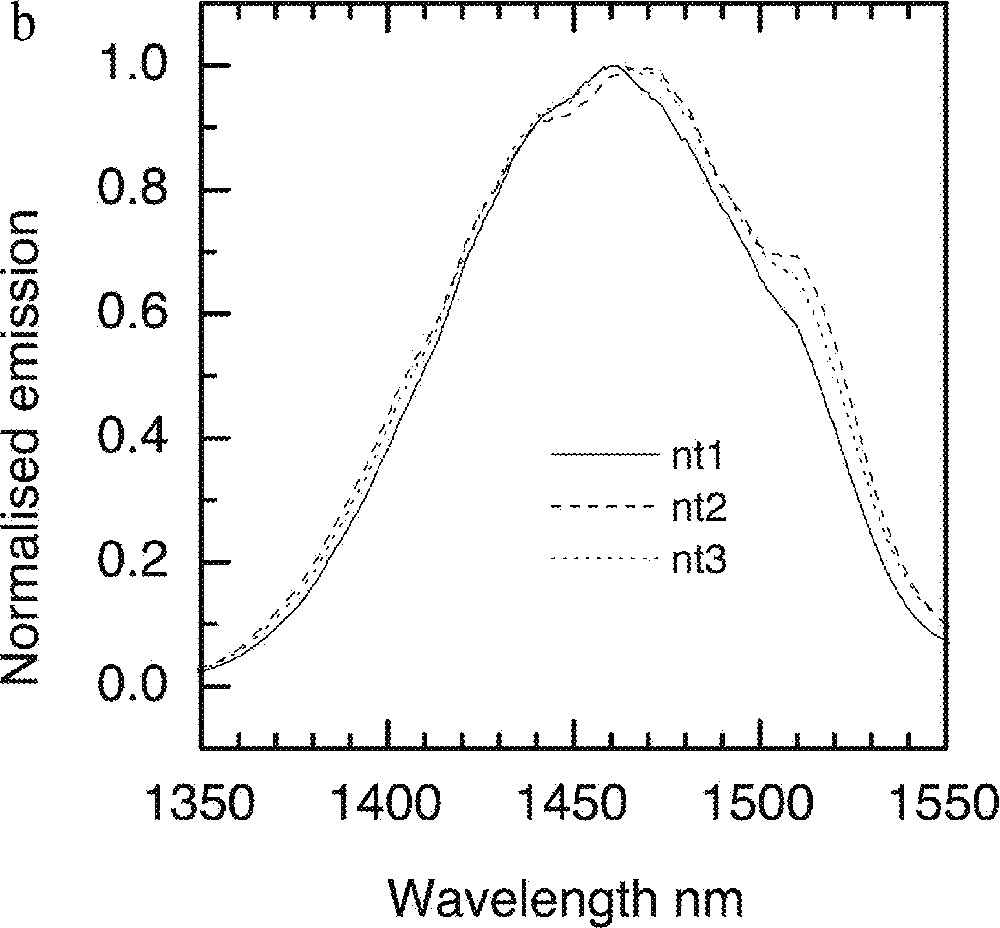
a. Dependence of Tm-ion emission spectra on the TeO2 concentrations in the tellurite glasses: (90 – x) TeO2–x Na2O–9 ZnO–1 Tm2O3 (x = 10, 20, 30 and 40). b. Tm-ion emission spectra in TZN glass system with various ZnO concentration, nt1: 80 TeO2–20 ZnO, nt2: 80 TeO2–20 Na2O, nt3: 80 TeO2–10 Na2O–10 ZnO.
The effects of Na2O and ZnO incorporation in a 80 mole% TeO2 containing glass are compared in Fig. 21b, from which it is evident that 80% TeO2–20% Na2O provides a much better overlap of the line shape with the Er-spectrum. However the compositions consisting of 80 mol% TeO2 and 20 mol% Na2O is thermally unstable. In Fig. 22, the effects of other types of trivalent oxides (Bi2O3, Ga2O3) and Li2O on the 1.46-μm emission are compared. The resultant changes in the spectra are insignificantly small, with Li2O addition producing only an incremental shift to longer wavelengths. Spectroscopic measurements at 5 K were carried out for Tm-doped (at 1 mol%) in NT3 (80 TeO2, 10 ZnO, 9 Na2O) and NTC2 (68 TeO2, 10 ZnO, 9 Na2O, 5 Li2O, 5 K2O, 2 Bi2O3) composition and are compared with the room-temperature data in Fig. 23.
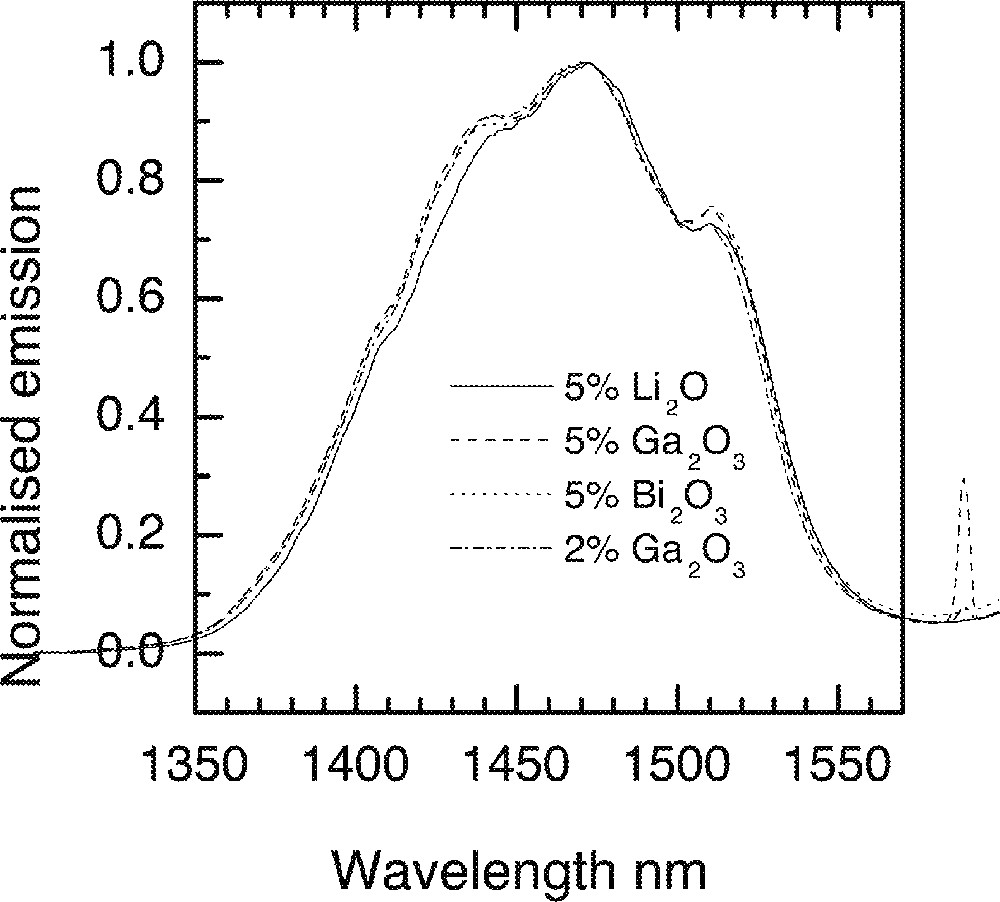
Effect of various oxides on the emission lineshapes in a TZN glass 80 TeO2–10 ZnO–(10 – x) Na2O–x RyOz (RyOz = Li2O, Ga2O3, Bi2O3).
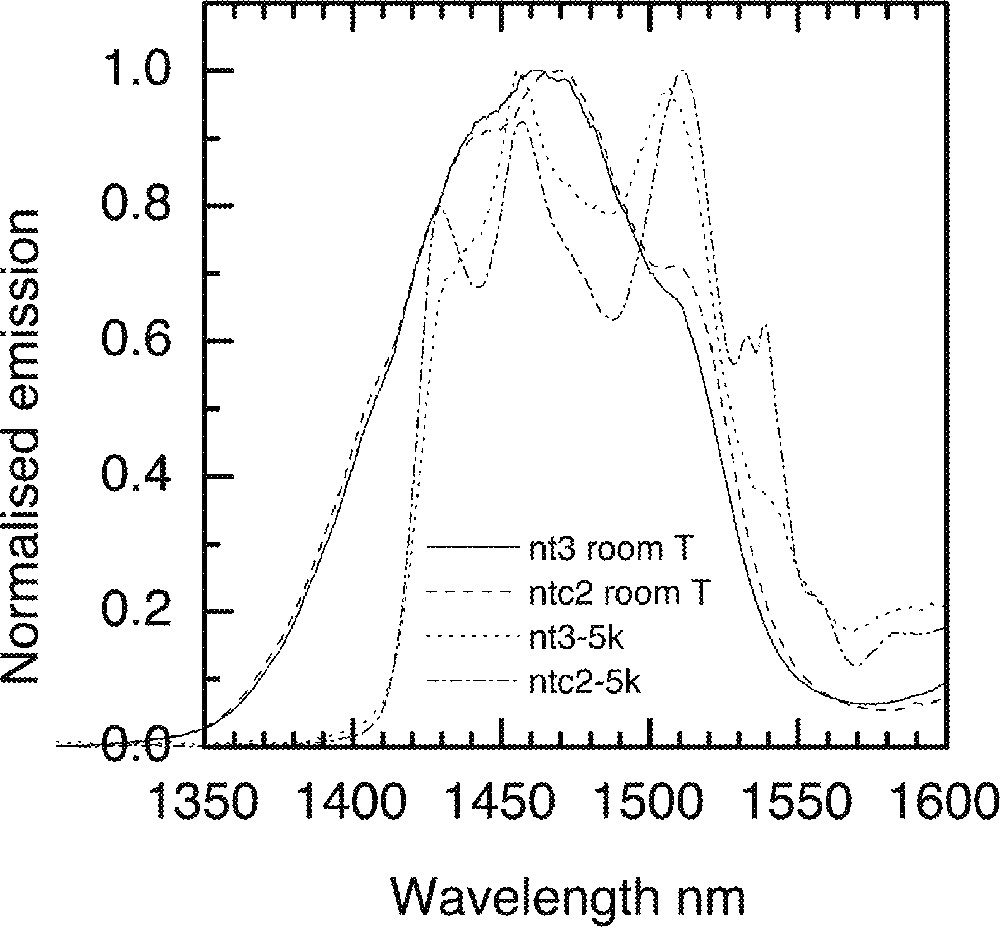
Comparison of the Tm-ion emission spectra in two different types of tellurite glasses nt3 (80 TeO2–10 Na2O–10 ZnO) and ntc2 (68 TeO2–10 Na2O–10 ZnO–5 Li2O–5 K2O–2 Bi2O3) at 5 K.
At low temperatures, the lowest Stark sublevels of the 3H4 manifold are preferentially populated. The contributions of the upper sublevels will therefore be significantly reduced from the fluorescence spectrum. As a result, the spectrum of the 3H4→3F4 transition will reveal contributions from the Stark sub-levels at 3F4 to the overall line shape at 5 K. At 5 K the short-wavelength edge of the emission spectra is shifted to longer wavelengths and is much steeper than at 293 K. The short-wavelength part of emission at 293 K is due to the transitions from the upper Stark sublevels of 3H4 to the lowest Stark sublevels of 3F4. In the absence of thermalisation of sub-levels at 5 K, some components of emission spectra disappear and only the dominant sub-levels contribute to the overall lineshape. Consequently, the low-temperature spectrum is red-shifted by approximately 20 nm; this is similar to the width of the 3H6→ 3H4 absorption line, which reflects the Stark splitting of the 3H4 level.
More significantly, the spectra at 5 K show a multiple peak structure. The peaks reveal the positions of the dominant Stark sublevels within the 3H4 manifold. While the spectrum of NT3 glass has two well-defined peaks and two shoulders, the spectrum of the NTC2 glass has four well-defined peaks. When comparing the positions of the corresponding features (peaks and shoulders) in the two spectra, it is clear that in the NTC2 glass the Stark sublevels are more widely separated than in the NT3 glass. At room temperature, this gives rise to a broader emission spectrum extending to longer wavelengths. The wider Stark splitting of Tm3+ levels in the NTC2 glass is caused by the stronger ligand field experienced by Tm3+ ions in this glass, which is due to the presence of alkali oxide network modifiers (Na2O, Li2O, K2O and Bi2O3).
From the above analysis, there is one common trend in Tm3+ emission spectral change: when Na2O or other alkali oxides replace TeO2 or ZnO, the 1.47-μm emission spectrum becomes broader and the peak shifts to longer wavelength. It should be noted by comparing the emission spectra of Er3+ in Fig. 4 with the Tm3+-ion spectra in Fig. 21a that the addition of alkali enhances the emission line shape of a Tm-doped fibre and reduces the same for an Er-doped fibre. Because Tm2O3 is less paramagnetic than Er2O3, and the 3H4→3F4 is not so strongly dependent on the angular momenta (J values) than the 4I13/2→4I15/2 transition discussed above.
3.2.2 Tm3+ concentration quenching
In order to determine the optimum doping level of Tm3+, concentration quenching in tellurite glass was investigated. A series of glasses containing different concentrations of Tm3+ were made, the emission spectra and the lifetimes of the upper lasing level were measured.
As we have seen in Er3+ doped tellurite glasses, the 1.53-μm emission spectra become broader with the increasing concentrations of ions. By comparison, the corresponding changes in the Tm3+-ion spectrum is negligible, which can be seen in Fig. 24. This observed invariance of the line shape with Tm3+ ion composition is due to the fact that the transition at 1.46 μm occurs via a 4-level transition system, unlike the 3-level system in the case of Er3+-ions at 1.53 μm, which is dominated by the signal re-absorption and re-emission. The theory of concentration quenching predicts that in the case of a two-ion process, such as that occurs between two Tm3+ ions, for example, the decay rate W will increase linearly with the square of ion concentration C:
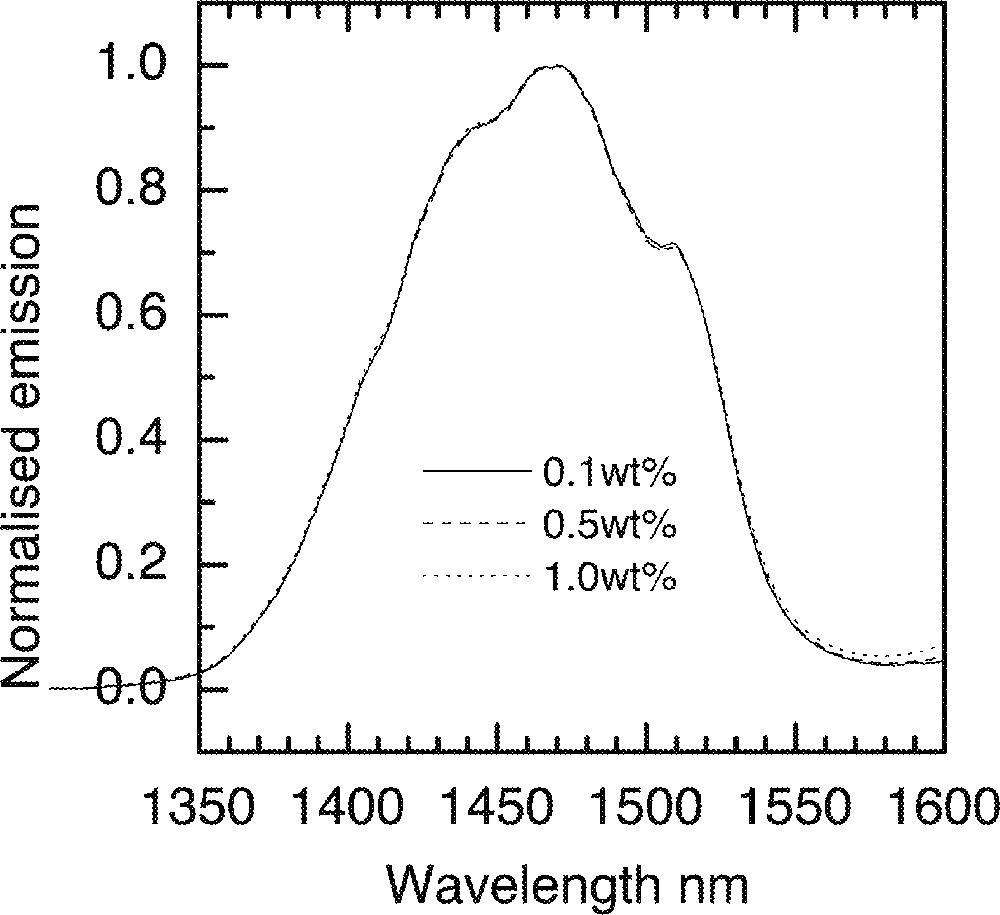
The invariance of Tm-ion emission spectra in a ntc2 glass.
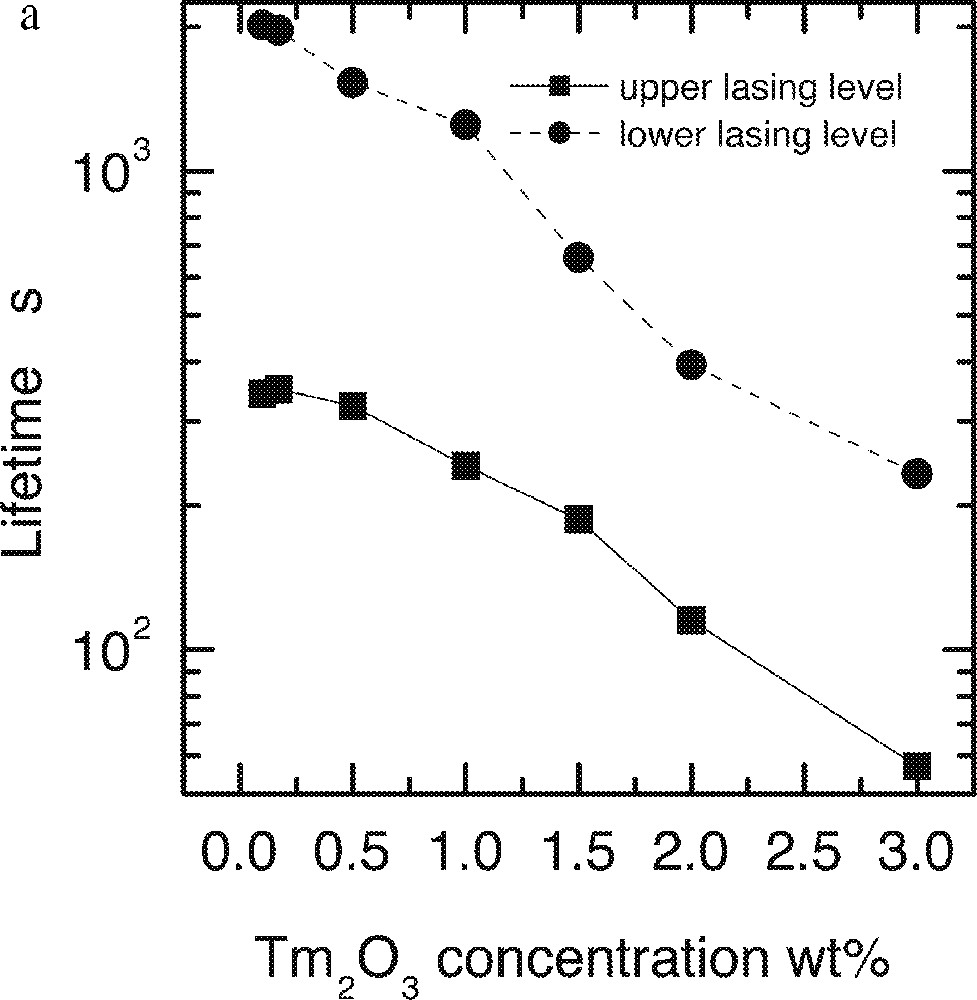
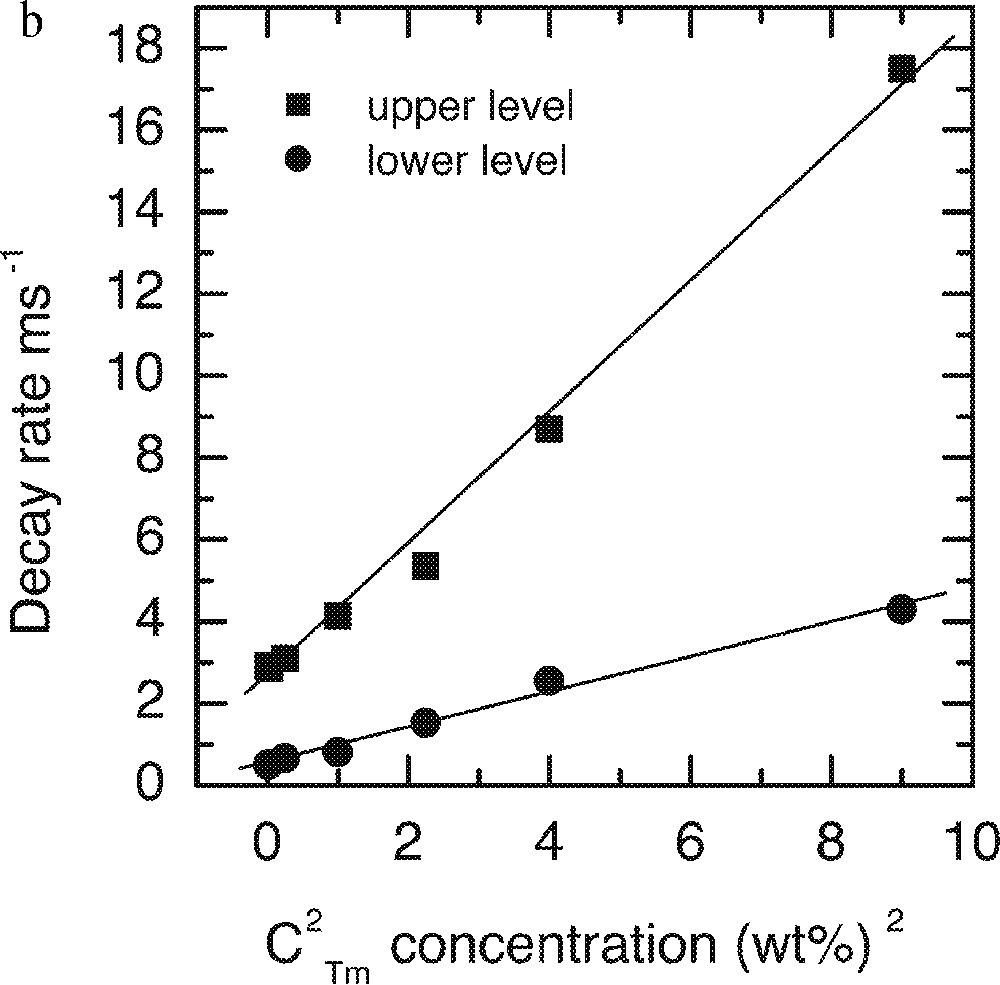
a. Dependence of the lifetimes of both upper 3H4 and lower 3F4 levels on the Tm2O3 concentrations. b. Linear fit of the decay rates on the square of Tm-ion concentration in the ntc2 glass.
It is evident that the data agrees well with the predicted behaviour, defined in equation (1). The intercept of the linear fit (W0, decay rate at zero concentration) for the upper level corresponds to lifetime of 380 μs, which is in good agreement with the value calculated by Judd–Ofelt analysis of 370 ± 20 μs 〚33〛.
These results identify the optimum doping level of Tm2O3 in the glass at around 0.5 wt%. The lasing level lifetime at this concentration is 345 μm, and the quantum efficiency is 90%.
3.2.3 Co-doping with Ho3+ and Tb3+
The lower lasing level of Tm3+ (3F4) has a lifetime of the order of ∼5.5 ms, for example in fluoride glasses, than the upper lasing level (3H4), which by comparison is of the order of 1 ms. At the optimum doping level of 0.5 wt% of Tm2O3, the lifetime of the lower lasing level is ∼1.5 ms, compared to ∼350 μs of the upper lasing level. Therefore, in order to obtain a population inversion and amplification at 1.47 μm, a mechanism must be provided for depopulating the lower lasing level. The depopulation of 3F4 level can be achieved by co-doping the glass with appropriate acceptors. There are two candidate ions: Ho3+ and Tb3+, both of which have energy levels closely resonant with the energy gap between 3F4 and 3H6 states of Tm3+.
In order to investigate the effect of Ho3+ and Tb3+ co-dopants on the upper and lower lasing levels of Tm3+, a number of glass samples were prepared. All samples were doped with 0.5 wt% of Tm2O3 and were co-doped with various levels of Ho3+ or Tb3+. Table 1 shows the lifetimes of the upper and lower lasing levels of Tm3+ in the presence of co-dopants. Both Ho3+ and Tb3+ ions decreased the lifetimes of the upper and lower levels, Tb3+ ions have much stronger effect than Ho3+ ions in both levels. Figs. 26a and 26b are the plots of the decay rates of the two lasing levels. Table 2 compares the energy levels of Ho3+ and Tb3+ in a tellurite glass. Fig. 27 explains the energy transfer processes taking place in Tm3+–Ho3+ and Tm3+–Tb3+ co-doped systems.
The lifetimes of the upper and lower lasing levels of Tm3+ in the presence of co-dopants Ho3+ or Tb3+.
| Concentration of codopant Ho3+ or Tb3+ (wt%) | Upper level 3H4 (μs) | Lower level 3F4 (μs) | ||
| Ho3+ | Tb3+ | Ho3+ | Tb3+ | |
| 0 | 323 | 323 | 1572 | 1572 |
| 0.2 | 305 | 260 | 1282 | 783 |
| 0.5 | 293 | 180 | 1051 | 373 |
| 1.0 | 267 | 116 | 780 | 254 |
| 1.5 | 256 | 100 | 707 | 202 |
| 2.0 | 243 | 62 | 701 | 138 |
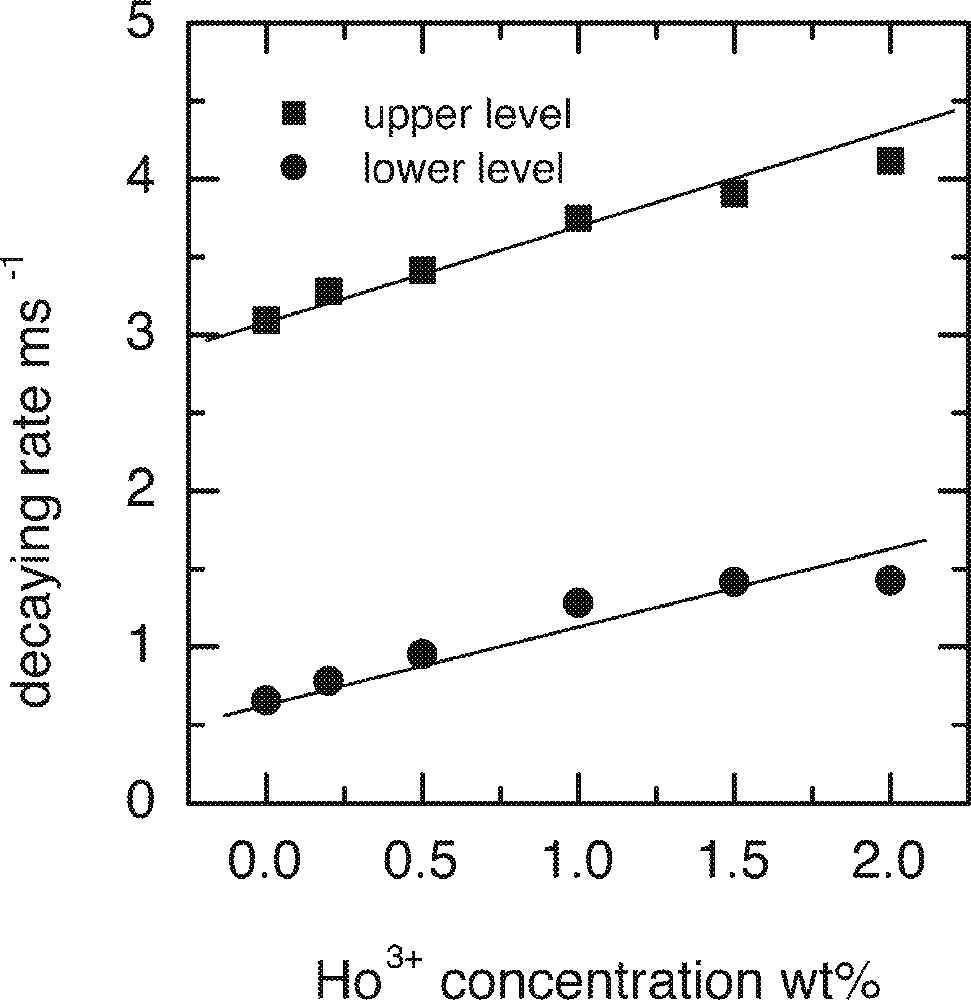
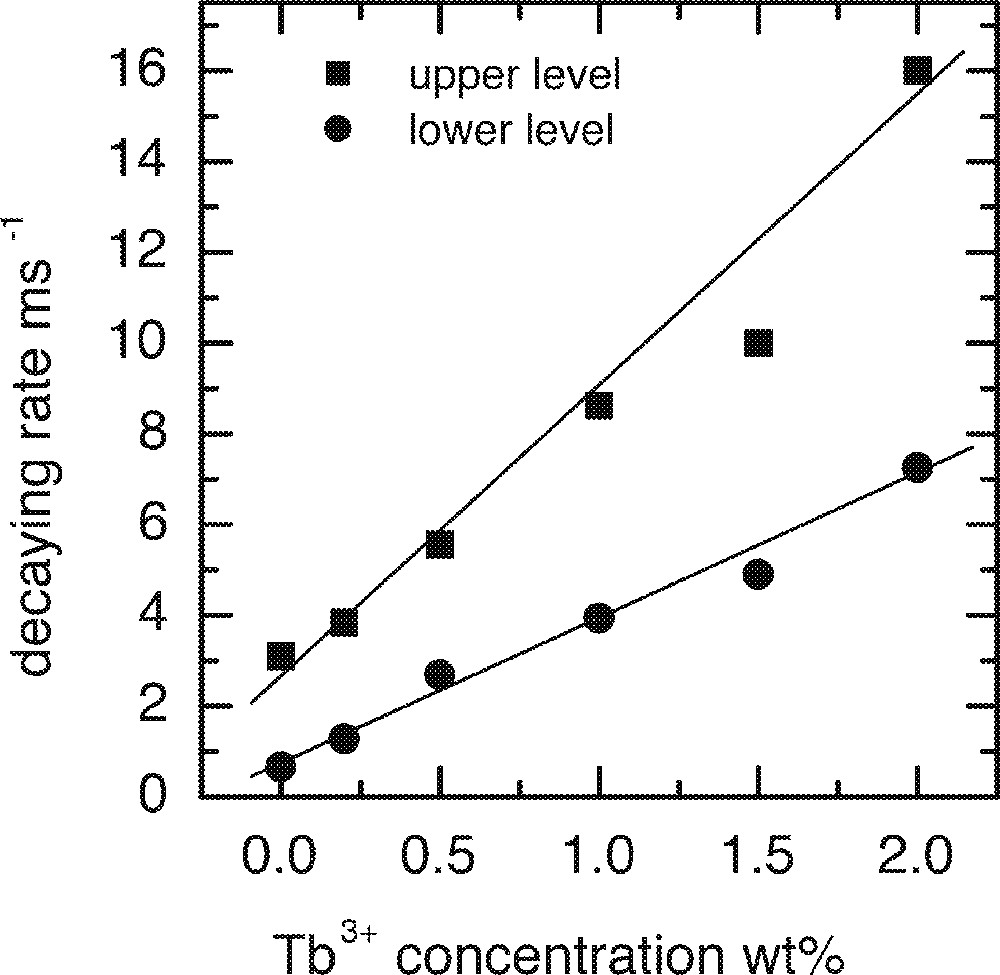
a. Dependence of the upper 3H4 and lower 3F4 levels decay rates on the concentrations of Ho3+ ion. b. Dependence of the upper 3H4 and lower 3F4 levels decay rates on the concentrations of Tb3+ ion.
Energy levels of Ho3+ and Tb3+ in an NT3 tellurite glass.
| Ho3+ | Tb3+ | ||
| level | cm–1 | level | cm–1 |
| I7 | 5120 | 7F5 | 2160 |
| I6 | 8670 | 7F4 | 3390 |
| 5I5 | 11240 | 7F3 | 4400 |
| 5I4 | 13300 | 7F2 | 5100 |
| 5F5 | 15550 | 7F1 | 5310 |
| 5S2 + 5F4 | 18550 | 7F0 | 5490 |
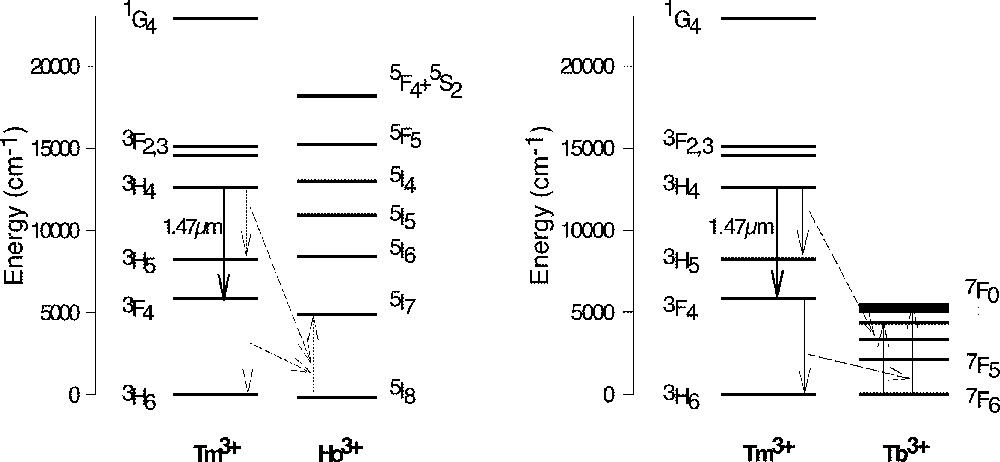
The energy levels diagram and the energy transfer process in the Tm3+–Ho3+ and Tm3+–Tb3+ systems.
In the case of Ho3+ as the acceptor ion, the lifetime at 3F4 level of Tm3+ is quenched by promoting a Ho3+ ion to the 5I7 level. The decay of this level is predominantly radiative (at ∼2.1 μm), due to a large energy gap to the ground state (5120 cm–1, corresponding to six phonons). The radiative lifetime is relatively long, of the order of a few milliseconds. Therefore, in an amplifier device, the slow decay of the acceptor may contribute to the bottleneck at the lower lasing level. As can be seen in Fig. 28, there is a significant energy mismatch between the donor and acceptor levels (5880 and 5120 cm–1, respectively), requiring the creation of a phonon, which acts to reduce the energy transfer rate. However, the energy difference is positive (Stokes), i.e. the energy gap between the 3F4–3H6 (Tm3+) levels is larger than that between the 5I8–5I7 (Ho3+) levels (see above), which makes possible a relatively fast transfer rate. The upper lasing level of Tm3+ is also quenched by the same Ho3+ transition (see Fig. 27). However, the transfer rate in this process is much slower. This is due to the fact that the energy difference is negative (anti-Stokes), i.e. the 3H4–3H5 (Tm3+) energy gap is smaller than the 5I8–5I7 (Ho3+) energy gap (4360 cm–1 and 5120 cm–1, respectively), which requires phonon absorption rather than creation. The energy transfer rate in this process is consequently much slower. This explains the relative ineffectiveness of Ho3+ in quenching the upper lasing level of Tm3+ (see lifetime in Table 1).
A comparison of the Nd-ion emission spectra in TZN tellurite and a silicate glass (50 SiO2, 5 Al2O3, 30 PbO, 14.5 Na2O, 0.5 Nd2O3).
In the case of Tb3+ acceptor, the lifetime of the 3F4 level of Tm3+ is quenched by promoting a Tb3+ ion to the 7F0 level. The energy mismatch is positive (Stokes) and smaller than in the case of Ho3+ (390 cm–1), giving rise to a faster transfer rate. The 7F0 level decays non-radiatively, and extremely rapidly (< 1 μs), to the ground state, via a cascade of non-radiative decay due to the series of underlying levels with small energy gaps between them (see Fig. 27). These properties make Tb3+ a highly efficient acceptor for the 3F4 level of Tm3+. The upper lasing level of Tm3+ is quenched via the process 3H4–3H5 (Tm3+)→7F6–7F3 (Tb3+). In this case, unlike Ho3+, the two energy gaps are almost equal (4360 and 4400 cm–1 respectively), leading to increased transfer rate. This explains the strong quenching effect of Tb3+ on the upper lasing level of Tm3+ (see lifetime in Table 1). However, it is important to emphasise that in a tellurite-glass host the quenching of the upper lasing level appears to be much slower than in fluorozirconate glass 〚30〛, while the quenching of the lower lasing level remains extremely efficient, making it possible to use the Tb3+ co-dopant in low concentrations to effectively achieve the desired purpose.
The straight line fits to the data in Figs 26a and 26b represent the diffusion-limited energy transfer equation:
Fitting parameters for concentration quenching (equation (1)) and energy transfer (equation (2)) equations used for the Tm3+-doped, Tm3+-Ho3+, and Tb3+-Tm3+ co-doped glasses.
| Transitions | Linear fit for equation | W0 (ms–1) | U or A (ms–1 wt–2) |
| Upper lasing level (3H4) in Tm3+-doped tellurite glass | equation (1) | 2.52 ± 0.23 | U = 1.62 ± 0.06 |
| Lower lasing level (3F4) in Tm3+-doped tellurite glass | equation (1) | 0.53 ± 0.08 | U = 0.43 ± 0.02 |
| Upper lasing level (3H4) in Ho3+–Tm3+-doped tellurite glass | equation (2) | 3.16 ±0.30 | A = 0.50 ± 0.03 |
| Lower lasing level (3F4) in Ho3+–Tm3+-doped tellurite glass | equation (2) | 0.73 ± 0.07 | A = 0.41 ± 0.07 |
| Upper lasing level (3H4) in Tb3+–Tm3+-doped tellurite glass | equation (2) | 2.62 ± 0.50 | A = 6.04 ± 0.60 |
| Lower lasing level (3F4) in Tb3+–Tm3+ doped tellurite glass | equation (2) | 0.75 ± 0.20 | A = 3.11 ± 0.20 |
From these results, it can be concluded that Tb3+ has a much stronger quenching effect on the upper lasing level of Tm3+ than does Ho3+. However, the measurement of lifetimes of lower lasing level demonstrate that Tb3+ is also a much more efficient acceptor for the lower lasing level. The combined results indicate that the Tb3+ co-dopant can be used effectively at concentrations in the 0.2–0.5 wt% range, although a significant lowering of the quantum efficiency must be accepted.
3.3 Photoluminescence at 1340 nm in Nd3+-doped glasses
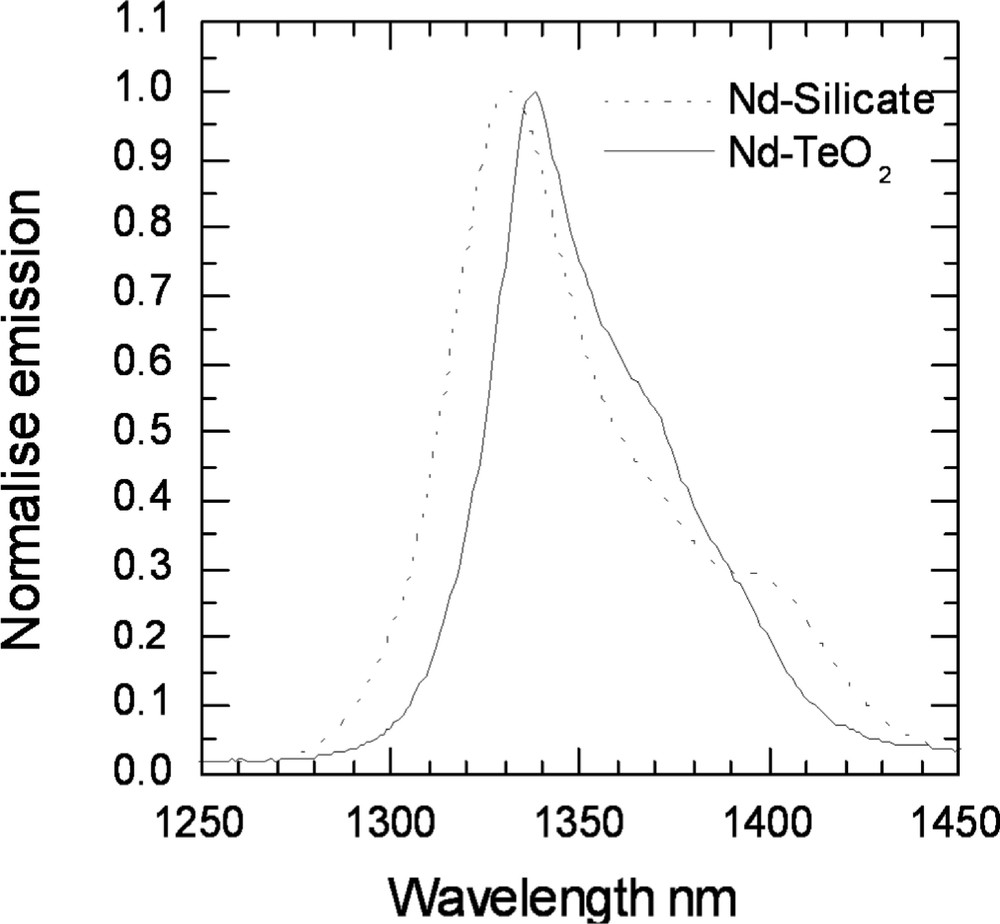
The amplifier bandwidth can be further extended to shorter wavelengths by adding a Nd3+-doped tellurite glass module operating around 1340 nm. Over the years, a variety of Nd3+-doped glasses have been investigated as hosts for a 1.3-μm fibre amplifier 〚34–36〛. Although the Nd3+ amplifier is highly efficient, the difficulty was to obtain gain below 1320 nm. Recently, the gain at 1310–1360 nm was demonstrated in fluoroaluminate glass 〚34, 35〛. Nd3+ experiences a strong nephelauxetic shift 〚34〛, as a result, in tellurite glass the Nd3+ emission peak is red-shifted to 1340 nm. In fibre geometry, the 1.3-μm amplifying transition of Nd3+ suffers from the competition with amplified spontaneous emission (ASE) at 1.1 μm. Several methods of ASE filtering have been developed 〚34〛, and are applicable to tellurite fibres. Nd3+ doped tellurite glass fibre can therefore serve the purpose for amplifiers in the 1310–1350 nm range. TZN tellurite glass was investigated as host for a Nd3+-doped amplifier. Fig. 28 compares the emission spectra of Nd3+ for 4F3/2→4I13/2 transition in silicate and tellurite glasses. The emission curve in tellurite glass is red-shifted compared to silicate, whereas in the AlF3-based glass, it is centred on 1317 nm. Table 4 compares the spectroscopic parameters of Nd3+ in tellurite and silicate glasses 〚34〛. A silicate glass was also chosen for comparison, because it has the longest emission wavelength of all investigated (non-tellurite) glasses, and it could prove to be potentially the most preferred host for a commercial device. The high refractive index of tellurite glass causes the emission cross-section of Nd3+ to be larger and the lifetime shorter than in silicates. As a result, the FOM for gain is 35% lower in tellurite than in silicate. In contrast with Tm3+ and Er3+, the width of Nd3+ emission does not increase in the TZN tellurite glass and is similar to that observed for a silicate. The FOM for bandwidth nevertheless benefits from the increased cross-section, and is 50% larger in tellurite than in silicate. However, the advantages of Nd3+-doped tellurite glass as compared to silicate are not as great as in the case of Tm3+ and Er3+, primarily because its emission profile does not change significantly.
Emission properties of Nd-doped TZN and silicate glasses.
| Properties | TZN | Silicate 〚18a〛 |
| Peak emission wavelength (nm) | 1337 ± 1 | 1334 ± 1 |
| FWHM of emission (nm) | 51 ± 1 | 54 ± 1 |
| Fluorescence lifetime (μs) | 200 ± 5 | 436 ± 5 |
| Stimulated emission cross-section σse (pm2) | 0.98 ± 0.05 | 0.62 ± 0.05 |
| FOM gain, σse × τ | 196 ± 10 | 270 ± 10 |
| FOM bandwidth, σse × FWHM | 50 ± 5 | 33 ± 3 |
From the emission spectrum and comparison with silicate glass, a Nd3+-doped amplifier operating around 1.34 μm is clearly desirable in TZN tellurite glass, since it would complement Tm3+ and Er3+ devices in increasing further the available bandwidth. Fig. 29 shows the normalised emission spectra in three different types of TZN tellurite glasses and fibres singly-doped with Nd3+, Tm3+ and Er3+ ions. A continuous gain band extending from 1340 to 1620 nm may becomes possible by using Nd3+, Tm3+ and Er3+ amplifiers. The signal excited state absorption (ESA) between 4F3/2 and 4G7/2 is critical for its useful application, which will eliminate potential gain in much of the short wavelength region below 1360 nm in all silicate glasses. Although the ESA has not been measured in these glasses in the present investigation, by making comparison with the results presented elsewhere for fluoride glass hosts and fibres 〚34, 36〛, the emission peak in tellurite, as expected, shifts more towards the longer wavelength than silicates. However, more work is required to determine whether the TZN tellurite glass is the most advantageous host for such a device.
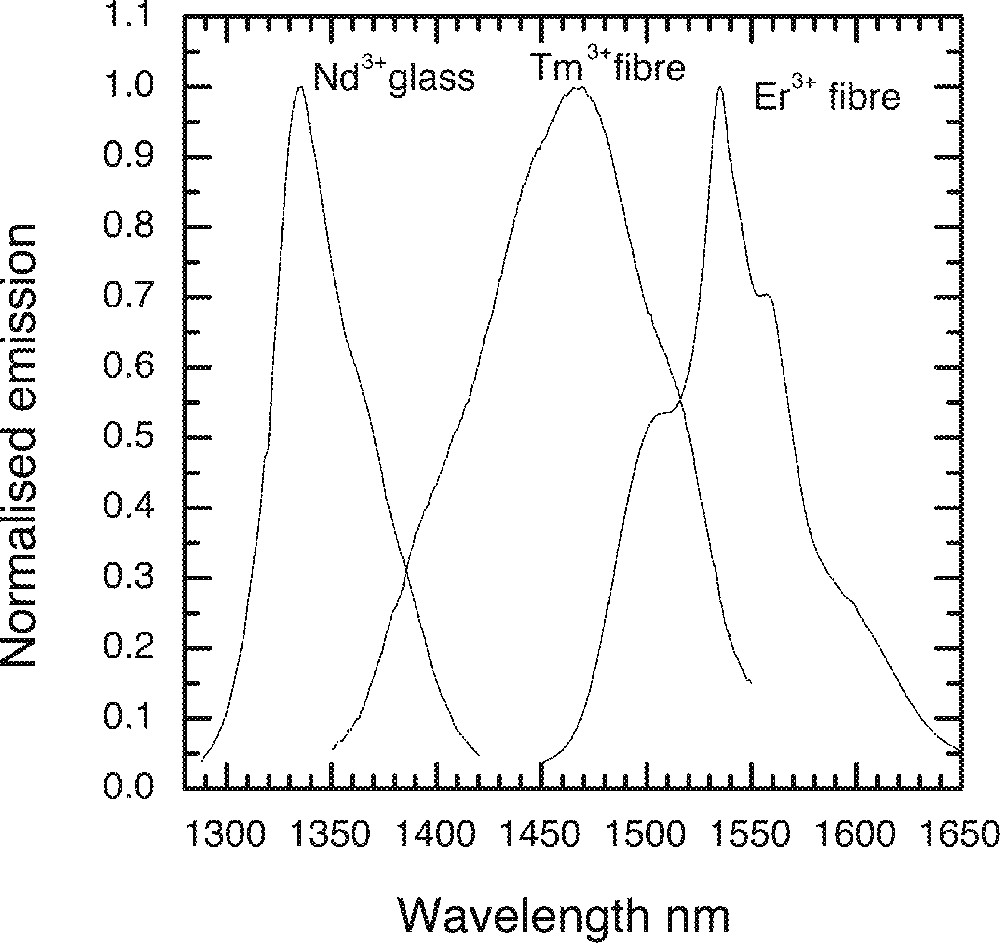
Normalised emission spectra of Nd3+, Tm3+ and Er3+ ion in the TZN tellurite glass and single-mode fibres.
4 Conclusions
1. In the TeO2–ZnO–Na2O ternary glass system, the 4I13/2 → 4I15/2 transition in Er is sensitive to a composition change. As Na2O replaces ZnO or TeO2, the Er3+ ion absorption cross-sections and the absorption peak ratio reduce in strength and the emission spectra become narrower. The effect of alkali ions on the emission spectra were measured, and it was observed that the absorption and the emission cross-sections respectively increased with as the molar mass of alkali oxide decreased. The observed increase arises as a consequence of a net increase in the paramagnetic susceptibility of the ligand field (dipole) environment around Er-ions. The emission spectrum was found to be insensitive with the increase in the concentrations of ZnO in the glass.
2. In a TZN tellurite glass doped with different concentrations of Er2O3, the lifetimes of 4I13/2 level increased with the increasing Er2O3 concentration up to 11 000 ppmw, beyond which the values of lifetimes gradually decreased with the increasing Er2O3 concentration. The corresponding line shape of the emission curve with a peak at 1530 nm also increased with the concentrations. The presence of OH– ions in the glass adversely affects the device performance by shortening the lifetime of 4I13/2 level.
3. In the Tm3+-doped TeO2–ZnO–Na2O ternary glass system, when Na2O or other alkali oxides replace TeO2 or ZnO, the 1.47-μm emission spectrum becomes broader and the peak shifts to longer wavelengths.
4. There is no effect of Tm3+ concentrations on the line shape of the emission spectrum at 1.47 μm. The lifetimes of both upper 3H4 and lower 3F4 levels decrease as the ion concentration increases.
5. At 5 K, the emission spectra of Er3+ and Tm3+ exhibit multiple peaks. The overall peak also shifts to longer wavelength at the expense of the disappearance of the peaks at short wavelength due to the absence of the Boltzmann thermalisation process.
6. Both Ho3+ and Tb3+ ions reduce the lifetimes of the upper and lower lasing levels of Tm3+ ions, with Tb3+ ions proving more effective than the effects observed for Ho3+-ions. The co-dopant effects in Tm3+-doped glass point out that the Tb3+ ions can be used effectively at concentrations in the 0.2–0.5 wt% range for removing the bottleneck due to the long lifetime of the 3F4 level in the amplifier.
7. A Nd3+-doped amplifier operating around 1.34 μm is clearly desirable in the TZN tellurite glass, which would provide amplification in the wavelength regions between the 2nd and 3rd telecom windows, thereby yielding a continuous gain band extending from 1340 to 1620 nm, may by combining the cascaded configuration of Nd3+, Tm3+ and Er3+ singly-doped amplifier devices.
Acknowledgements
The authors acknowledge the help provided by Dr. Jens Kobleke of IPHT, Jena in Germany for determining the attenuation in the single-mode Er-doped tellurite fibres. The academic link with IPHT at Jena was supported by the ARC-British Council Programme. AJ and SS also acknowledge the financial support from NORTEL Networks at Harlow and the financial support from the EPSRC Grants GR/M19597 and GR/R31454.