

1 Introduction
To transmit infrared light, glasses need to be low phonons materials, in others words, made from combinations of heavy elements, such as halogens or chalcogens, which exhibit vibrational modes in the low-energy part of the spectrum. While silica glasses have their phonon energy in the 1100 cm–1 region with an IR cut-off located around 2 to 3 μm, non-oxide glasses can extend their transmitting window much further in the infrared, for instance to the 20-μm region with the glasses of the Te/I system 〚1〛. The negative side of these low-phonon glasses is that the IR transparency is realised at the expense of the thermal and mechanical properties, which sometimes forbids any practical applications. Also, these out-of-equilibrium solids suffer from a tendency to crystallisation or molecular bubbles formation, which severely shortens their optical interest.
The strategic domains in the mid-IR are located in the two atmospheric windows 3–5- and 8–12-μm, where thermal imaging operations are realised, but also in regions where the infrared signatures of functional groups present in most of the molecules are located 〚2〛. Recording the fingerprints of different molecular species, in situ, is then of major importance to follow a chemical or biochemical reaction, especially when the collection of the infrared spectrum can be realised in remote conditions. Fibre-Evanescent Wave Spectroscopy (FEWS) is based on the absorption of the photons present at the surface of an optical fibre due to internal reflections. In the case of an IR-transmitting waveguide, such as a chalcogenide glass fibre, the spectral range of the light carried into the fibre can cover a wavelength domain lying from 2 to 12 μm, with an attenuation close to 1 dB m–1 〚3〛. It is also demonstrated that the percentage of the evanescent light circulating on the skin of the fibre and being into contact with all kind of materials is inversely proportional to the diameter of the fibre 〚4〛.
Taking into account the parameters discussed above, the selection of the glass is a compromise between a large transmitting domain and acceptable thermal and mechanical properties. In addition, one of the ways to taper the fibre, in order to increase the sensitivity of the sensing zone, is to use a chemical etching process, which permits the congruent dissolution of the glass. All these specifications are reasonably satisfied by glasses belonging to the Te/As/Se system.
In order to test the efficiency of this original in-situ IR spectroscopy using infrared chalcogenide fibres, two kinds of reactions, belonging respectively to a fermentation process encountered in the cider industry and to a bacterial biofilm formation, have been investigated. It is indeed of critical interest to investigate, in situ, the transformation of sugars into ethanol in order to control the mechanisms of the cider fabrication as well as to follow the evolution of complex biological systems represented for instance by the growth and behaviour of bacterial colonies such as the uropathogenic Proteus Mirabilis used as a model.
2 The design of the IR glass fibre
In a recent paper 〚5〛, we presented and discussed the methodology for tapering fibres using a chemical etching process. In this contribution, more details are given in order to produce an optimised sensing system. The so-called TAS glass has a composition Te2As3Se5 and fibres are produced following purification and preform fabrication procedure, as well as a drawing technique already described 〚3, 6〛.
The experimental procedure used for etching the glass surface must allow us to control the homogeneous decrease of the fibre diameter along a short zone, which will be the sensing part of the fibre. In a first step, the fibre is mechanically tapered, modifying the temperature and fibring speed during the preform drawing. In a given experimental condition, the longitudinal profile of the fibre corresponds, for instance, to a variation of the diameter as follows: 450/200/450 μm. The portion corresponding to the diameter 200 μm is about few ten centimetres. The 450-μm diameter of the input and output part of the guide is a compromise giving enough flexibility to the system and allowing correct light injection into the fibre as well as a good interface with the IR detector.
The second step of the procedure, described in Fig. 1, consists in a chemical etching treatment, realised on the pre-tapered portion of the fibre in order to reduce the diameter below 200 μm.
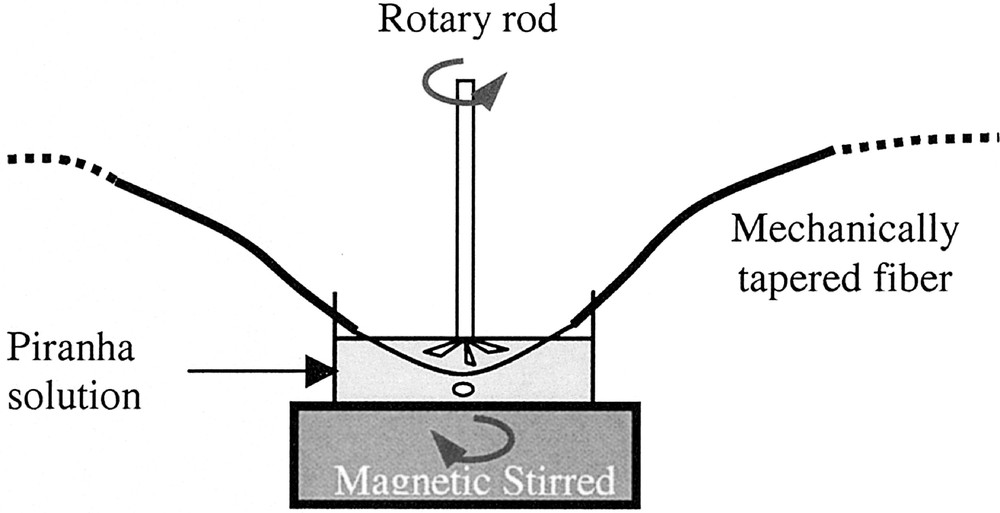
Experimental set-up for chemically tapering of a TAS fibre.
The solution used to congruently dissolve the TAS glass is a so-called Piranha solution having the composition, 95% concentrated H2SO4 + 5% H2O2.
The dissolution mechanism, in these very strong oxidising conditions, corresponds to the transformation of the elements present in the glass into arseniate, tellurate, and seleniate anions.
The second benefit of this etching process results in a chemical polishing of the glass, leading to high optical quality, shiny surfaces.
In order to ensure a homogeneous etching, the solution needs to be stirred, as indicated in Fig. 1. The order of magnitude of the dissolution kinetic corresponds to a diameter decrease of 5 μm min–1. As a consequence of these observations, a typical result is as follows: before the etching treatment, the fibre diameter variation is 450/200/450 μm, while after the congruent dissolution, the diameters have changed to 450/40/450 μm for a polishing time of 33 min.
3 The optical transmission domain of the tapered optical fibre: the CHCl3 spectrum
As discussed in previous papers 〚3, 7〛, the set-up used for fibre evanescent wave spectroscopy (FEWS), shown in Fig. 2, consists of an infrared transmitting fibre coupled with a FTIR spectrometer and a MCT (mercury–cadmium–tellurium) infrared detector optimised for having a maximum sensitivity in the 3–13-μm region.
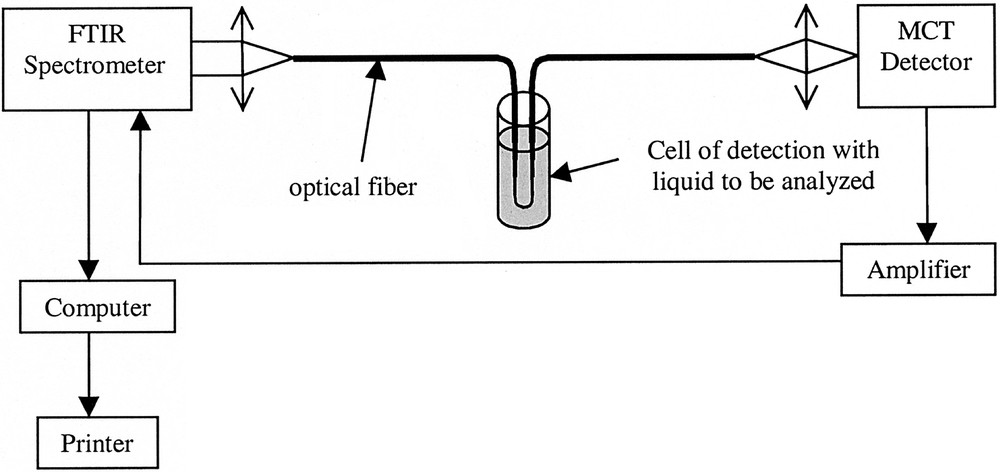
Experimental set-up for evanescent wave spectroscopy.
The low loss region of the TAS glass fibre is in the 8–9-μm region and it was interesting to evaluate the detection limit of the FEWS method, not only in term of sensitivity in the high transparency window, but also at the edge of the transmission domain of the fibre, around 12–13 μm, where the multi-phonon absorption becomes dominant.
A solution of chloroform CHCl3 has been selected, as a test, because of the richness of the spectrum in the low phonon part of the spectrum due to the presence of the heavy chlorine atoms. Fig. 3 represents the transmission spectrum recorded with a tapered fibre having a diameter of 40 μm in the sensing zone. The contact length between the liquid and the fibre immersed in the CHCl3 solution is 4 cm.
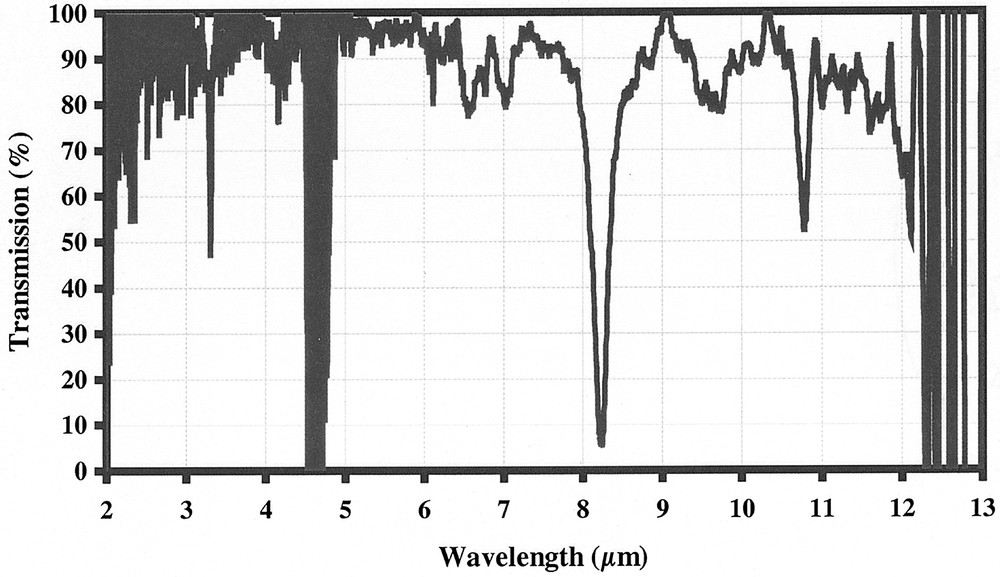
Fibre evanescent wave spectrum of chloroform.
The analysis of the spectrum leads to several remarks:
- • (a) the main absorption infrared signatures of the chloroform molecules are easily identified, especially in the 6- to 11-μm region;
- • (b) the 4.5-μm region contains a strong absorption peak due to hydrogen impurities present in the glass and, despite severe purification operations; it is impossible to eliminate this very strong H–Se bond;
- • (c) the near-infrared region around 3 μm corresponds to the beginning of the detection and is limited both by the transmission of the fibre and the sensitivity of the detector;
- • (d) more interesting is the low phonon part of the spectrum, which indicates that absorption peaks could be detected until 12 μm, where is located the transmission limit of the fibre, dominated, besides, by strong multi-phonon absorbing bands – it must be noticed that, in this typical FEWS experiment, the total fibre length was about 2 m.
4 Remote, in-situ, analysis of cider fermentation
It is well known that the alcoholic fermentation in the cider fabrication process comes from the transformation or several sugars such as fructose, saccharose and glucose present in different proportions in apples, and which varies according to the apple type. In our experiment the apple type is denominated ‘Guillevic’.
Samples have been analysed after 0, 5, 11, 25, 37, 60 days of fermentation. The IR spectrometer was a Bruker Vector 22 equipped with a MCT detector. The fibre was a TAS glass fibre of 1.8-m length, coated with a polymer, tapered to a diameter of 100 μm and treated by a solvent to dissolve the polymer coating in the sensing zone.
Fig. 4 shows the evolution of the infrared spectra of the cider solution in the mid-IR region. For clarity, only the fermentation time 0, 25, 60 days are represented. Despite some overlaps between the absorption bands of the sugars and ethanol, it is clear that some absorption bands such as the peaks at 1045 cm–1 and 1085 cm–1, characteristic of alcohol, increase at the expenses of the peaks at 1033 cm–1 and 1063 cm–1, due to glucose and fructose, respectively.
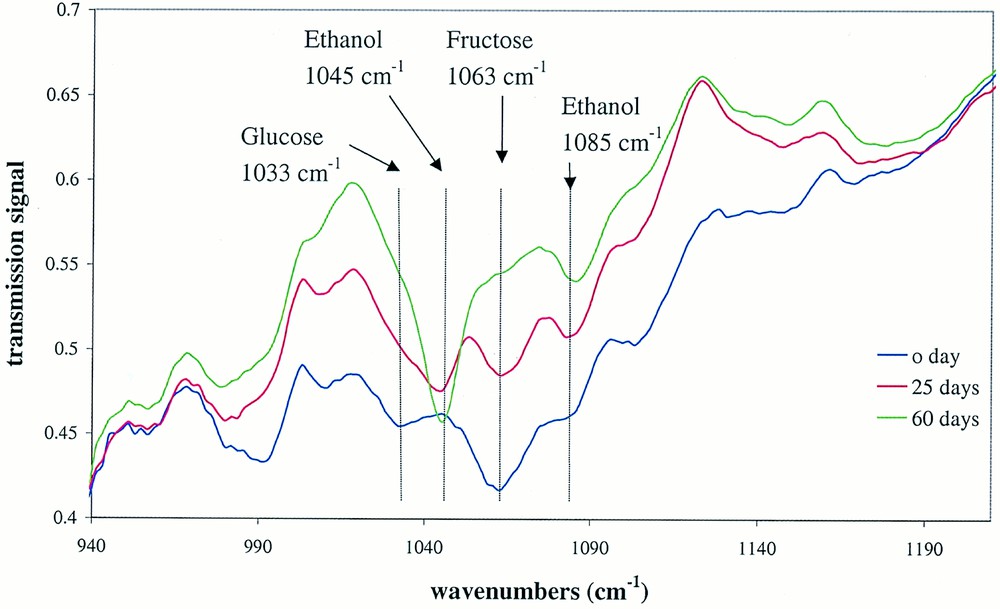
Evolution of the absorption band intensities during the fermentation process.
Table 1 represents the evolution of the density of the cider from the beginning of the fermentation to the end after two months. From the density, it is possible to calculate the sugar concentration, for example about 123 g l–1 for the apple juices at the beginning of the process and then the percentage of alcohol formation.
Evolution of the sugar concentration and alcohol percentage calculated from the measured densities of the cider.
| Apples Guillevic | |||
| Time (j) | Density (g l–l) | Sugar (g l–l) | %vol. alcohol (degrees) |
| 0.02 | 1061.53 | 123.06 | 0 |
| 4.71 | 1058.65 | 117.3 | 0.36 |
| 10.9 | 1051.09 | 102.18 | 1.3 |
| 24.92 | 1037.48 | 74.96 | 3 |
| 36.81 | 1028.12 | 56.24 | 4.18 |
| 59.81 | 1015.63 | 31.26 | 5.74 |
Fig. 5 represents the evolution of the intensity of the alcohol absorption peaks and the alcoholic percentage, in volume, versus the fermentation time. Fig. 6 shows the variation of the absorption peaks intensity, characteristic of fructose, as well as its concentration in the solution versus time.
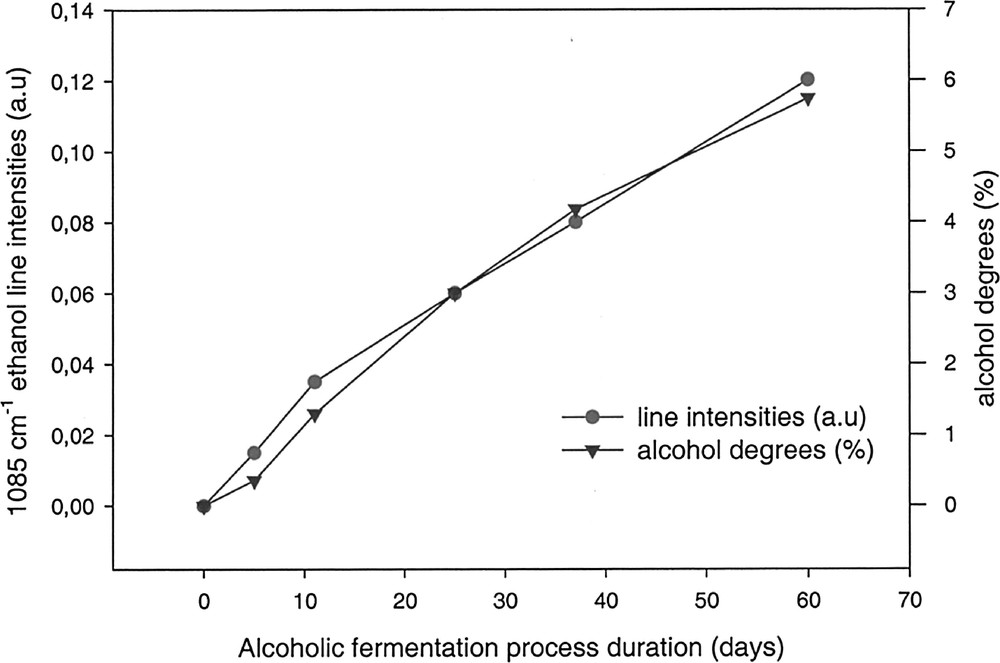
Evolution of the calculated alcohol percentages (Table 1) compared to alcohol absorption peak intensities (1085 cm–1).
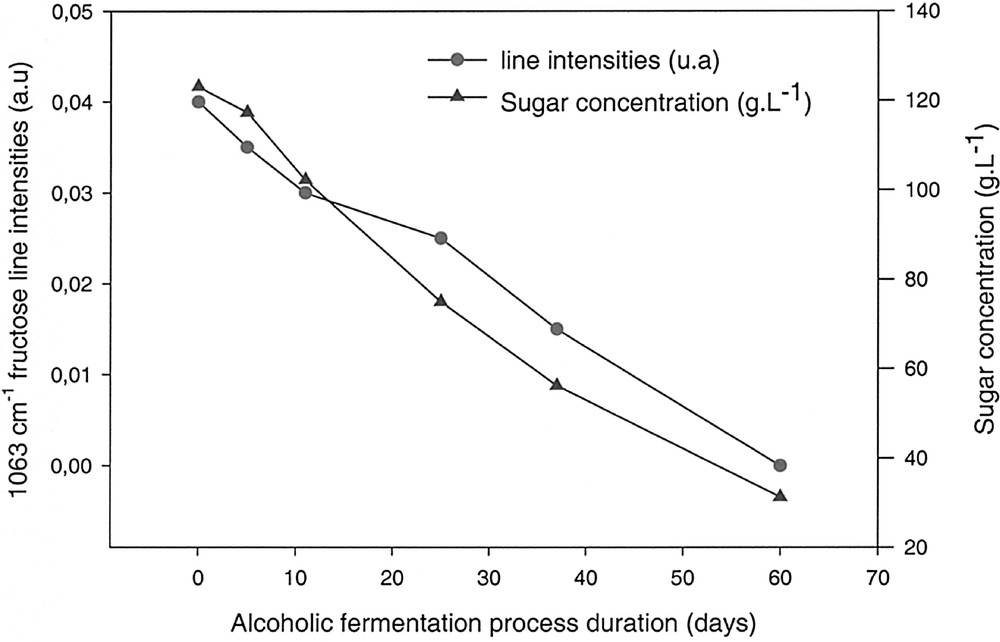
Comparison between the calculated sugar concentration (Table 1) and the fructose absorption peak intensities.
In both cases, it is clear that the variation of the peak intensities is in good agreement with the calculated values of sugars and alcohol. These preliminary results demonstrate that it is possible to evaluate in situ, inside a fermentation vessel, the evolution of a fermentation process. The richness of the information contained in the infrared spectra might permit, beside the fast estimation of alcoholic percentage, to follow more complex reaction mechanisms, due to additives, temperature, etc.
5 Biofilm detection and monitoring
A bacterial biofilm behaves as an entity in which biochemical modifications occur in a concerted manner. Hence, the growth and behaviour of individual cells become correlated in time and space to those of the whole population, which can be considered as a multicellular organism 〚8, 9〛. Bacterial colonies are experimental systems of choice for studying fundamental problems of self-organisation and pattern formation by complex biological systems. Such co-ordinated multicellular behaviours are particularly well exemplified by bacterial swarming, which is a form of active surface motility widespread among flagellated, Gram-negative bacteria 〚10–12〛. We used the uropathogenic Proteus mirabilis as a model since it is one of the bacteria exhibiting the strongest swarming abilities. From a central inoculum, a P. mirabilis colony is able to spread over the entire surface of a Petri plate within a few hours, by alternating periods of active mass migration and of cell division without colony expansion (consolidation) 〚12–15〛. Swarmer cells, contrarily to vegetative bacteria, are differentiated as elongated, multinucleate, nonseptate, and hyperflagellated cells. As the differentiated cells display enhanced properties of invasion of human urothelial cells and of production of a number of virulence factors 〚16–19〛, it is likely that the swarming behaviour does not constitute a laboratory artefact, but is essential to P. mirabilis pathogenicity and warrants for its ability to colonise urinary tracts 〚19〛 or to block catheters with crystalline biofilms 〚20〛. As a result of this periodicity and of the cell co-ordination, the final colony displays a concentric ring pattern. The colony is encapsulated into an extra-cellular slime, which is a complex mixture including polysaccharides, surfactants, proteins and peptides. The slime acts as a surface lubricant, provides an aqueous environment allowing flagella rotation, and is likely involved in cell–cell communications 〚21〛.
FEWS spectroscopy was used for studying, in situ and non-invasively, the swarming of P. mirabilis. The TAS fibre was used to detect and monitor the biofilm’s development on an agar gelose substratum. An IR spectrum was collected every 15 min for 4 h to resolve the time course of biochemical events linked to the mass migration. As seen from Fig. 7, the experimental design merely consists in placing the U-turn of the fibre’s sensing zone in contact with the gelose and in recording before, while and after the periphery of the biofilm has reached it. This results in collecting data at a fixed location at various times during the biofilm’s extension, allowing hence to observe the ‘ageing’ of the biofilm, as the monitored spot progressively moves away from the periphery. Hence the very first IR spectra reflect the gelose substratum (dominated by water absorption), then the IR spectra of swarming differentiated bacteria, and later the dedifferentiating bacteria during the consolidation phase.
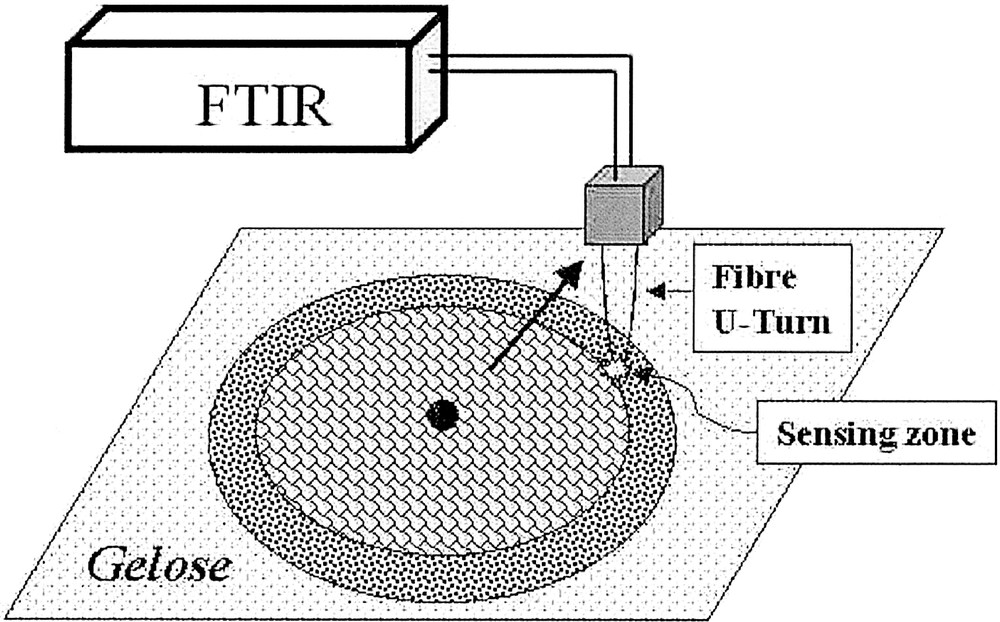
The experimental design for biofilm monitoring is sketched. The scheme shows the fibre’s sensing zone after the periphery of the biofilm has passed beyond it. The rings feature the terraces associated to the periodicity of the swarming process, the black spot the initial inoculum and the arrow the direction of radial migration.
Fig. 8 displays P. mirabilis IR spectra in the 1800–850-cm–1 frequency domain as a function of time. This domain is dominated by the water bending mode (1636 cm–1), the amide I (1650 cm–1) and amide II (1550 cm–1) bands arising from proteins peptide bonds. Indeed, as the biomass increases, the 1636-cm–1 component vanishes at the expense of the amide I mode. Drastic alterations of the IR spectra were observed during the swarming process in the 1200–1000-cm–1 frequency domain. A large frequency upshift from 1068 to 1082 cm–1 was observed. This frequency domain is mainly assigned to carbohydrate backbones present in polysaccharides. This time-dependent frequency upshift is more obvious when one considers second derivative spectra (Fig. 9). It is shown that the frequency shift occurs at ca 2 mm from the periphery, indicating that swarmer cells are characterised by a band at 1068 cm–1, which is progressively replaced by a band at 1082 cm–1 as bacteria enters the consolidation phase. Indeed, Gram-negative bacteria possess an outer membrane, in addition to the cytoplasmic one. The external leaflet of the asymmetric outer membrane is generally composed of only one type of amphipatic molecules, the lipopolysaccharides (LPS) 〚22, 23〛. Exopolysaccharides (EPS, also designated CPS for capsular polysaccharides) are the major components of the slime and present a high chemical similarity to the polysaccharide part of LPS. Even though it is not possible to distinguish EPS from LPS after their respective IR spectra, the observed upshift in the region assigned to the sugar backbone vibrations likely arises from an alteration in the EPS synthesis, in relation to the migration/consolidation phases alternation.
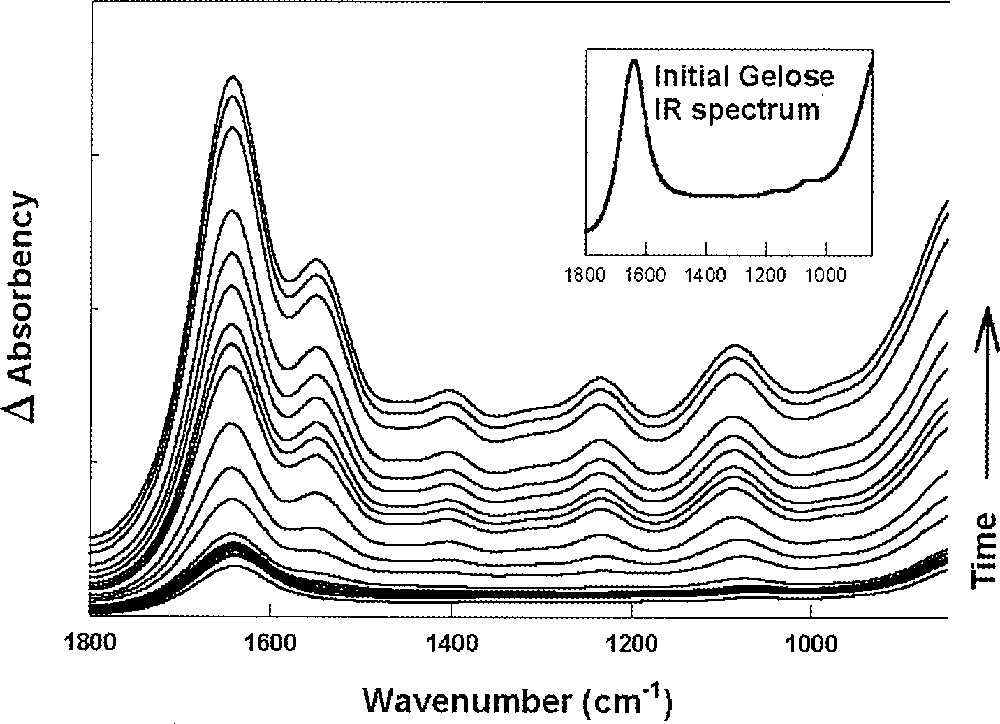
Differential FEWS spectra are displayed as a function of time (see text). Every spectrum was subtracted from the first spectrum featuring the ‘naked’ gelose substratum whose spectrum is shown in the inset. Since spectra are not offset, increased absorbencies do reflect the increasing biomass as a function of time.
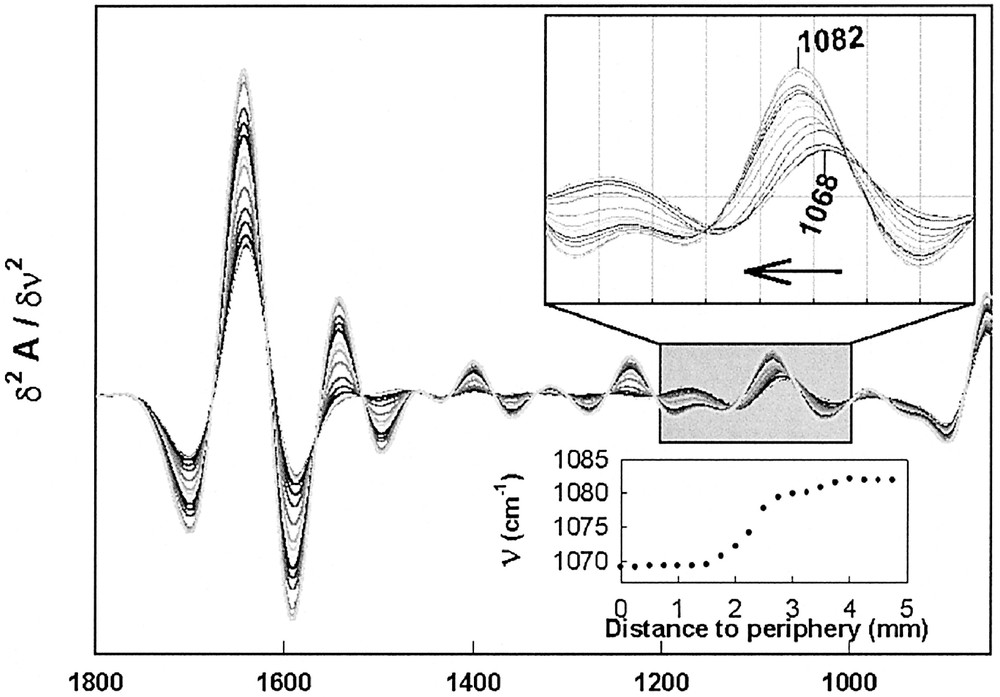
The corresponding inverted second derivative spectra are shown along with a zoom (upper inset) of the 1200–1000-cm–1 domain. This clearly allows to show the large frequency upshift that is observed as a function of time and hence also of distance from the periphery. The lower inset displays the evolution of the frequency as a function of distance to periphery.
P. mirabilis swarming features one of the most striking manifestations of bacterial multicellular behaviour by its robust synchronicity, its ability to adapt to a brand new environment and to cooperate. The present study clearly demonstrate that FEWS is sensitive enough, not only to detect, in real-time, the colonisation of a substratum by a bacterial biofilm, but also to detect minute biochemical alterations, i.e. in their polysaccharides membrane content, which reflect the switch from a vegetative phenotype to a swarming, pathogenic one. This study also demonstrates that distinct IR spectral signatures may contribute to map, in space and time, the behaviour of complex biological systems. The need for integrated (i.e. living cells) and local information on complex biological systems may hence be partially fulfilled by the use of FEWS.
6 Conclusion
This contribution is aiming at evidencing the originality and efficiency of this remote spectroscopy using infrared glass fibres. The possibility of exploring a large optical domain covering almost all the vibrational signatures of molecular and inorganic species open the way to the understanding of complex reactions mechanisms in chemistry, biology and environment. The tapering technique offers the advantage of miniaturisation and in-situ spectroscopy. Up to now, only in-vitro experiments have been performed on biological tissues, but after this preliminary step, and the development of an adequate sensor head, it is expected to obtain in-vivo information, in order, for instance, to assist surgeons in early diagnosis in operation conditions.