

1 Introduction
In the wake of structural genomics programs, high-resolution NMR of proteins is expected to be used increasingly not so much for de novo structure determination but rather for investigating the properties of a protein for which the structure or that of a close homologue is known. The task of assigning the spectra is then an unrewarding chore and a major bottleneck on the route to interpretation of spectra and to information of biological relevance. In such cases, the assignment is not required for structure determination but, for example, to allow the interpretation of changes in the spectra associated with interactions (e.g., protein–ligand, protein–protein, protein–nucleic acid) or to enable the investigation of dynamic properties.
We recently introduced a novel method for the direct determination of tertiary structures of double-labelled proteins using a distance-based interpretation of NMR spectra [1]. In essence, we suggested that cross-peaks in all spectra used traditionally for assignment purposes could be interpreted in terms of distances between atoms labelled only by their atom type and chemical shift. These distance restraints supplement those between pairs of hydrogen atoms derived from NOE spectra and allow the structure of the protein to be determined with no assignment step. Using synthetic data, the tertiary structure of the 76 amino acid protein ubiquitin was determined. Omitting distance restraints derived from NOE spectra from this procedure yields an unstructured chain that can be simply placed on an available structure, determined experimentally or obtained by homology modelling. The assignment is obtained as a by-product of this process.
In practice, the implementation of a distance-based approach to spectral interpretation suffers from a number of difficulties that have led us to develop the set of programs and tools presented here. In particular, uncertainty in chemical shifts requires us to define distances to atoms within a certain range of the picked peak position. This in itself is not a problem, but difficulties arise when the amide proton of a residue is not observed, for example, in the case of a proline residue. Here, distances to atoms of the preceding residue can only be defined using their chemical shift, but this requires that those atoms be present in the list of observed atoms between which distances are defined. Their absence, together with a tolerance in chemical shift, leads to incorrect distance restraints and meaningless structures. Establishing a correct list of atoms is not trivial, where atoms are not observed on their own HN/N resonances.
We have therefore developed a set of programs and tools for handling peak lists, searching for sets of atoms with no HN/N and in so doing, establishing connectivities. The chain so generated is broken at proline residues and at other points where no HN/N cross-peak is observed. Tools have therefore been developed to allow the chain fragments to be placed on the primary sequence, to detect and correct errors at this stage and to aid the spectroscopist in assessing the result by presenting all available information in a concise manner. We have introduced a number of features (such as a display of the chemical shift index) but have left the code open for the addition of other parameters. We have sought to retain the intervention of the spectroscopist in the analysis of his/her data, rather than to provide an automated package. We illustrate the use of the software with a number of examples and discuss the limitations of the approach.
2 Materials and methods
2.1 NMR data sets
Raw data sets recorded at UCL, London, using a doubly labelled sample of ubiquitin were downloaded [2], processed using NMRPipe [3] and analysed using XEASY [4]. Datasets recorded and processed previously at NIMR, London [5,6], using a doubly labelled sample of α-actinin EF34 complexed to unlabelled titin Zr7 were used without further processing. Typically, in each dimension, data were multiplied by a Gaussian function or a 90°-shifted sinebell function and zero-filled at least to the next power of two, prior to Fourier transformation. Data points were added in the 13C dimension by linear prediction, so as to extend the effective acquisition time.
2.2 Peak lists
Peak lists were created for each of the available experiments: HN(CO)CA, HNCA, CBCA(CO)NH, CBCANH, HNCO, HN(CA)CO, in each case starting from the same HSQC peak list and maintaining the exact numerical values of HN and N chemical shifts. Peaks from the HN(CO)CA spectrum were used to identify peaks unique to the HNCA spectrum, and similarly for the other two pairs of experiments. In the most favourable case, each HSQC cross-peak will lead to one entry in each of the peak lists from the 3D spectra, since HN(CO)CA peaks are removed from the HNCA peak list, and so on, with the obvious exceptions such as for glycine residues in experiments correlating Cβ atoms.
2.3 QUASI-1
Compilation of the peak lists leads to a set of chemical shifts for each pair of HN/N resonances, corresponding to nuclei of atoms that are either intra-residual (Cαi, Cβi, COi) or sequential (Cαi–1, Cβi–1, COi–1). For each HN/N, the full table of intra-residual chemical shift values is scanned for a match for its sequential chemical shift values. If a match (within defined tolerance limits: 0.14 ppm for Cα and CO; 0.20 ppm for Cβ) is unambiguously found, the connectivity is established. If no match is found, the closest matches on each atom type are presented together with the best overall match. The user is prompted to choose one of the proposed options or to define a chain start point. In the latter case, a new HN/N-less residue is defined with chemical shifts set to those of the Cαi–1, Cβi–1, COi–1 atoms.
In this manner, the absent atoms can be recovered and included. The introduction of unnecessary chain breaks resulting from the analysis of a conservative spectroscopist (i.e., where the pair of HN/N resonances were not truly absent but connectivity was unclear) can be rectified at a later stage (see below).
2.4 QUASI-2
To assist the spectroscopist in placing the chain fragments with confidence on the primary sequence of the protein, QUASI-2 calculates a scoring function for each possible position of each chain fragment along the sequence. The simplest case, that of a protein for which no structure is available and for which no residual dipolar couplings have been measured, is described here and extensions are discussed below (§2.5). At each position, the match between experimental chemical shift values for the atoms composing the chain fragment and random coil values [7] for the amino acid sequence is assessed. The difference in Cα and Cβ chemical shifts is used to determine a score for each residue in the chain fragment when the chain start point is placed at a particular position in the primary sequence:
The per-residue scores Ri are used to determine an overall score S for placing the chain fragment of length n with its start point at each possible position in the primary sequence, using a weighting scheme analogous to that used in sequence alignment algorithms, to favour continuous matching alignments over interrupted alignments:
Overall scores for each fragment at each position along the sequence are presented, together with a summary placing the fragments at the position at which they achieved the highest score.
This summary serves to identify inconsistencies, while presentation of the overall scores at each position allows the spectroscopist to judge the uniqueness of the proposed solution. For each chain fragment, the bar charts showing per-residue ΔCα and ΔCβ values can be accessed, enabling inconsistencies to be investigated in detail (see § 3.2). Chain fragments may be cleaved if errors were introduced in QUASI-1 or linked if unnecessary chain breaks were introduced by the spectroscopist.
QUASI-1 is currently implemented in FORTRAN-90 while calculations in QUASI-2 are performed in C++ while the graphical interface is written in Python 2.2.2, using histograms drawn with gnuplot. Those interested in using the software should contact the authors.
2.5 Variations
A number of variations may be incorporated into QUASI-2. Implemented variations are described here together with planned extensions.
2.5.1 Chemical shift data
The dataset with which experimental values for the chain fragments is compared may be chosen from a number of options. Instead of random coil values, mean values from the BMRB may be used. The threshold values Dα and Dβ may be set on a per-residue basis using standard deviations listed in the BMRB. Alternatively, values generated by SHIFTY [8], or, if a tertiary structure is available, calculated chemical shifts (e.g., from SHIFTS [9]) may be used.
2.5.2 Residual dipolar couplings
Where a tertiary structure is available, comparison of experimental residual dipolar couplings with expected values may be presented.
2.5.3 Chemical shift index
CSI values [10] may be used in one of two manners. For a given alignment, they may simply be calculated and inferred from the secondary structure elements presented. Where a tertiary structure is available, a ΔCSI term may be added to Ri,j.
3 Results
3.1 Ubiquitin
The 76 amino acid protein ubiquitin is widely used for evaluating NMR methodology [11]. It provides spectra of exceptionally high quality and as such may be regarded as a favourable case for initial evaluation. Peak lists from the six triple-resonance experiments were created and used as input for QUASI-1. The user was prompted on 17 occasions. Of these, in 5 cases a chain start point was introduced and a new residue with no HN/N created. In 12 other cases, the best match over all 13C chemical shifts was accepted after inspection of the NMR spectra. In all 12 cases, the difference in Cβ chemical shift exceeded the threshold slightly. Five chain fragments were generated with lengths of 5, 13, 15, 18 and 24 residues. Analysis of the chain fragment composition using the full assignment of ubiquitin confirmed that no connectivity errors were made.
The sequence contains three proline residues, at positions 19, 37 and 38. The chain is therefore expected to be broken at two points yielding three chain fragments. Comparison of the HSQC spectrum with the full assignment table shows that the HN/N cross-peaks of two further residues are missing. These peaks can be observed at low contour levels but were not re-introduced here, to maintain an unbiased approach.
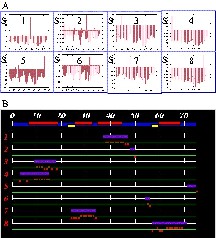
In a case such as that of ubiquitin, the chain fragments may easily be placed on the sequence by inspection of fragment lengths and checks on characteristic chemical shifts such as those of glycine Cα or alanine Cβ atoms. A more rigorous analysis is provided for in QUASI-2. The highest score correctly positions each fragment on the primary sequence. There is no conflict among the positions of the chain fragments (Fig. 1). The highest score Sj for each fragment is unambiguous, the correct placing of each chain fragment being at the only position with a positive value of Sj. There is little need for inspection of the detailed histograms, showing the residue-by-residue scores for each position of the chain fragment along the length of the sequence. Calculated CSI values for the best position of each chain fragment correspond well with the secondary structure elements defined in the PDB file (PDB code : 1UBQ)

QUASI-2 for ubiquitin. (A) Scores for placing the five chain fragments at each possible position along the primary sequence. Scores are calculated as described in §2.4. B. Summary of proposed positions for the five chain fragments on the primary sequence of ubiquitin. Elements of secondary structure (as defined in 1UBQ.pdb) are mapped onto the sequence: yellow, β-strands; red: helices. Chain-fragment positions are indicated by horizontal purple bars. CSI values are shown as red bars.
3.2 α-actinin EF34
The structure of the C-terminal EF-hand domain of the muscle protein α-actinin in complex with Z-repeat 7 of titin was determined recently [10,11]. The 73 amino acid protein provides a more realistic test case for QUASI than that of ubiquitin.
Peak lists were generated as above, except that no HN(CA)CO spectrum was available. QUASI-1 therefore only used Cα and Cβ chemical shifts, but CO chemical shifts are carried through to the resulting chain fragments.
The user was prompted on 12 occasions. Of these, in 8 cases a chain break was introduced, since no acceptable match could be found, while only in two cases was the best match across both Cα and Cβ accepted. As for ubiquitin, the difference in chemical shifts of the Cβ atoms exceeds slightly the threshold value. In the remaining two cases, a match other than the best match across both Cα and Cβ chemical shifts was chosen. In each case, no peak had been selected for the matching HN/N in the CBCANH spectrum. This situation may arise often in practice and inspection of the spectra is then required. The Cβi–1 peak may be weak or hidden under the Cβi peak. An option is given to add the Cβi–1 atom to the residue. For α-actinin EF34, both such cases required the addition of the Cβi–1 atom.
A total of eight chain fragments were generated with lengths of 3, 3, 5, 10, 11, 11, 13 and 15 residues. Analysis of the chain fragment composition using the full assignment of α-actinin EF34 (in complex with titin ZR7) showed that one error was made. The wrong match was made when the set of chemical shifts associated with a particular HN/N satisfied the matching criteria for a second HN/N and were not signalled as matching the chemical shifts of any other HN/N, since the residue in question is followed by a proline. In the set of shifts with which the HN/N should have been matched, the Cβi value was missing. While this particular error could be taken care of in QUASI-1, prompting the spectroscopist when such a situation arises, it is representative of a class of errors that may be difficult to avoid when working with experimental datasets. It is important therefore to provide a means for its correction.
The occurrence of an error is readily apparent in the chain-fragment position overview (Fig. 2). Chain fragments 3 and 4 clearly overlap. Inspection of the histograms indicates that chain fragment 4 is correctly positioned, suggesting a problem with chain fragment 3. The histogram for the selected position is mediocre, but that at position 15 reveals the nature of the problem. A good score across 9 out of 10 residues is corrupted by the last residue positioned at the site of a proline residue. Truncation of the final residue of chain fragment 3 resolves the problem.
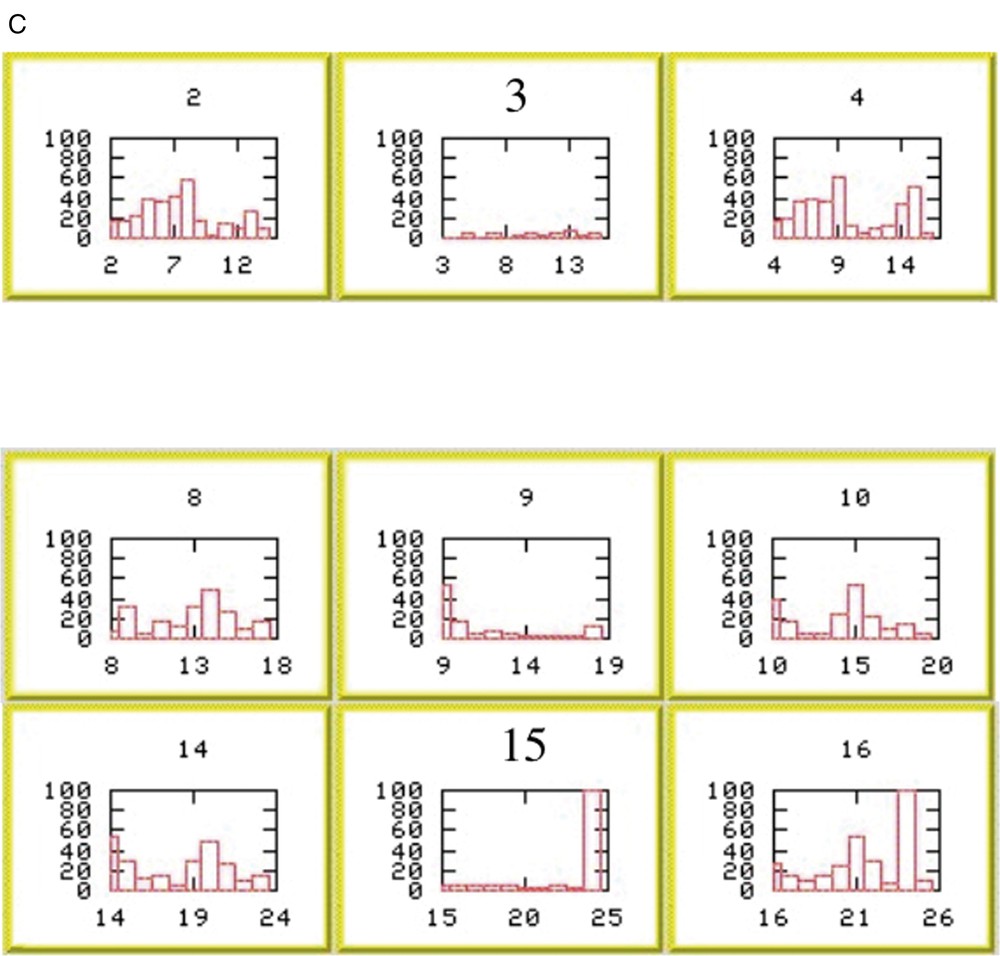
(A) QUASI-2 analysis for actinin EF34. Scores for placing the eight chain fragments at each possible position along the primary sequence. Scores are calculated as described in §2.4. (B) Summary of proposed positions for the eight chain fragments on the primary sequence of α-actinin EF34. Elements of secondary structure (as defined in 1H8B.pdb) are mapped onto the sequence: yellow, β-strands; red, helices. Chain-fragment positions are indicated by horizontal purple bars. CSI values are shown as red bars. Chain fragments 3 and 4 clearly overlap. (C) Per-residue values of ΔCα +ΔCβ for positions of chain fragment 4 starting around residue 3 (upper row) and of chain fragment 3 starting around residue 9 (middle row) and residue 15 (lower row). Masquer
(A) QUASI-2 analysis for actinin EF34. Scores for placing the eight chain fragments at each possible position along the primary sequence. Scores are calculated as described in §2.4. (B) Summary of proposed positions for the eight chain fragments on the ... Lire la suite
3.3 Effect of chain-fragment length
The scoring system described above will clearly work better with longer chain lengths. The discrimination of the correct position on the sequence will depend on the chemical nature (and thus the random coil chemical shifts) of the residues involved. It should be stressed that this is equally true when protein spectra are assigned by standard methods. Clearly a score based on differences between observed and random coil chemical shifts cannot discriminate between positions with identical sequences and such cases are more likely to arise the shorter the chain fragment considered.
Acknowledgements
We thank Vladimir Saudek (Aventis, Vitry-sur-Seine, France) for his continued interest in this work, Richard Harris and Paul Driscoll (UCL, London) for making their experimental data sets available and Ad Bax (NIH, Bethesda, MD, USA) for supplying a full assignment table for ubiquitin. We thank Claude Ling for resolving computer-related problems and Annick Dejaegere for discussions on chemical shifts. We thank particularly Michel Robin (Aventis, Vitry-sur-Seine, France) for his support. M.-A.C. is the recipient of a ‘bourse régionale’ co-financed by Aventis and the ‘Région Alsace’.
Vous devez vous connecter pour continuer.
S'authentifier