

1 Introduction
Gentamicin is a complex of more than four aminoglycoside congeners obtained by fermentation from Micromonospora purpurea. Gentamicin has a broad antibiotic activity and is used in diverse infectious diseases such as leishmaniosis, osteomylosis and against other gram-negative bacteria. It is the main drug used in the treatment of chronic osteomylosis [1,2]. Gentamicin is also used in food production to promote growth and for prophylactic reasons [3].
- • There are a number of methods dealing with the separation and/or the quantification of gentamicin either as a bulk or as congeners in different media. Among bulk quantification methods, the microbiological assays are those recommended by different pharmacopoeias [4,5] and many publications deal with this method. Immunological and ultraviolet measurement methods are also used for bulk gentamicin analysis [7,8]. Gas chromatography, liquid chromatography and thin-layer chromatography have been introduced for congeners' separation. The advantage of the chromatographic methods over bulk methods is that they can perform individual component separation and quantification. Congeners can be detected either by UV detection [9–11], MS detection [12–14], fluorimetric detection [15–18] or electrochemical detection [2,19,20].
- • The detection of gentamicin after chromatographic separation was an analytical problem due to the lack of chemical detectable characteristics. So pre-derivatisation or post-derivatisation processes are used to allow detection. Gentamicin can then be detected as FMOC-Cl derivatives, dansylchloride derivatives or OPA derivatives [17], the more commonly encountered in the literature being the OPA-mercaptoacetic acid derivatives [3,9]. The advantage of these OPA derivatives is that they are used either for UV or fluorescence detection [10,17]. Getek et al. [19] described a chromatographic separation of gentamicin congeners followed by electrochemical detection with a glassy carbon electrode at a 1200-mV potential and pulsed electrochemical detections with a gold electrode have also been used [1,2] The electrochemical detections encountered in literature are pulsed electrochemical detections [1,2]. This detection technique is difficult to manage for many laboratories and many others cannot afford it.
Because, in general, electrochemical detection is more sensitive than fluorimetric detection, an analysis by high-performance liquid chromatography that uses the electrochemical properties of gentamicin-OPA derivatives is proposed. In this work, gentamicin–OPA derivatives are simultaneously determined by electrochemical and fluorimetric detections after chromatographic separations. The comparison of electrochemical detection with fluorimetric detection in gentamicin congeners analysis has been investigated.
2 Experimental
2.1 Reagents
Gentamicin sulphate was a kind gift from Schering Plough (Belgium). Orthophthaldialdehyde (OPA) was purchased from Sigma (Austria). 1-Heptanesulfonic acid, thioglycolic acid, potassium hydroxide 45% (w/v) and acetic acid were obtained from Acros Organics (Belgium). Methanol was HPLC grade from Acros Organics (Belgium). Water was double distilled and purified with a Millipore Milli-Q (Millipore, USA). The borate buffer was a 4-mM boric acid solution whose pH was adjusted to 10.4 with potassium hydroxide 45% (w/v).
2.2 OPA–thioglycolic acid solution
The OPA–thioglycolic acid solution was prepared as followed: 400 mg of OPA was dissolved in 2 ml of methanol and 37 ml borate buffer. Thioglycolic acid (0.8 ml) was added and the pH was then adjusted to 10.4 with potassium hydroxide (45% w/v). It is important to proceed in this way to avoid precipitation.
2.3 Derivatisation procedure
10 ml of gentamicin solution were introduced into a 25-ml volumetric flask and 800 μl of the OPA solution (approximately 10 mg ml–1 at pH 10.4) are added. The volume was brought to the mark with methanol. The flask was then placed at 60 °C for 15 min in a water bath. After the reaction had taken place, the solution was cooled and delivered into vials. A volume of 20 μl of the reaction mixture was injected.
2.4 HPLC system
The analysis was performed with a computer-assisted Agilent 1100 HPLC series comprising a binary pump equipped with an autosampler. For the fluorimetric detection, we used an Agilent 1100 HPLC series fluorimetric detector. The excitation wavelength was set at 340 nm and the emission was measured at 430 nm. Data were handled with Chemstation software. For the electrochemical detection, an electrochemical detector with glassy-carbon working and auxiliary electrodes (BAS CC-5E, petit ampère, Bioanalytical Systems Inc, West Lafayette, USA) was used; the electrochemical cell potential was set at 700 mV. This detector is connected in series to the fluorimetric detector. The data from the electrochemical detector were processed via Borwin software (GMBS, France). The chromatographic column was an Alltech Hypurity C18 octadecylsilane (100 × 4.6 mm). The mobile phase consisted of water, methanol and acetic acid (28/67/5; v/v/v) containing 25 mmol of sodium heptanesulfonate as counter ion. A linear flow rate of 1 ml min–1 was used.
2.5 Linearity, accuracy and precision evaluation
A three-day validation procedure was implemented, as indicated by Caporal-Gauthier et al. [21], with minor modifications. Each day, a quantity of about 25 mg of gentamicin was weighed and dissolved in water (25 ml). Independent dilutions were then undertaken to cover our analytical dynamic range. For each concentration triplicate, analysis was carried out. For each congener, the exactitude was calculated, referring to the given linear equation. For precision assessment, the recovery values at each concentration throughout the three-day validation are compared and then the assessment of the inter-day precision is made.
3 Results and discussion
The objective of this study was to validate an isocratic HPLC assay for gentamicin analysis with electrochemical detection that allows low gentamicin concentration analysis as an alternative to fluorimetric detection. OPA is often used as an off-line derivatisation agent for fluorimetric detection in gentamicin analysis. Attempts were made to evaluate the possibility of using the same OPA derivatives for electrochemical detection, as electrochemical detection is generally more sensitive than fluorimetric detection. Preliminary investigations show that OPA derivatives have also electrochemical properties. The bulk gentamicin received from Schering Plough consists of four major components. The separation profiles of gentamicin congeners are shown in Figs. 1 and 2 for electrochemical and fluorimetric detections, respectively. The order of elution is congener C1, congener C1A, congener C2A and congener C2. This elution behaviour was in accordance with that established by Schering Plough and brought to us through the certificate of analysis. Chromatograms also show unidentified congeners that are better detected by the electrochemical detector as opposed to the fluorimetric technique. These unidentified congeners have been reported by other publications [2,20]. The validation process was then undertaken during three days to estimate the performance of this electrochemical detection for routine analysis.
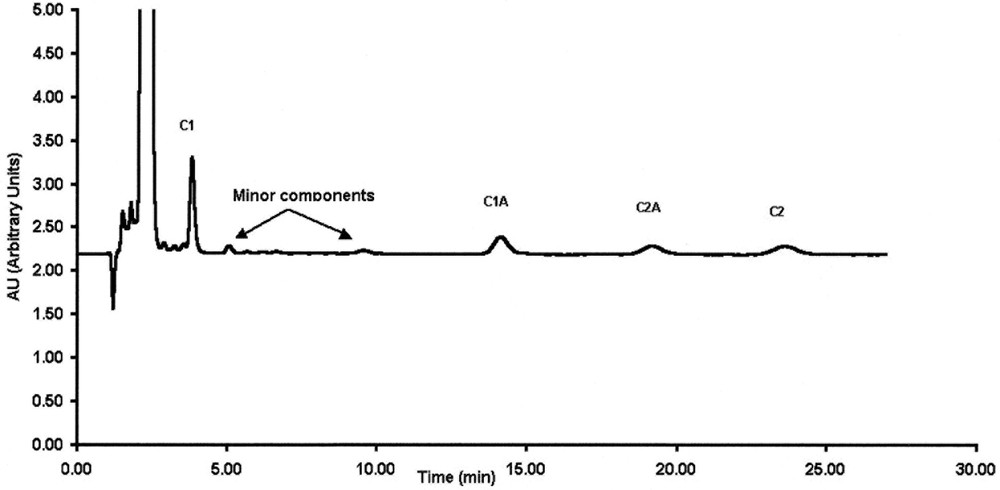
LC-electrochemical detection of gentamicin congeners (C1, C1a, C2a and C2) at 10 μg ml–1.

LC-fluorimetric detection of gentamicin congeners (C1, C1a, C2a and C2) at 10 μg ml–1.
During the time course of the validation process, the stability of the OPA derivatives was investigated, as the chromatographic system was equipped with an autosampler and analysis took place all day long. It is established that these OPA derivatives are stable up to 48 h; thus the automatic injection procedure was used without further problems. It is also well known that glassy electrodes have a tendency to encounter stability problems during long-time analysis. No specific problem regarding the stability of the glassy electrodes was encountered during this analysis; long-time automation analysis was consequently possible.
3.1 Linearity
For each day, at least six concentrations were used for the linearity profile. Each concentration was injected as a triplicate. Regression parameters were calculated every day. The regression parameters calculated from the data of electrochemical and fluorimetric detections are given in Tables 1 and 2, respectively, for each day. For each congener, the regression determination coefficient (r2) approached unity, and comparison of the intercepts with zero in both detection methods indicates that they are not different from the zero value (p < 0.05). Comparisons of regression parameters between days do not show any statistical difference as well.
Regression parameters for the linearity test of gentamicin congeners using electrochemical detection
| Linearity parameters | Gentamicin congeners | ||||
| C1 | C1A | C2A | C2 | ||
| Day 1 | Slope | 138.77 | 215.57 | 114.68 | 143.46 |
| (10.62)a | (3.36) | (1.882) | (3.73) | ||
| Intercept | –12.80 | –208.82 | –104.61 | –1.93 | |
| (24.27) | (76.81) | (43.013) | (85.27) | ||
| r2 | 0.999 | 0.999 | 0.999 | 0.997 | |
| Day 2 | Slope | 134.59 | 220.95 | 117.67 | 146.70 |
| (32.54) | (4.46) | (2.97) | (3.712) | ||
| Intercept | –32.63 | –273.88 | –158.88 | –1.11 | |
| (74.37) | (102.01) | (67.96) | (84.82) | ||
| r2 | 0.997 | 0.998 | 0.997 | 0.997 | |
| Day 3 | Slope | 140.22 | 231.84 | 122.67 | 144.5 |
| (2.35) | (4.41) | (2.56) | (2.78) | ||
| Intercept | –16.33 | –239.30 | –160.97 | –2.15 | |
| (53.61) | (100.71) | (58.717) | (63.95) | ||
| r2 | 0.998 | 0.998 | 0.998 | 0.999 |
a Standard errors of the estimated parameters as given by least-square regression analysis. The concentrations are expressed in μg ml–1.
Regression parameters for the linearity test of gentamicin congeners using fluorescence detection
| Linearity parameters | Gentamicin congeners | ||||
| C1A | C1 | C2A | C2 | ||
| Day 1 | Slope | 0.126 | 0.088 | 0.0507 | 0.065 |
| (0.003)a | (0.002) | (0.0007) | (0.001) | ||
| Intercept | –0.7 | –0.4 | –0.05 | –0.3 | |
| (0.3) | (0.2) | (0.08) | (0.2) | ||
| r2 | 0.996 | 0.996 | 0.998 | 0.995 | |
| Day 2 | Slope | 0.140 | 0.095 | 0.054 | 0.066 |
| (0.003) | (0.002) | (0.001) | (0.001) | ||
| Intercept | –1.1 | –0.6 | –0.2 | –0.2 | |
| (0.4) | (0.2) | (0.1) | (0.2) | ||
| r2 | 0.995 | 0.997 | 0.996 | 0.989 | |
| Day 3 | Slope | 0.139 | 0.095 | 0.05 | 0.064 |
| (0.003) | (0.003) | (0.05) | (0.002) | ||
| Intercept | –1.0 | –0.5 | –0.1 | –0.3 | |
| (0.4) | (0.4) | (0.1) | (0.3) | ||
| r2 | 0.996 | 0.989 | 0.996 | 0.989 |
a Standard errors of the estimated parameters as given by least-square regression analysis. The concentrations are expressed in μg ml–1.
For the electrochemical detection, although a good linearity was found from 0.2 to 50 μg ml–1 for congeners C1 and congener C1A, bad recovery rates were noticed at 0.2 and 0.4 μg ml–1. So, depending on the congener, the analytical dynamic range was set from 1 to 50 μg ml–1 for congeners C1 and C1A, and from 2 to 50 μg ml–1 for congeners C2A and C2, for which good recovery rates and precisions were found. The dynamic range for the fluorimetric detection goes from 8 to 80 μg ml–1 for the four congeners, taking into account accuracy and fidelity parameters.
3.2 Accuracy
The results concerning accuracy were calculated for each concentration by using the regression equation and data generated during independent concentration measurements. The results are shown in Tables 3 and 4. With electrochemical detection, a good accuracy was noticed for each congener and the recovery rates for each concentration, except for congener C2 within the dynamic range, are between 90 and 110% of the nominal value, indicating a good stability of the OPA derivatives during analysis. This congener is less sensitive to electrochemical detection of the gentamicin congener as an OPA derivative. No significant difference was noticed between the other congeners in terms of recovery within their respective dynamic ranges. With fluorimetric detection, the recovery rate for each concentration within the dynamic range is between 90 and 115% of the nominal value, indicating a good accuracy. Moreover, no significant difference was noticed between the four congeners.
Accuracy of electrochemical detection expressed in terms of % recovery and between-day precision
| Concentration (μg ml–1) | Congeners mean recovery | |||
| C1 | C1A | C2A | C2 | |
| 1 | 108.41 | 101.14 | ||
| (12.41)a | (0.56) | |||
| 2 | 107.10 | 98.84 | 104.5 | 137.67 |
| (4.12) | (2.93) | (10.84) | (9.67) | |
| 5 | 81.20 | 93.58 | 93.67 | 99.52 |
| (10.74) | (4.40) | (8.68) | (8.78) | |
| 10 | 98.57 | 102.82 | 91.48 | 99.2 |
| (1.79) | (7.60) | (6.3) | (0.89) | |
| 20 | 97.96 | 103.11 | 105.35 | 89.4 |
| (3.22) | (0.90) | (8.23) | (7.47) | |
| 25 | 103.25 | 109.18 | 98.36 | 97.39 |
| (3.17) | (11.11) | (2.46) | (4.57) | |
| 50 | 99.7 | 108.09 | 99.93 | 102.29 |
| (1.12) | (2.38) | (1.47) | (0.26) |
a Coefficients of variation that are considered as inter-day precisions (n = 9).
Accuracy of fluorimetric detection expressed in terms of % recovery and between-day precision
| Concentration (μg ml–1) | Congener's mean recovery | |||
| C1 | C1A | C2A | C2 | |
| 8 | 108.62 | 112.68 | 108.46 | 114.2 |
| (2.99)a | (6.95) | (1.51) | (0.63) | |
| 10 | 102.89 | 103.99 | 104.86 | 107.72 |
| (2) | (7.5) | (7.38) | (8.99) | |
| 20 | 92.57 | 94.23 | 97.27 | 96.81 |
| (7.68) | (9.86) | (11.44) | (14.81) | |
| 30 | 97.22 | 95.95 | 94.3 | 92.74 |
| (2.28) | (9.25) | (7.38) | (7.1) | |
| 40 | 97.2 | 96.78 | 96.54 | 96.71 |
| (0.61) | (4.03) | (3.14) | (3.13) | |
| 50 | 97.31 | 97.03 | 100.13 | 97.56 |
| (4.34) | (6) | (2.83) | (7.93) | |
| 60 | 100.92 | 99.96 | 100.45 | 100.01 |
| (3.38) | (1.55) | (1.56) | (1.16) | |
| 70 | 100.23 | 100.43 | 100.41 | 100.38 |
| (1.36) | (3.02) | (1.5) | (2.9) | |
| 80 | 101.93 | 102.5 | 101.19 | 102.53 |
| (2.32) | (3.88) | (1.16) | (3.74) |
a Coefficients of variation that are considered as inter-day precisions (n = 9).
3.3 Fidelity
The fidelity of both detection methods was assessed by analysing the between-day precision through the coefficient of variation (Tables 3 and 4). They range from 1.12% to 12.41% for congener C1, and from 0.56 to 11.11% for congener C1A. The fidelity values for congener C2A range from 1.47 to 10.84% and from 0.63 to 14.81% for congener C2 with electrochemical detection. Fluorimetric detection gives values from 0.61% to 7.68% for congener C1, from 1.55% to 9.86% for congener C1A, from 1.16% to 11.44% for congener C2A, and from 0.63% to 14.81% for congener C2. Both detection methods present similar fidelity characteristics.
3.4 Detection and quantification limits
The limit of quantification was determined, taking into account the linearity parameters by using data of gentamicin concentrations as low as possible and the accuracy and fidelity parameters concerning these concentrations. For the electrochemical detection, the quantification limit was 1 μg ml–1 for congeners C1 and C1A, with the accuracy of 90%, which was not the case of congener C2.. The detection limit in electrochemical detection was calculated by analysing subsequent dilution up to the lowest level of detection. The concentration is 0.05 μg ml–1 for congeners C1 and C1A and 0.1 μg ml–1 for congeners C2A and C2. For fluorimetric detection, the limit of quantification was found to be 8 μg ml–1 for each congener, whereas the detection limit was 1 μg ml–1, C2 congener being the more sensitive.
4 Conclusion
We report in this work results of gentamicin congeners analysis as OPA derivatives using electrochemical detection with full validation data. The method allows detection not only of all major gentamicin congeners C1, C1A, C2A and C2, but also of other minor unidentified components. The results of the validation show that a good linearity is found for the four congeners within the dynamic range 1–50 μg ml–1 for electrochemical detection and from 8–80 μg ml–1 for fluorimetric detection. These OPA derivatives are stable up to 48 h, whereas the electrochemical electrodes were also very stable during the whole validation experiment and no specific problem was encountered within the work time. For analysis with electrochemical detection, it is better to choose congeners C1, and C1A, as they are more sensitive to this electrochemical method, whereas congeners C2A and C2 have better responses to fluorimetric detection.
The comparison of the results shows that electrochemical detection is more sensitive than the fluorescence detection, although both methods can be used with good accuracy and precision within their respective dynamic ranges. The stability of the OPA derivatives, in addition to the stability of the glassy carbon and working electrodes during the whole analytical time, made the electrochemical detection method a good alternative to the fluorimetric and pulsed electrochemical detection methods.
Acknowledgements
The authors acknowledge the ‘Coopération universitaire au développement’ (CUD) and the ‘Commissariat général aux relations internationales’ (CGRI) of the ‘Communauté française de Belgique’ for Grant support.