

1 Introduction
The use of polyoxometalates [1–4] as potential sequestering agents and/or as sources of storage matrices (‘waste forms’) for radioactive waste has attracted attention for several years. One particularly troubling isotope is technetium-99 with a half-life of ~105 years that is readily transformed to the volatile heptaoxide during the vitrification processes currently envisioned for production of waste forms, or is converted to soluble pertechnetates that have high mobility in ground waters. We have recently been investigating the potentialities of polyoxometalates for the technetium problem, using in the first instance rhenium as a non-radioactive surrogate [5]. In related studies we have shown that tungsten bronzes incorporating lanthanide and actinide ions are efficiently produced by thermal decomposition at relatively low temperatures of the corresponding polyoxotungstate complexes [6]. The inertness of tungsten bronzes make them possible attractive targets for waste forms.
With the exception of hexametalate-supported triscarbonylrheniun(I) complexes prepared under nonaqueous [7] or aqueous [5] conditions, previously-characterized rhenium-containing polyoxometalates incorporate rhenium, usually in oxidation state V, in place of one or two tungsten(VI) atoms in Keggin [8], Wells-Dawson [9] or decatungstate [10] structures. Examples of analogous technetium(V) Keggin derivatives have also been described [11].
We report here the synthesis and characterization of a new type of tungstorhenate derivative with relatively high rhenium content (Re/W = 1:6). Thermal decomposition of potassium and ammonium salts of the new complex does not result in loss of rhenium at temperatures up to 900 °C, and leads to new tungsten–rhenium bronzes.
2 Experimental
2.1 Syntheses
Potassium pentachloro(oxo)rhenate(V) was prepared by reduction of 55% perrhenic acid (Alfa Aesar) with hydriodic acid according to the method of Ivanov-Emin et al. [12]. Isolated yield, 60%; IR, 940 cm–1 (Re=O). Potassium and ammonium salts of [PW11O39]7– were isolated from stoichiometric mixtures of PO43– and WO42– adjusted to pH 5.2 and their identities confirmed by 31P-NMR and IR. Sodium 9-tungstoarsenate(III), Na9AsW9O33·nH2O (AsW9) was prepared according to the literature [13]. IR, 935(vs), 898(vs), 783(vs), 727(vs), 515(w), 472(w), 443(w), 411(w) cm–1.
The potassium salt of [(ReO)3(AsW9O33)2]9– (K-1) was prepared as follows. Potassium pentachloro(oxo)rhenate(V) (K2ReOCl5, 0.67 g, 1.5 mmol) was added to a solution of potassium thiocyanate (KSCN, 1.95 g, 20 mmol) in 20 ml of deoxygenated water. After the rhenium complex had dissolved completely, sodium perchlorate (NaClO4, 3.04 g) was added and the mixture was cooled to 5 °C in an ice bath. A white precipitate of potassium perchlorate was filtered off. Sodium 9-tungstoarsenate(III) (2.74 g, 1 mmol) was added to the solution of the rhenium(V) complex. The color of the reaction mixture color changed from green to red-brown and the mixture was stirred for 30 min at room temperature. Any undissolved AsW9 was filtered off. Saturated potassium chloride solution (20 ml) was added to the reaction mixture and it was cooled to 5 °C in an ice bath. A dark brown precipitate (1.15 g, 40%) was filtered off and suction dried. Anal. Found (Calc. for K9[(ReO)3(AsW9O33)2]·23 H2O): K 6.1 (6.0), Na 0.3 (0), Re 9.76 (9.49), As 2.57 (2.54), W 56.1 (56.2). An ammonium salt (NH4-1) was prepared similarly. The product (yield 0.85 g, 30%) was precipitated by addition of 20 ml of 5 M (NH4)Cl.
The water-soluble potassium salt of [PW11ReO40]4– (‘PW11Re’), previously only known as a tetra-n-butylammonium salt [8], was prepared by dissolving K7PW11O39·15 H2O, (6.44 g, 2 mmol) in 60 ml of a 0.06 M-acetate buffer (pH 4) that had been deaerated with a stream of nitrogen for 30 min. The solution was heated to 50 °C and the K2ReOCl5 (0.92 g, 2 mmol) was added. The reaction mixture was heated at 50 °C under a nitrogen atmosphere for 1.5 h. Saturated potassium chloride solution (80 ml) was added and the resulting purple precipitate (1.45 g) was filtered off. 31P-NMR showed an impurity (probably unreacted PW11) at –10.9 ppm, as well as the major product at –15.1 ppm. The product was dissolved in 40 ml of deaerated water; the suspension was heated to ~50 °C until the solid dissolved completely and saturated potassium chloride solution was added and the mixture cooled to 5 °C in an ice bath. The precipitate (1.29 g, 21%) was collected and suction dried. The procedure was repeated two times until only one peak (–15.1 ppm) was observed in the 31P-NMR spectrum. Tungsten-183 NMR: δ/ppm (relative intensity): –99 (2), –115 (2), –116 (1), –207 (2), –274 (2), –290 (2).
2.2 Instrumental
Infrared spectra were measured on a Nicolet 7000 spectrometer from 4000 to 400 cm–1 with resolution of 2 cm–1. All samples were prepared as KBr pellets. Thermogravimetric analysis (TGA) curves were obtained on a TGA 2050 analyzer (TA Instruments) from room temperature to 950 °C under a nitrogen atmosphere. Alumina pans were used for all experiments. Differential scanning calorimetry (DSC) was recorded on a DSC 2910 calorimeter (TA Instruments) from room temperature to 725 °C under a nitrogen atmosphere. Platinum pans were used for all measurements. Cyclic voltammetry was performed on a BAS 100A electrochemical analyzer using a glassy carbon working electrode and platinum counter electrode using a sweep rate of 500 mV s–1. Potentials are reported with respect to a Ag/AgCl reference electrode.
NMR spectra were recorded on Bruker AM 300 (31P, 183W) or Varian Mercury 300 (31P) spectrometers. Typical parameters for phosphorus-31 NMR spectra were: offset frequency, 121.497 MHz; bandwidth, 3650 Hz and repetition rate, 0.6 Hz. Chemical shifts were measured relative to 85% phosphoric acid. Typical parameters for 183W NMR spectra were: offset frequency, 12.504 MHz; bandwidth, 5 KHz and repetition rate, 0.4 Hz. Chemical shifts were measured relative to 2 M Na2WO4. For collection of 183W-NMR spectra potassium salts of PReVW11 and 1 were exchanged to lithium salts using lithium perchlorate (LiClO4). For the exchange, 1–2 g of the polyoxometalate sample, a stoichiometric amount of LiClO4 and 2 ml of D2O were mixed together and stirred for 30 min. Insoluble KClO4 was filtered off and the filtrate was used to collect the NMR spectrum.
Powder diffraction patterns were collected on a RIGAKU R-Axis Rapid XRD automated powder diffractometer equipped with an Image Plate detector. For a typical sample preparation, fine powder was mixed with vaseline and the mixture was smeared onto the surface of a single crystal silicon sample holder. The data were collected in reflection geometry and were integrated using the RIGAKU R-Axis Rapid XRD software package, producing diffraction intensity vs. 2θ diffraction angle dependencies. These were processed using the Materials Data Jade 5.0 XRD software package. Final processing using Jade included background subtraction and peak search. Phase identification was performed by comparing peaks found with powder diffraction patterns of pure compounds stored in the database provided with the Jade software package.
3 Results and discussion
3.1 Synthesis and characterization of 1
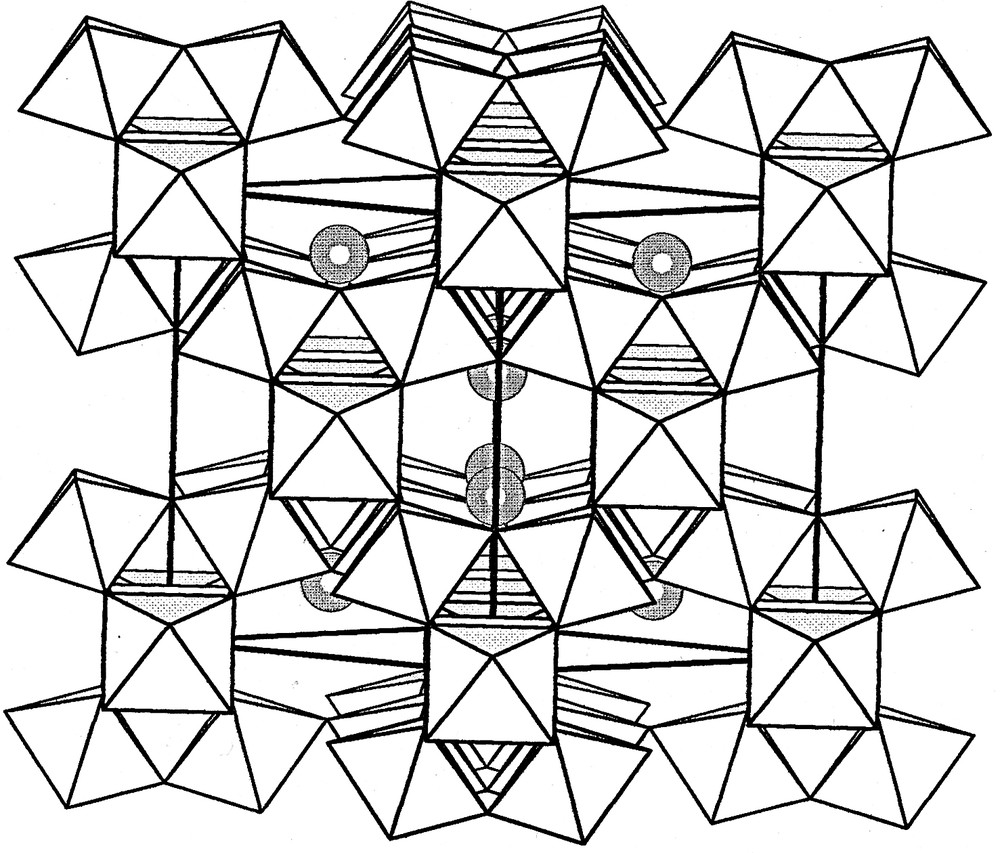
Since several examples of sandwich complexes of the type [M3(AsW9O33)2]12– (e.g. with M = Mn(H2O), Co(H2O), Ni(H2O), VO2+, WO4+) are known [14,15], reaction of {ReO3+} and AsW9 in a 3:2 molar ratio proceeds straightforwardly. It is necessary, however, to prevent rapid hydrolysis of [ReOCl5]2– in aqueous solution by complexation with excess thiocyanate, and to exchange sodium for potassium in the resulting solution to allow for ready subsequent dissolution of AsW9. Although crystals suitable for X-ray structural determination have not yet been obtained, there is little doubt about the composition and structure of 1. The molecular formula is supported by elemental analysis of the potassium salt and the infrared spectrum in the metal-oxygen stretching region is virtually identical to that of Na9AsW9O33 indicating the presence of AsW9 building blocks. The 183W NMR spectrum of 1 shows five lines of relative intensity 1:2:2:2:2 at –79, –95, –102, –134, and –145 ppm, respectively, instead of the anticipated two lines for a complex of D3h symmetry. This result implies that the three sandwiched ReO3+ groups are arranged with one Re–O vector directed towards the interior of the anion and the other two directed outwards, i.e. in similar fashion to the corresponding WO4+ groups in [As2W21O69(H2O)]6– (≡[H2O(WO)3(AsW9O33)2]6–) to give a structure of C2v symmetry, see Fig. 1. The presence of an ‘external’ water ligand in 1 cannot be confirmed in the absence of a crystal structure, although it seems probable.

Two polyhedral representations of the structure of [As2W21O69(H2O)]6– [15] showing the reduction in symmetry from D3h to C2v caused by the orientation of the equatorial WO4+ groups. Small gray spheres, W; open circles, terminal oxygens; gray circle, water ligand. An analogous structure with equatorial ReO3+ groups is proposed for 1.
In contrast to the Keggin-derived rhenium derivatives which display a rich electrochemical behavior corresponding to Re(V)–Re(VI) and Re(VI)–Re(VII) couples [8], cyclic voltammograms of 1 show only an irreversible anodic feature at +1.1 V vs. Ag/AgCl. We presume that the proximity of the rhenium centers in 1 allows facile electron transfer and effective disproportionation of any Re(VI), e.g. via
Re(VI) + Re(V) → Re(IV) + Re(VII) {ReO4–}
Attempts to oxidize 1 by addition of bromine water led to immediate decolorization.
3.2 Thermal decomposition of 1
We have previously shown that ammonium salts of polyoxotungstates containing lanthanide and actinide heteroatoms may be thermally decomposed to yield cubic tungsten bronzes that might be suitable as waste forms for lanthanide and actinide radioisotopes [6]. We, therefore, decided to explore the thermal behavior of rhenium-containing polytungstates as models for the corresponding technetium species. Several years ago Sleight and Gillson [16] had investigated solid solutions of WO3 and ReO3, which are isoelectronic with the cubic bronzes MxWO3.
Comparative thermogravimetric scans of K4[PW11ReO40] and K3[PW12O40] revealed that the former salt lost its rhenium content, presumably as Re2O7, at temperatures above 500 °C. In contrast both K-1 and NH4-1 yielded mixed rhenium–tungsten bronzes. Fig. 2 shows the TGA and DSC results for these two salts. Following loss of crystal water below 200 °C for both salts and volatilization of NH3 by 400 °C. The exothermic DSC peaks at 417 °C (K) and 433 °C (NH4) correspond to weight losses of 3.56% and 3.88%, respectively, attributed to the decomposition of the anion via loss of As2O3 (ca. 3.33% and 3.46%). No other significant weight loss was observed up to 950 °C. Between 600 and 950 °C the sample lost 0.31% (NH4) 1.1% (K) of its initial weight, indicating that most of the rhenium was still left in the sample. Elemental analysis of the ammonium salt heated to 950 °C in the TGA apparatus indicated that ~95% of the rhenium was left in the sample after heating. Anal. (Calc. for 1.5(Re2O5):18(WO3)): Re 10.89 (11.51); W 67.7 (68.2).

TGA and DSC curves of (NH4)9[(ReO)3(AsW9O33)2]·nH2O (A) and K9[(ReO)3(AsW9O33)2]·nH2O.
Phase identification in the samples of potassium and ammonium salts of 1 was carried out using powder diffraction. Analysis of powder diffraction patterns of the potassium salt samples decomposed at 600 and 725 °C (Fig. 3) indicates the presence of a monoclinic compound similar to potassium tritungstate, K2W3O10 (Fig. 4) [17]. Most of the observed diffraction peaks correspond to the powder diffraction pattern of K2W3O10. Observed differences in intensities of two low-angle peaks result from obstruction by the sample holder and absorption of diffracted rays by cavities on the real (not smooth) surface of the sample. Some peaks, which were not found in the diffraction pattern of K2W3O10 could be still indexed on the basis of the K2W3O10 monoclinic unit cell (see Section 5, Tables S1 and S2). Four reflections which could not be indexed on the basis of the K2W3O10 monoclinic cell do not correspond to any of the known rhenium oxides: ReO2 [18], ReO3 [19], Re2O7 [20] or to the ReO3–WO3 solid solutions [16]. The unit cell constants of the monoclinic cell were refined based on the assigned Miller indexes and are given in Table 1 (see Tables S7–S15 in Section 5). The refinement indicated no significant differences between unit cell parameters of samples heated to 600 and 725 °C.
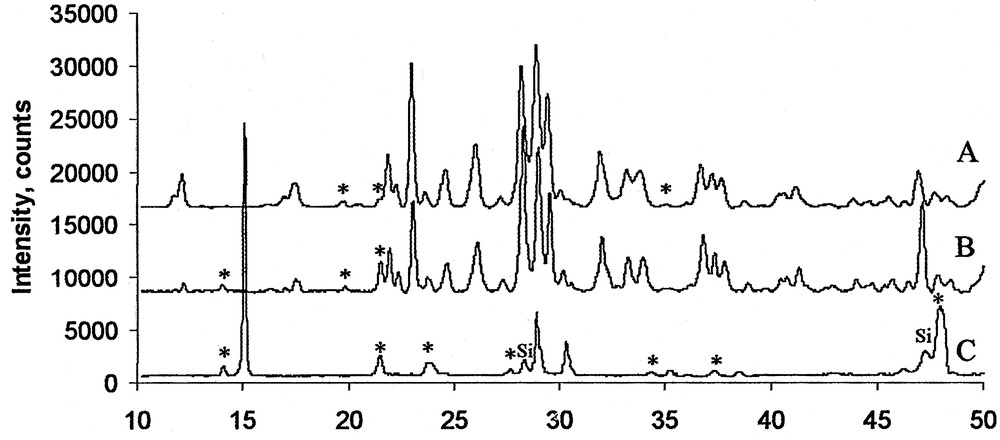
Powder diffractograms of samples of K9[(ReO)3(AsW9O33)2]·n H2O, heated to 600 °C (A), 725 °C (B), and 900 °C (C). (*) Unidentified reflections. (Si) reflections from silicon sample holder.

Monoclinic K2W3O10 structure. Crystallographic b-axis perpendicular to the plane of paper. Potassium cations (gray spheres) occupy positions in the large channels formed by tungsten oxide framework.
Phase identification for a sample of K9[(ReO)3(AsW9O33)2]·n H2O heated to 600 °C in TGA apparatus under N2 atmosphere
| 2θ(obs) | d(obs) (Å) | I(obs) (%) | Phase ID | d(card) (Å) | I(card) (%) | h | k | l | 2θ(card) | Δ(2θ) |
| 11.739 | 7.5323 | 8.8 | K2W3O10 | 7.5400 | 70.0 | 0 | 0 | 2 | 11.727 | –0.012 |
| 12.099 | 7.3089 | 23.4 | K2W3O10 | 7.3200 | 70.0 | –1 | 0 | 2 | 12.081 | –0.018 |
| 16.189 | 5.4706 | 1.8 | K2W3O10 | 5.4500 | 10.0 | –2 | 0 | 1 | 16.250 | 0.062 |
| 16.968 | 5.2209 | 6.1 | K2W3O10 | 5.2200 | 20.0 | –1 | 0 | 3 | 16.971 | 0.003 |
| 17.479 | 5.0696 | 17.0 | K2W3O10 | 5.0600 | 40.0 | 17.512 | 0.034 | |||
| 19.798 | 4.4806 | 3.9 | K2W3O10 | 4.4800 | 20.0 | 2 | 0 | 1 | 19.801 | 0.003 |
| 20.579 | 4.3124 | 2.7 | ||||||||
| 21.428 | 4.1433 | 5.2 | ||||||||
| 21.858 | 4.0628 | 36.3 | K2W3O10 | 4.0600 | 70.0 | 1 | 0 | 3 | 21.873 | 0.015 |
| 22.268 | 3.9889 | 14.8 | K2W3O10 | 3.9900 | 40.0 | –1 | 0 | 4 | 22.262 | –0.006 |
| 22.988 | 3.8656 | 99.3 | K2W3O10 | 3.8600 | 80.0 | 0 | 1 | 0 | 23.022 | 0.034 |
| 23.638 | 3.7608 | 9.7 | K2W3O10 | 3.7600 | 20.0 | 0 | 0 | 4 | 23.643 | 0.005 |
| 24.578 | 3.6190 | 25.8 | K2W3O10 | 3.6100 | 60.0 | –1 | 1 | 1 | 24.640 | 0.063 |
| 26.018 | 3.4219 | 44.1 | K2W3O10 | 3.4100 | 60.0 | –1 | 1 | 2 | 26.110 | 0.093 |
| 27.227 | 3.2726 | 6.0 | K2W3O10 | 3.2700 | 40.0 | 1 | 0 | 4 | 27.249 | 0.022 |
| 28.187 | 3.1633 | 95.4 | K2W3O10 | 3.1600 | 100.0 | –2 | 1 | 1 | 28.217 | 0.030 |
| 28.907 | 3.0861 | 100.0 | K2W3O10 | 3.0800 | 100.0 | –3 | 0 | 4 | 28.966 | 0.059 |
| 29.417 | 3.0338 | 73.1 | K2W3O10 | 3.0300 | 80.0 | 0 | 0 | 5 | 29.454 | 0.037 |
| 30.047 | 2.9716 | 11.2 | K2W3O10 | 2.9700 | 20.0 | 30.063 | 0.016 | |||
| 31.897 | 2.8033 | 38.8 | K2W3O10 | 2.8000 | 70.0 | 3 | 0 | 2 | 31.936 | 0.039 |
| 33.137 | 2.7012 | 20.4 | K2W3O10 | 2.7000 | 60.0 | 0 | 1 | 4 | 33.152 | 0.015 |
| 33.807 | 2.6492 | 25.2 | K2W3O10 | 2.6300 | 60.0 | –3 | 1 | 2 | 34.061 | 0.254 |
| 35.087a | 2.5555 | 2.0 | K2W3O10 | 2.548 | – | –3 | 1 | 3 | 35.199 | 0.112 |
| 36.056 | 2.4889 | 1.0 | ||||||||
| 36.676 | 2.4483 | 29.6 | K2W3O10 | 2.4400 | 60.0 | –3 | 0 | 6 | 36.805 | 0.129 |
| 37.216a | 2.4140 | 23.0 | K2W3O10 | 2.409 | – | –3 | 1 | 4 | 37.289 | 0.073 |
| 37.656 | 2.3868 | 21.3 | K2W3O10 | 2.4000 | 60.0 | –2 | 1 | 5 | 37.441 | –0.215 |
| 38.786 | 2.3198 | 4.6 | K2W3O10 | 2.3200 | 20.0 | 2 | 0 | 5 | 38.783 | –0.003 |
| 39.716a | 2.2676 | 1.1 | K2W3O10 | 2.264 | – | 3 | 1 | 2 | 39.783 | 0.067 |
| 40.376a | 2.2320 | 8.9 | K2W3O10 | 2.240 | – | –3 | 1 | 5 | 40.218 | –0.158 |
| 41.176 | 2.1905 | 12.0 | K2W3O10 | 2.1860 | 60.0 | 2 | 1 | 4 | 41.265 | 0.089 |
| 42.845 | 2.1089 | 2.5 | K2W3O10 | 2.1200 | 10.0 | –5 | 0 | 4 | 42.611 | –0.234 |
| 43.865 | 2.0622 | 5.5 | K2W3O10 | 2.0500 | 40.0 | 5 | 0 | 0 | 44.141 | 0.275 |
| 44.666a | 2.0271 | 2.6 | K2W3O10 | 2.022 | – | –4 | 1 | 5 | 44.775 | 0.109 |
| 45.525 | 1.9908 | 6.5 | K2W3O10 | 1.9860 | 20.0 | 1 | 0 | 7 | 45.642 | 0.117 |
| 46.275a | 1.9603 | 3.0 | K2W3O10 | 1.9609 | – | 1 | 1 | 6 | 46.260 | –0.015 |
| 46.935 | 1.9343 | 23.9 | K2W3O10 | 1.9280 | 20.0 | –5 | 0 | 6 | 47.097 | 0.162 |
| 47.725 | 1.9041 | 8.2 | K2W3O10 | 1.9070 | 20.0 | –4 | 1 | 6 | 47.647 | –0.078 |
| 48.295a | 1.8829 | 6.3 | K2W3O10 | 1.8851 | – | 0 | 0 | 8 | 48.235 | –0.060 |
| 50.045 | 1.8211 | 17.9 | K2W3O10 | 1.8300 | 20.0 | –4 | 0 | 8 | 49.785 | –0.259 |
a Reflections were indexed manually by calculating d-spacings and 2θ-angles for monoclinic cell of K2W3O10.
Phase identification for a sample of K9[(ReO)3(AsW9O33)2]·n H2O heated to 725 °C in DSC apparatus under N2 atmosphere
| 2θ(obs) | d(obs) (Å) | I(obs) (%) | Phase ID | d(card) (Å) | I(card) (%) | h | k | l | 2θ(card) | Δ(2θ) |
| 11.809 | 7.4878 | 1.6 | K2W3O10 | 7.5400 | 70.0 | 0 | 0 | 2 | 11.727 | –0.082 |
| 12.199 | 7.2493 | 5.2 | K2W3O10 | 7.3200 | 70.0 | –1 | 0 | 2 | 12.081 | –0.118 |
| 14.019 | 6.3120 | 3.9 | ||||||||
| 16.349 | 5.4172 | 1.9 | K2W3O10 | 5.4500 | 10.0 | –2 | 0 | 1 | 16.250 | –0.099 |
| 17.009 | 5.2086 | 2.3 | K2W3O10 | 5.2200 | 20.0 | –1 | 0 | 3 | 16.971 | –0.037 |
| 17.508 | 5.0612 | 7.5 | K2W3O10 | 5.0600 | 40.0 | 17.512 | 0.004 | |||
| 19.829 | 4.4738 | 3.0 | K2W3O10 | 4.4800 | 20.0 | 2 | 0 | 1 | 19.801 | –0.028 |
| 21.538 | 4.1225 | 18.1 | ||||||||
| 21.948 | 4.0463 | 26.4 | K2W3O10 | 4.0600 | 70.0 | 1 | 0 | 3 | 21.873 | –0.075 |
| 22.358 | 3.9730 | 12.7 | K2W3O10 | 3.9900 | 40.0 | –1 | 0 | 4 | 22.262 | –0.096 |
| 23.078 | 3.8508 | 55.1 | K2W3O10 | 3.8600 | 80.0 | 0 | 1 | 0 | 23.022 | –0.056 |
| 23.757 | 3.7421 | 8.3 | K2W3O10 | 3.7600 | 20.0 | 0 | 0 | 4 | 23.643 | –0.114 |
| 24.668 | 3.6060 | 17.9 | K2W3O10 | 3.6100 | 60.0 | –1 | 1 | 1 | 24.640 | –0.027 |
| 26.118 | 3.4091 | 30.1 | K2W3O10 | 3.4100 | 60.0 | –1 | 1 | 2 | 26.110 | –0.007 |
| 27.317 | 3.2620 | 7.4 | K2W3O10 | 3.2700 | 40.0 | 1 | 0 | 4 | 27.249 | –0.068 |
| 28.277 | 3.1534 | 100.0 | K2W3O10 | 3.1600 | 100.0 | –2 | 1 | 1 | 28.217 | –0.060 |
| 29.007 | 3.0757 | 76.3 | K2W3O10 | 3.0800 | 100.0 | –3 | 0 | 4 | 28.966 | –0.041 |
| 29.557 | 3.0197 | 56.1 | K2W3O10 | 3.0300 | 80.0 | 0 | 0 | 5 | 29.454 | –0.103 |
| 30.177 | 2.9591 | 13.5 | K2W3O10 | 2.9700 | 20.0 | 30.063 | –0.113 | |||
| 30.566a | 2.9223 | 2.2 | K2W3O10 | 2.914 | – | 2 | 1 | 1 | 30.657 | 0.091 |
| 32.017 | 2.7931 | 32.1 | K2W3O10 | 2.8000 | 70.0 | 3 | 0 | 2 | 31.936 | –0.081 |
| 33.247 | 2.6925 | 17.7 | K2W3O10 | 2.7000 | 60.0 | 0 | 1 | 4 | 33.152 | –0.094 |
| 33.947 | 2.6386 | 19.6 | K2W3O10 | 2.6300 | 60.0 | –3 | 1 | 2 | 34.061 | 0.115 |
| 34.926a | 2.5668 | 1.7 | K2W3O10 | 2.569 | – | 4 | 0 | 0 | 34.889 | –0.037 |
| 35.276a | 2.5422 | 1.8 | K2W3O10 | 2.543 | – | –4 | 0 | 4 | 35.260 | –0.016 |
| 36.196a | 2.4796 | 1.3 | K2W3O10 | 2.480 | – | 3 | 0 | 3 | 36.189 | –0.007 |
| 36.806 | 2.4399 | 33.5 | K2W3O10 | 2.4400 | 60.0 | –3 | 0 | 6 | 36.805 | –0.001 |
| 37.346 | 2.4059 | 22.3 | K2W3O10 | 2.4000 | 60.0 | –2 | 1 | 5 | 37.441 | 0.095 |
| 37.796 | 2.3782 | 18.5 | K2W3O10 | 2.3700 | 60.0 | –4 | 0 | 5 | 37.933 | 0.137 |
| 38.906 | 2.3129 | 4.8 | K2W3O10 | 2.3200 | 20.0 | 2 | 0 | 5 | 38.783 | –0.124 |
| 39.736a | 2.2665 | 1.8 | K2W3O10 | 2.267 | – | –2 | 0 | 7 | 39.718 | –0.018 |
| 40.756a | 2.2121 | 7.6 | K2W3O10 | 2.221, 2.203 | – | 4 3 | 0 0 | 2, 4 | 40.575, 40.923 | –0.177, 0.167 |
| 41.316 | 2.1834 | 13.9 | K2W3O10 | 2.1860 | 60.0 | 2 | 1 | 4 | 41.265 | –0.051 |
| 42.556 | 2.1226 | 2.5 | K2W3O10 | 2.1200 | 10.0 | –5 | 0 | 4 | 42.611 | 0.055 |
| 43.015a | 2.1010 | 3.4 | K2W3O10 | 2.106 | – | 0 | 1 | 6 | 42.902 | –0.113 |
| 44.035 | 2.0547 | 7.1 | K2W3O10 | 2.0500 | 40.0 | 5 | 0 | 0 | 44.141 | 0.105 |
| 44.786a | 2.0220 | 4.6 | K2W3O10 | 2.022 | – | –4 | 1 | 5 | 44.775 | –0.011 |
| 45.355 | 1.9979 | 3.9 | K2W3O10 | 1.9960 | 40.0 | –2 | 0 | 8 | 45.401 | 0.045 |
| 45.705 | 1.9834 | 6.9 | K2W3O10 | 1.9860 | 20.0 | 1 | 0 | 7 | 45.642 | –0.063 |
| 46.475a | 1.9523 | 5.8 | K2W3O10 | 1.951 | – | –1 | 1 | 7 | 46.500 | 0.025 |
| 47.155 | 1.9258 | 53.9 | K2W3O10 | 1.9280 | 20.0 | –5 | 0 | 6 | 47.097 | –0.058 |
| 47.855 | 1.8992 | 10.5 | K2W3O10 | 1.9070 | 20.0 | –4 | 1 | 6 | 47.647 | –0.208 |
| 48.465 | 1.8767 | 7.4 | K2W3O10 | 1.8700 | 20.0 | 2 | 2 | 2 | 48.650 | 0.186 |
| 49.565 | 1.8376 | 4.7 | K2W3O10 | 1.8300 | 20.0 | –4 | 0 | 8 | 49.785 | 0.220 |
a Reflections were indexed manually by calculating d-spacings and 2θ-angles for monoclinic cell of K2W3O10.
Phase composition of ammonium and potassium salts of [(ReO)3(AsW9O33)2]9– following thermal degradation
| Decomposition temperature (°C) | K-salt | (NH4)-salt |
| 600 | Potassium bronze (K2W3O10-type): a = 10.91(2) Å, b = 3.881(4) Å, c = 15.97(2) Å, β = 109.0(1)° | Mixture of two phases: hexagonal bronze: a = 7.324(7) Å, c = 7.519(7) Å; tetragonal bronze: a = 5.243(2) Å, c = 3.879(1) Å |
| 725 | Potassium bronze (K2W3O10-type): a = 10.86(2) Å, b = 3.866(5) Å, c = 15.96(2) Å, β = 109.0(1)° | Mixture of two phases: hexagonal bronze: a = 7.2890(5) Å, c = 7.5644(6) Å; tetragonal bronze: a = 5.2457(9) Å, c = 3.868(1) Å |
| 900 | Potassium bronze (WO3· ½ H2O pyrochlore-type): a = 10.172(3) Å | Mixture of two phases: hexagonal bronze: a = 7.316(4) Å, c = 7.545(3) Å; orthorhombic bronze: a = 7.372(5) Å, b = 7.499(5) Å, c = 3.860(3) Å |
Unit cell refinement results of a sample of K9[(ReO)3(AsW9O33)2]·n H2O heated to 600 °C in TGA apparatus under N2 atmosphere
| h | k | l | 2θ(cal) | 2θ(obs) | Δ(2θ) | d(cal) (Å) | d(obs) (Å) | Δ(d) (Å) |
| 0 | 0 | 2 | 11.712 | 11.739 | –0.027 | 7.5496 | 7.5323 | 0.0173 |
| –1 | 0 | 2 | 12.057 | 12.099 | –0.042 | 7.3344 | 7.3089 | 0.0255 |
| –2 | 0 | 1 | 16.236 | 16.189 | 0.048 | 5.4547 | 5.4706 | –0.0159 |
| –1 | 0 | 3 | 16.889 | 16.968 | –0.079 | 5.2452 | 5.2209 | 0.0243 |
| –2 | 0 | 2 | 17.368 | 17.479 | –0.111 | 5.1018 | 5.0696 | 0.0321 |
| 2 | 0 | 1 | 19.897 | 19.798 | 0.099 | 4.4586 | 4.4806 | –0.0220 |
| 1 | 0 | 3 | 22.005 | 21.858 | 0.147 | 4.0360 | 4.0628 | –0.0268 |
| –1 | 0 | 4 | 22.273 | 22.268 | 0.005 | 3.9880 | 3.9889 | –0.0009 |
| 0 | 1 | 0 | 22.896 | 22.988 | –0.092 | 3.8809 | 3.8656 | 0.0153 |
| 0 | 0 | 4 | 23.549 | 23.638 | –0.089 | 3.7748 | 3.7608 | 0.0140 |
| –1 | 1 | 1 | 24.520 | 24.578 | –0.057 | 3.6274 | 3.6190 | 0.0083 |
| –1 | 1 | 2 | 25.953 | 26.018 | –0.064 | 3.4303 | 3.4219 | 0.0083 |
| –2 | 1 | 1 | 28.197 | 28.187 | 0.010 | 3.1622 | 3.1633 | –0.0011 |
| –3 | 0 | 4 | 28.855 | 28.907 | –0.052 | 3.0916 | 3.0861 | 0.0055 |
| 0 | 0 | 5 | 29.556 | 29.417 | 0.139 | 3.0198 | 3.0338 | –0.0139 |
| 3 | 0 | 2 | 31.881 | 31.897 | –0.016 | 2.8047 | 2.8033 | 0.0014 |
| 0 | 1 | 4 | 33.078 | 33.137 | –0.059 | 2.7059 | 2.7012 | 0.0047 |
| –3 | 1 | 2 | 33.922 | 33.807 | 0.116 | 2.6405 | 2.6492 | –0.0088 |
| –3 | 0 | 6 | 36.730 | 36.676 | 0.054 | 2.4448 | 2.4483 | –0.0035 |
| –2 | 1 | 5 | 37.247 | 37.216 | 0.031 | 2.4120 | 2.4140 | –0.0019 |
| –4 | 0 | 5 | 37.758 | 37.656 | 0.102 | 2.3805 | 2.3868 | –0.0062 |
| 2 | 1 | 4 | 41.086 | 41.176 | –0.090 | 2.1951 | 2.1905 | 0.0046 |
| 5 | 0 | 0 | 43.834 | 43.865 | –0.031 | 2.0636 | 2.0622 | 0.0014 |
| –2 | 0 | 8 | 45.449 | 45.525 | –0.077 | 1.9940 | 1.9908 | 0.0032 |
| –5 | 0 | 6 | 46.956 | 46.935 | 0.021 | 1.9335 | 1.9343 | –0.0008 |
| –4 | 1 | 6 | 47.595 | 47.725 | –0.130 | 1.9090 | 1.9041 | 0.0049 |
| 0 | 2 | 2 | 48.392 | 48.295 | 0.097 | 1.8794 | 1.8829 | –0.0036 |
Unit cell refinement results for a sample of K9[(ReO)3(AsW9O33)2]·n H2O heated to 725 °C in DSC apparatus under N2 atmosphere
| h | k | l | 2θ(cal) | 2θ(obs) | Δ(2θ) | d(cal) (Å) | d(obs) (Å) | Δ(d) |
| 0 | 0 | 2 | 11.721 | 11.809 | –0.089 | 7.5441 | 7.4878 | 0.0563 |
| –1 | 0 | 2 | 12.072 | 12.199 | –0.127 | 7.3250 | 7.2493 | 0.0757 |
| –2 | 0 | 1 | 16.310 | 16.349 | –0.040 | 5.4302 | 5.4172 | 0.0131 |
| –1 | 0 | 3 | 16.900 | 17.009 | –0.109 | 5.2420 | 5.2086 | 0.0334 |
| –2 | 0 | 2 | 17.425 | 17.508 | –0.083 | 5.0851 | 5.0612 | 0.0239 |
| 2 | 0 | 1 | 19.985 | 19.829 | 0.157 | 4.4391 | 4.4738 | –0.0348 |
| 1 | 0 | 3 | 22.051 | 21.948 | 0.103 | 4.0277 | 4.0463 | –0.0187 |
| –1 | 0 | 4 | 22.283 | 22.358 | –0.075 | 3.9863 | 3.9730 | 0.0132 |
| 0 | 1 | 0 | 22.983 | 23.078 | –0.094 | 3.8664 | 3.8508 | 0.0156 |
| 0 | 0 | 4 | 23.566 | 23.757 | –0.191 | 3.7721 | 3.7421 | 0.0299 |
| –1 | 1 | 1 | 24.613 | 24.668 | –0.055 | 3.6140 | 3.6060 | 0.0080 |
| –1 | 1 | 2 | 26.038 | 26.118 | –0.079 | 3.4193 | 3.4091 | 0.0102 |
| –2 | 1 | 1 | 28.312 | 28.277 | 0.035 | 3.1496 | 3.1534 | –0.0038 |
| –3 | 0 | 4 | 28.927 | 29.007 | –0.080 | 3.0841 | 3.0757 | 0.0084 |
| 0 | 0 | 5 | 29.578 | 29.557 | 0.021 | 3.0177 | 3.0197 | –0.0021 |
| 3 | 0 | 2 | 32.017 | 32.017 | 0.000 | 2.7931 | 2.7931 | 0.0000 |
| 0 | 1 | 4 | 33.153 | 33.247 | –0.094 | 2.7000 | 2.6925 | 0.0074 |
| –3 | 1 | 2 | 34.061 | 33.947 | 0.114 | 2.6300 | 2.6386 | –0.0086 |
| –3 | 0 | 6 | 36.779 | 36.806 | –0.028 | 2.4417 | 2.4399 | 0.0018 |
| –2 | 1 | 5 | 37.323 | 37.346 | –0.023 | 2.4073 | 2.4059 | 0.0014 |
| –4 | 0 | 5 | 37.861 | 37.796 | 0.065 | 2.3743 | 2.3782 | –0.0039 |
| 2 | 1 | 4 | 41.215 | 41.316 | –0.101 | 2.1885 | 2.1834 | 0.0051 |
| –5 | 0 | 4 | 42.683 | 42.556 | 0.127 | 2.1166 | 2.1226 | –0.0060 |
| 5 | 0 | 0 | 44.058 | 44.035 | 0.023 | 2.0536 | 2.0547 | –0.0010 |
| –2 | 0 | 8 | 45.469 | 45.355 | 0.114 | 1.9931 | 1.9979 | –0.0048 |
| 1 | 0 | 7 | 45.704 | 45.705 | –0.001 | 1.9835 | 1.9834 | 0.0001 |
| –5 | 0 | 6 | 47.093 | 47.155 | –0.062 | 1.9281 | 1.9258 | 0.0024 |
| –4 | 1 | 6 | 47.720 | 47.855 | –0.135 | 1.9043 | 1.8992 | 0.0051 |
| 0 | 2 | 2 | 48.576 | 48.465 | 0.112 | 1.8727 | 1.8767 | –0.0040 |
| –4 | 0 | 8 | 49.749 | 49.565 | 0.184 | 1.8313 | 1.8376 | –0.0064 |
Unit cell refinement results for a sample of K9[(ReO)3(AsW9O33)2]·n H2O heated to 900 °C in TGA apparatus under N2 atmosphere
| h k l | 2θ(cal) | 2θ(obs) | Δ(2θ) | d(cal) (Å) | d(obs) (Å) | Δ(d) (Å) |
| 1 1 1 | 15.073 | 15.079 | –0.006 | 5.8730 | 5.8707 | 0.0022 |
| 3 1 1 | 29.091 | 28.937 | 0.154 | 3.0671 | 3.0830 | –0.0160 |
| 2 2 2 | 30.415 | 30.307 | 0.108 | 2.9365 | 2.9467 | –0.0102 |
| 4 0 0 | 35.263 | 35.246 | 0.017 | 2.5431 | 2.5442 | –0.0012 |
| 3 3 1 | 38.546 | 38.486 | 0.060 | 2.3337 | 2.3372 | –0.0035 |
| 5 1 1 | 46.341 | 46.255 | 0.086 | 1.9577 | 1.9611 | –0.0034 |
| 4 4 0 | 50.727 | 50.635 | 0.092 | 1.7982 | 1.8013 | –0.0031 |
| 5 3 1 | 53.229 | 53.185 | 0.045 | 1.7194 | 1.7208 | –0.0013 |
| 5 3 3 | 59.544 | 59.513 | 0.031 | 1.5513 | 1.5520 | –0.0007 |
| 6 2 2 | 60.304 | 60.332 | –0.028 | 1.5335 | 1.5329 | 0.0006 |
| 4 4 4 | 63.286 | 63.174 | 0.113 | 1.4682 | 1.4706 | –0.0024 |
| 7 1 1 | 65.473 | 65.373 | 0.100 | 1.4244 | 1.4263 | –0.0019 |
| 7 3 1 | 71.133 | 71.052 | 0.080 | 1.3243 | 1.3256 | –0.0013 |
| 8 0 0 | 74.571 | 74.762 | –0.190 | 1.2715 | 1.2688 | 0.0028 |
| 7 5 1 | 81.959 | 82.082 | –0.123 | 1.1746 | 1.1731 | 0.0014 |
| 6 6 2 | 82.622 | 82.581 | 0.041 | 1.1668 | 1.1673 | –0.0005 |
| 8 4 0 | 85.265 | 85.350 | –0.085 | 1.1373 | 1.1364 | 0.0009 |
Unit cell refinement results of hexagonal phase found in a sample of (NH4)9[(ReO)3(AsW9O33)2]·n H2O heated to 600 °C in TGA apparatus under N2 atmosphere
| h k l | 2θ(cal) | 2θ(obs) | Δ(2θ) | d(cal) (Å) | d(obs) (Å) | Δ(d) (Å) |
| 1 0 0 | 13.951 | 14.009 | –0.058 | 6.3428 | 6.3165 | 0.0263 |
| 0 0 2 | 23.648 | 23.938 | –0.290 | 3.7593 | 3.7143 | 0.0449 |
| 2 0 0 | 28.114 | 28.077 | 0.036 | 3.1714 | 3.1754 | –0.0040 |
| 1 1 2 | 34.153 | 34.107 | 0.046 | 2.6231 | 2.6266 | –0.0035 |
| 2 0 2 | 37.056 | 36.896 | 0.160 | 2.4240 | 2.4342 | –0.0101 |
| 2 1 2 | 44.801 | 45.085 | –0.284 | 2.0213 | 2.0092 | 0.0121 |
| 2 2 0 | 49.756 | 49.685 | 0.071 | 1.8310 | 1.8335 | –0.0024 |
| 3 1 0 | 51.935 | 51.855 | 0.080 | 1.7592 | 1.7617 | –0.0025 |
| 3 1 1 | 53.447 | 53.264 | 0.183 | 1.7129 | 1.7184 | –0.0055 |
| 1 1 4 | 54.856 | 55.094 | –0.238 | 1.6722 | 1.6656 | 0.0067 |
| 4 0 0 | 58.125 | 57.994 | 0.132 | 1.5857 | 1.5890 | –0.0033 |
| 4 0 2 | 63.635 | 63.473 | 0.161 | 1.4610 | 1.4644 | –0.0033 |
| 4 1 1 | 68.925 | 69.013 | –0.088 | 1.3612 | 1.3597 | 0.0015 |
| 2 2 4 | 71.930 | 71.882 | 0.048 | 1.3116 | 1.3123 | –0.0008 |
| 4 1 2 | 72.746 | 72.772 | –0.027 | 1.2989 | 1.2985 | 0.0004 |
| 0 0 6 | 75.861 | 75.792 | 0.069 | 1.2531 | 1.2541 | –0.0010 |
| 3 3 0 | 78.252 | 78.491 | –0.239 | 1.2207 | 1.2175 | 0.0031 |
| 5 0 2 | 79.710 | 79.691 | 0.019 | 1.2020 | 1.2022 | –0.0002 |
| 2 0 6 | 82.745 | 82.651 | 0.094 | 1.1654 | 1.1665 | –0.0011 |
| 3 3 2 | 83.129 | 83.166 | –0.037 | 1.1610 | 1.1606 | 0.0004 |
Unit cell refinement results of tetragonal phase found in a sample of (NH4)9[(ReO)3(AsW9O33)2]·n H2O heated to 600 °C in TGA apparatus under N2 atmosphere
| h k l | 2θ(cal) | 2θ(obs) | Δ(2θ) | d(cal) (Å) | d(obs) (Å) | Δ(d) (Å) |
| 0 0 1 | 22.908 | 22.938 | –0.030 | 3.8789 | 3.8739 | 0.0050 |
| 1 1 0 | 23.982 | 23.938 | 0.044 | 3.7076 | 3.7143 | –0.0067 |
| 1 0 1 | 28.602 | 28.637 | –0.035 | 3.1184 | 3.1146 | 0.0038 |
| 1 1 1 | 33.404 | 33.397 | 0.008 | 2.6802 | 2.6808 | –0.0006 |
| 2 0 0 | 34.172 | 34.107 | 0.066 | 2.6217 | 2.6266 | –0.0049 |
| 2 0 1 | 41.541 | 41.486 | 0.055 | 2.1721 | 2.1749 | –0.0028 |
| 1 2 1 | 45.145 | 45.085 | 0.059 | 2.0067 | 2.0092 | –0.0025 |
| 0 0 2 | 46.802 | 46.835 | –0.033 | 1.9394 | 1.9382 | 0.0013 |
| 2 2 0 | 49.103 | 48.975 | 0.128 | 1.8538 | 1.8584 | –0.0045 |
| 1 0 2 | 50.107 | 50.095 | 0.012 | 1.8190 | 1.8194 | –0.0004 |
| 1 1 2 | 53.259 | 53.264 | –0.005 | 1.7185 | 1.7184 | 0.0002 |
| 2 2 1 | 54.842 | 55.094 | –0.252 | 1.6726 | 1.6656 | 0.0071 |
| 3 0 1 | 57.814 | 57.994 | –0.180 | 1.5935 | 1.5890 | 0.0045 |
| 2 0 2 | 59.211 | 59.224 | –0.012 | 1.5592 | 1.5589 | 0.0003 |
| 1 3 1 | 60.692 | 60.673 | 0.018 | 1.5246 | 1.5251 | –0.0004 |
| 1 2 2 | 62.049 | 62.083 | –0.034 | 1.4945 | 1.4938 | 0.0007 |
| 2 3 1 | 68.898 | 69.013 | –0.114 | 1.3617 | 1.3597 | 0.0020 |
| 2 2 2 | 70.170 | 70.053 | 0.118 | 1.3401 | 1.3421 | –0.0020 |
| 4 0 0 | 71.976 | 71.882 | 0.094 | 1.3108 | 1.3123 | –0.0015 |
| 3 0 2 | 72.779 | 72.772 | 0.007 | 1.2984 | 1.2985 | –0.0001 |
| 1 0 3 | 75.700 | 75.792 | –0.092 | 1.2554 | 1.2541 | 0.0013 |
| 4 0 1 | 76.671 | 76.786 | –0.115 | 1.2419 | 1.2403 | 0.0016 |
| 1 1 3 | 78.238 | 78.491 | –0.253 | 1.2209 | 1.2175 | 0.0033 |
| 3 3 1 | 81.708 | 81.801 | –0.093 | 1.1776 | 1.1765 | 0.0011 |
| 4 2 0 | 82.140 | 82.161 | –0.021 | 1.1725 | 1.1722 | 0.0003 |
| 2 3 2 | 82.911 | 82.651 | 0.260 | 1.1635 | 1.1665 | –0.0030 |
| 2 0 3 | 83.251 | 83.166 | 0.085 | 1.1596 | 1.1606 | –0.0010 |
| 2 1 3 | 85.736 | 85.701 | 0.035 | 1.1322 | 1.1326 | –0.0004 |
Unit cell refinement results of hexagonal phase found in a sample of (NH4)9[(ReO)3(AsW9O33)2]·n H2O heated to 725 °C in DSC apparatus under N2 atmosphere
| h k l | 2θ(cal) | 2θ(obs) | Δ(2θ) | d(cal) (Å) | d(obs) (Å) | Δ(d) (Å) |
| 1 0 0 | 14.018 | 14.039 | –0.021 | 6.3125 | 6.3031 | 0.0094 |
| 0 0 2 | 23.502 | 23.528 | –0.026 | 3.7822 | 3.7781 | 0.0041 |
| 1 1 1 | 27.137 | 26.947 | 0.190 | 3.2833 | 3.3060 | –0.0227 |
| 1 1 2 | 34.136 | 34.147 | –0.010 | 2.6244 | 2.6236 | 0.0008 |
| 2 0 2 | 37.068 | 36.926 | 0.141 | 2.4233 | 2.4323 | –0.0089 |
| 2 1 2 | 44.880 | 45.115 | –0.235 | 2.0179 | 2.0080 | 0.0100 |
| 0 0 4 | 48.073 | 47.965 | 0.108 | 1.8911 | 1.8951 | –0.0040 |
| 3 0 2 | 49.532 | 49.655 | –0.123 | 1.8388 | 1.8345 | 0.0043 |
| 2 2 0 | 50.011 | 50.085 | –0.074 | 1.8223 | 1.8198 | 0.0025 |
| 1 0 4 | 50.327 | 50.314 | 0.013 | 1.8116 | 1.8120 | –0.0004 |
| 3 1 0 | 52.203 | 51.944 | 0.259 | 1.7508 | 1.7589 | –0.0081 |
| 3 1 1 | 53.692 | 53.504 | 0.189 | 1.7057 | 1.7113 | –0.0056 |
| 1 1 4 | 54.631 | 54.874 | –0.243 | 1.6786 | 1.6717 | 0.0069 |
| 2 0 4 | 56.697 | 56.634 | 0.064 | 1.6222 | 1.6239 | –0.0017 |
| 3 1 2 | 58.001 | 57.944 | 0.057 | 1.5888 | 1.5902 | –0.0014 |
| 4 0 0 | 58.431 | 58.164 | 0.268 | 1.5781 | 1.5848 | –0.0066 |
| 4 0 2 | 63.860 | 63.963 | –0.103 | 1.4564 | 1.4543 | 0.0021 |
| 3 0 4 | 66.412 | 66.402 | 0.009 | 1.4065 | 1.4067 | –0.0002 |
| 4 1 1 | 69.275 | 69.132 | 0.143 | 1.3552 | 1.3577 | –0.0024 |
| 2 2 4 | 71.891 | 71.942 | –0.051 | 1.3122 | 1.3114 | 0.0008 |
| 4 1 2 | 73.042 | 72.832 | 0.210 | 1.2943 | 1.2975 | –0.0032 |
| 3 1 4 | 73.677 | 73.662 | 0.015 | 1.2847 | 1.2850 | –0.0002 |
| 2 1 5 | 74.153 | 74.092 | 0.061 | 1.2777 | 1.2786 | –0.0009 |
| 5 0 0 | 75.197 | 75.242 | –0.046 | 1.2625 | 1.2618 | 0.0007 |
| 0 0 6 | 75.321 | 75.342 | –0.021 | 1.2607 | 1.2604 | 0.0003 |
| 3 2 3 | 75.668 | 75.612 | 0.057 | 1.2558 | 1.2566 | –0.0008 |
| 1 0 6 | 77.078 | 76.931 | 0.147 | 1.2363 | 1.2383 | –0.0020 |
| 3 3 0 | 78.700 | 78.641 | 0.059 | 1.2148 | 1.2156 | –0.0008 |
| 4 0 4 | 78.948 | 78.911 | 0.037 | 1.2117 | 1.2121 | –0.0005 |
| 4 1 3 | 79.165 | 79.321 | –0.156 | 1.2089 | 1.2069 | 0.0020 |
| 3 3 1 | 79.909 | 79.881 | 0.028 | 1.1995 | 1.1998 | –0.0004 |
| 4 2 1 | 81.638 | 81.686 | –0.048 | 1.1784 | 1.1778 | 0.0006 |
| 2 0 6 | 82.282 | 82.361 | –0.078 | 1.1708 | 1.1699 | 0.0009 |
| 2 2 5 | 82.867 | 82.931 | –0.064 | 1.1640 | 1.1633 | 0.0007 |
| 3 1 5 | 84.583 | 84.739 | –0.156 | 1.1447 | 1.1430 | 0.0017 |
| 5 1 0 | 85.594 | 85.701 | –0.107 | 1.1338 | 1.1326 | 0.0011 |
| 5 1 1 | 86.785 | 86.745 | 0.040 | 1.1212 | 1.1216 | –0.0004 |
Unit cell refinement results of tetragonal phase found in a sample of (NH4)9[(ReO)3(AsW9O33)2]·n H2O heated to 725 °C in DSC apparatus under N2 atmosphere
| h k l | 2θ(cal) | 2θ(obs) | Δ(2θ) | d(cal) (Å) | d(obs) (Å) | Δ(d) (Å) |
| 0 0 1 | 22.973 | 22.938 | 0.035 | 3.8681 | 3.8739 | –0.0059 |
| 1 1 0 | 23.971 | 23.978 | –0.007 | 3.7093 | 3.7082 | 0.0011 |
| 1 1 1 | 33.442 | 33.407 | 0.036 | 2.6772 | 2.6800 | –0.0028 |
| 2 0 0 | 34.157 | 34.147 | 0.010 | 2.6229 | 2.6236 | –0.0007 |
| 2 0 1 | 41.566 | 41.516 | 0.050 | 2.1709 | 2.1734 | –0.0025 |
| 1 2 1 | 45.165 | 45.115 | 0.049 | 2.0059 | 2.0080 | –0.0021 |
| 0 0 2 | 46.941 | 46.855 | 0.086 | 1.9340 | 1.9374 | –0.0034 |
| 2 2 0 | 49.079 | 49.035 | 0.044 | 1.8546 | 1.8562 | –0.0016 |
| 1 0 2 | 50.236 | 50.314 | –0.078 | 1.8146 | 1.8120 | 0.0026 |
| 1 1 2 | 53.380 | 53.294 | 0.086 | 1.7149 | 1.7175 | –0.0026 |
| 2 2 1 | 54.851 | 54.874 | –0.023 | 1.6723 | 1.6717 | 0.0006 |
| 1 3 0 | 55.336 | 55.304 | 0.032 | 1.6588 | 1.6597 | –0.0009 |
| 3 0 1 | 57.820 | 57.944 | –0.124 | 1.5933 | 1.5902 | 0.0031 |
| 2 0 2 | 59.319 | 59.094 | 0.225 | 1.5566 | 1.5620 | –0.0054 |
| 1 3 1 | 60.695 | 60.693 | 0.002 | 1.5246 | 1.5246 | 0.0000 |
| 1 2 2 | 62.152 | 62.003 | 0.148 | 1.4923 | 1.4955 | –0.0032 |
| 2 3 0 | 63.935 | 63.963 | –0.029 | 1.4549 | 1.4543 | 0.0006 |
| 2 3 1 | 68.895 | 68.922 | –0.028 | 1.3618 | 1.3613 | 0.0005 |
| 2 2 2 | 70.259 | 70.322 | –0.063 | 1.3386 | 1.3376 | 0.0010 |
| 4 0 0 | 71.939 | 71.942 | –0.003 | 1.3114 | 1.3114 | 0.0000 |
| 3 0 2 | 72.864 | 72.832 | 0.032 | 1.2971 | 1.2975 | –0.0005 |
| 1 3 2 | 75.433 | 75.452 | –0.019 | 1.2591 | 1.2589 | 0.0003 |
| 1 0 3 | 75.933 | 75.921 | 0.012 | 1.2521 | 1.2522 | –0.0002 |
| 4 0 1 | 76.661 | 76.672 | –0.011 | 1.2420 | 1.2418 | 0.0001 |
| 3 3 0 | 77.069 | 76.931 | 0.138 | 1.2364 | 1.2383 | –0.0019 |
| 1 1 3 | 78.467 | 78.521 | –0.055 | 1.2179 | 1.2172 | 0.0007 |
| 4 1 1 | 79.188 | 79.321 | –0.133 | 1.2086 | 1.2069 | 0.0017 |
| 3 3 1 | 81.694 | 81.686 | 0.008 | 1.1777 | 1.1778 | –0.0001 |
| 4 2 0 | 82.095 | 82.061 | 0.034 | 1.1730 | 1.1734 | –0.0004 |
| 2 3 2 | 82.984 | 82.931 | 0.053 | 1.1627 | 1.1633 | –0.0006 |
| 2 1 3 | 85.953 | 85.970 | –0.017 | 1.1299 | 1.1298 | 0.0002 |
Unit cell refinement results of hexagonal phase found in a sample of (NH4)9[(ReO)3(AsW9O33)2]·n H2O heated to 900 °C in TGA apparatus under N2 atmosphere
| t | 2θ(cal) | 2θ(obs) | Δ(2θ) | d(cal) (Å) | d(obs) (Å) | Δ(d) (Å) |
| 1 0 0 | 13.966 | 14.019 | –0.053 | 6.3359 | 6.3122 | 0.0237 |
| 0 0 2 | 23.560 | 23.568 | –0.007 | 3.7730 | 3.7718 | 0.0011 |
| 1 1 0 | 24.312 | 24.208 | 0.104 | 3.6580 | 3.6735 | –0.0155 |
| 1 0 2 | 27.491 | 27.527 | –0.036 | 3.2417 | 3.2376 | 0.0041 |
| 2 0 0 | 28.145 | 28.227 | –0.083 | 3.1680 | 3.1589 | 0.0091 |
| 1 1 2 | 34.110 | 34.167 | –0.056 | 2.6263 | 2.6221 | 0.0042 |
| 2 0 2 | 37.023 | 37.196 | –0.174 | 2.4261 | 2.4152 | 0.0109 |
| 3 0 0 | 42.781 | 42.945 | –0.165 | 2.1120 | 2.1043 | 0.0077 |
| 2 1 2 | 44.788 | 44.885 | –0.097 | 2.0219 | 2.0177 | 0.0042 |
| 3 0 2 | 49.413 | 49.480 | –0.067 | 1.8429 | 1.8406 | 0.0023 |
| 2 2 0 | 49.814 | 49.805 | 0.009 | 1.8290 | 1.8293 | –0.0003 |
| 1 0 4 | 50.432 | 50.355 | 0.077 | 1.8080 | 1.8106 | –0.0026 |
| 2 2 1 | 51.359 | 51.235 | 0.124 | 1.7776 | 1.7816 | –0.0040 |
| 3 1 0 | 51.996 | 52.134 | –0.138 | 1.7573 | 1.7529 | 0.0043 |
| 2 1 3 | 52.734 | 52.654 | 0.079 | 1.7344 | 1.7368 | –0.0024 |
| 3 1 1 | 53.496 | 53.554 | –0.058 | 1.7115 | 1.7098 | 0.0017 |
| 1 1 4 | 54.699 | 54.555 | 0.144 | 1.6767 | 1.6807 | –0.0041 |
| 2 2 2 | 55.812 | 55.774 | 0.037 | 1.6458 | 1.6468 | –0.0010 |
| 2 0 4 | 56.748 | 56.664 | 0.084 | 1.6209 | 1.6231 | –0.0022 |
| 3 1 2 | 57.835 | 57.864 | –0.029 | 1.5930 | 1.5922 | 0.0007 |
| 4 0 0 | 58.195 | 58.184 | 0.011 | 1.5840 | 1.5842 | –0.0003 |
| 2 1 4 | 62.636 | 62.483 | 0.153 | 1.4819 | 1.4852 | –0.0033 |
| 4 0 2 | 63.661 | 63.713 | –0.052 | 1.4605 | 1.4594 | 0.0011 |
| 3 2 0 | 64.001 | 63.993 | 0.008 | 1.4536 | 1.4537 | –0.0002 |
| 3 0 4 | 66.389 | 66.433 | –0.043 | 1.4069 | 1.4061 | 0.0008 |
| 1 1 5 | 67.026 | 67.123 | –0.097 | 1.3951 | 1.3933 | 0.0018 |
| 4 1 0 | 67.714 | 67.662 | 0.052 | 1.3826 | 1.3835 | –0.0009 |
| 3 2 2 | 69.207 | 69.413 | –0.206 | 1.3564 | 1.3529 | 0.0035 |
| 4 1 2 | 72.790 | 72.692 | 0.098 | 1.2982 | 1.2997 | –0.0015 |
| 3 1 4 | 73.604 | 73.482 | 0.122 | 1.2858 | 1.2877 | –0.0018 |
| 2 1 5 | 74.212 | 73.932 | 0.280 | 1.2768 | 1.2809 | –0.0041 |
| 0 0 6 | 75.537 | 75.682 | –0.145 | 1.2577 | 1.2556 | 0.0020 |
| 4 1 3 | 78.949 | 79.151 | –0.202 | 1.2116 | 1.2090 | 0.0026 |
| 3 3 1 | 79.570 | 79.631 | –0.061 | 1.2037 | 1.2030 | 0.0008 |
| 4 2 0 | 80.078 | 80.111 | –0.033 | 1.1974 | 1.1970 | 0.0004 |
| 1 1 6 | 80.731 | 80.591 | 0.139 | 1.1893 | 1.1910 | –0.0017 |
| 4 2 1 | 81.288 | 81.083 | 0.205 | 1.1826 | 1.1851 | –0.0025 |
| 2 0 6 | 82.443 | 82.481 | –0.038 | 1.1689 | 1.1685 | 0.0004 |
| 2 2 5 | 82.861 | 83.021 | –0.160 | 1.1641 | 1.1622 | 0.0018 |
| 3 2 4 | 83.978 | 83.911 | 0.067 | 1.1514 | 1.1522 | –0.0007 |
| 3 1 5 | 84.565 | 84.430 | 0.135 | 1.1449 | 1.1464 | –0.0015 |
| 4 2 2 | 84.897 | 84.930 | –0.034 | 1.1413 | 1.1409 | 0.0004 |
| 5 1 1 | 86.400 | 86.350 | 0.050 | 1.1252 | 1.1258 | –0.0005 |
| 2 1 6 | 87.545 | 87.560 | –0.015 | 1.1134 | 1.1133 | 0.0002 |
Unit cell refinement results of orthorhombic phase found in a sample of (NH4)9[(ReO)3(AsW9O33)2]·n H2O heated to 900 °C in TGA apparatus under N2 atmosphere
| h k l | 2θ(cal) | 2θ(obs) | Δ(2θ) | d(cal) (Å) | d(obs) (Å) | Δ(d) (Å) |
| 0 0 1 | 23.024 | 23.088 | –0.063 | 3.8596 | 3.8492 | 0.0104 |
| 0 2 0 | 23.710 | 23.747 | –0.037 | 3.7495 | 3.7437 | 0.0057 |
| 2 0 0 | 24.124 | 24.208 | –0.084 | 3.6860 | 3.6735 | 0.0125 |
| 0 1 1 | 25.942 | 26.027 | –0.085 | 3.4317 | 3.4207 | 0.0110 |
| 1 2 0 | 26.651 | 26.687 | –0.036 | 3.3420 | 3.3376 | 0.0045 |
| 1 1 1 | 28.670 | 28.687 | –0.018 | 3.1111 | 3.1093 | 0.0019 |
| 0 2 1 | 33.287 | 33.267 | 0.020 | 2.6894 | 2.6909 | –0.0016 |
| 2 0 1 | 33.592 | 33.637 | –0.045 | 2.6657 | 2.6622 | 0.0034 |
| 2 2 0 | 34.080 | 34.167 | –0.086 | 2.6286 | 2.6221 | 0.0064 |
| 1 2 1 | 35.502 | 35.586 | –0.084 | 2.5265 | 2.5207 | 0.0058 |
| 2 2 1 | 41.532 | 41.586 | –0.054 | 2.1726 | 2.1699 | 0.0027 |
| 0 3 1 | 43.079 | 42.945 | 0.133 | 2.0981 | 2.1043 | –0.0062 |
| 3 2 0 | 44.021 | 44.135 | –0.114 | 2.0553 | 2.0502 | 0.0050 |
| 1 3 1 | 44.880 | 44.885 | –0.005 | 2.0179 | 2.0177 | 0.0002 |
| 3 1 1 | 45.354 | 45.465 | –0.111 | 1.9979 | 1.9933 | 0.0046 |
| 0 0 2 | 47.051 | 47.035 | 0.016 | 1.9298 | 1.9304 | –0.0006 |
| 0 4 0 | 48.520 | 48.585 | –0.065 | 1.8747 | 1.8724 | 0.0024 |
| 4 0 0 | 49.410 | 49.480 | –0.070 | 1.8430 | 1.8406 | 0.0025 |
| 1 1 2 | 50.326 | 50.355 | –0.028 | 1.8116 | 1.8106 | 0.0010 |
| 2 0 2 | 53.558 | 53.554 | 0.003 | 1.7096 | 1.7098 | –0.0001 |
| 0 4 1 | 54.359 | 54.334 | 0.025 | 1.6863 | 1.6870 | –0.0007 |
| 2 4 0 | 54.899 | 54.964 | –0.065 | 1.6710 | 1.6692 | 0.0018 |
| 4 2 0 | 55.512 | 55.434 | 0.078 | 1.6540 | 1.6561 | –0.0021 |
| 1 4 1 | 55.884 | 55.774 | 0.110 | 1.6439 | 1.6468 | –0.0030 |
| 3 3 1 | 57.730 | 57.864 | –0.134 | 1.5956 | 1.5922 | 0.0034 |
| 2 2 2 | 59.363 | 59.283 | 0.079 | 1.5556 | 1.5575 | –0.0019 |
| 2 4 1 | 60.306 | 60.364 | –0.057 | 1.5335 | 1.5321 | 0.0013 |
| 4 2 1 | 60.884 | 60.743 | 0.141 | 1.5203 | 1.5235 | –0.0032 |
| 3 4 0 | 62.235 | 62.014 | 0.221 | 1.4905 | 1.4953 | –0.0048 |
| 4 3 0 | 62.566 | 62.483 | 0.083 | 1.4834 | 1.4852 | –0.0018 |
The powder diffraction pattern of the potassium salt heated to 900 °C differs significantly from the patterns collected for samples decomposed at lower temperatures. Since the TGA curve does not show any stepwise weight loss between 725 and 950 °C, the observed change of phase composition suggests an existence of a phase transition in this temperature interval. A search on the powder diffraction database shows that the observed powder diffraction pattern corresponds to those of hydrated tungsten oxide WO3·0.5H2O and a number of substituted tungsten bronzes, KCr0.33W1.67O6 with pyrochlore-type structures (Fig. 5; Section 5, Table S3) [21].
Pyrochlore-type structure viewed perpendicular to the (110) plane, showing locations of potassium cations (gray spheres).
Phase identification for a sample of K9[(ReO)3(AsW9O33)2]·n H2O heated to 900 °C in TGA apparatus under nitrogen atmosphere
| 2θ(obs) | d(obs) (Å) | I(obs) (%) | Phase ID | d(card) (Å) | I(card) (%) | h k l | 2θ(card) | Δ(2θ) |
| 14.089 | 6.2810 | 3.4 | ||||||
| 15.079 | 5.8707 | 100.0 | KCr0.33W1.67O6 | 5.8800 | 100.0 | 1 1 1 | 15.055 | –0.024 |
| 21.498 | 4.1300 | 8.1 | ||||||
| 23.858 | 3.7266 | 4.9 | ||||||
| 27.687 | 3.2193 | 2.1 | ||||||
| 28.317 | 3.1490 | 5.6 | Si | 3.13549 | 1 1 1 | 28.4423 | 0.1253 | |
| 28.937 | 3.0830 | 24.4 | KCr0.33W1.67O6 | 3.0700 | 100.0 | 3 1 1 | 29.062 | 0.125 |
| 30.307 | 2.9467 | 13.2 | KCr0.33W1.67O6 | 2.9400 | 85.0 | 2 2 2 | 30.378 | 0.070 |
| 34.346 | 2.6088 | 1.6 | ||||||
| 35.246 | 2.5442 | 2.2 | KCr0.33W1.67O6 | 2.5460 | 15.0 | 4 0 0 | 35.221 | –0.025 |
| 37.306 | 2.4083 | 2.5 | ||||||
| 38.486 | 2.3372 | 1.6 | KCr0.33W1.67O6 | 2.3370 | 15.0 | 3 3 1 | 38.489 | 0.003 |
| 46.255 | 1.9611 | 1.8 | KCr0.33W1.67O6 | 1.9600 | 35.0 | 5 1 1 | 46.283 | 0.027 |
| 47.235 | 1.9227 | 8.9 | Si | 1.9201 | 2 2 0 | 47.3027 | 0.068 | |
| 48.035 | 1.8925 | 26.3 | ||||||
| 50.635 | 1.8013 | 3.9 | KCr0.33W1.67O6 | 1.8000 | 50.0 | 4 4 0 | 50.673 | 0.038 |
| 53.185 | 1.7208 | 3.1 | KCr0.33W1.67O6 | 1.7220 | 30.0 | 5 3 1 | 53.143 | –0.041 |
| 56.314 | 1.6323 | 1.8 | Si | 1.63745 | 3 1 1 | 56.1222 | –0.192 | |
| 57.084 | 1.6121 | 1.5 | ||||||
| 59.513 | 1.5520 | 2.3 | KCr0.33W1.67O6 | 1.5550 | 15.0 | 5 3 3 | 59.387 | –0.127 |
| 60.332 | 1.5329 | 3.8 | KCr0.33W1.67O6 | 1.5370 | 40.0 | 6 2 2 | 60.153 | –0.179 |
| 63.174 | 1.4706 | 0.7 | KCr0.33W1.67O6 | 1.4720 | 10.0 | 4 4 4 | 63.106 | –0.067 |
| 63.523 | 1.4633 | 1.4 | ||||||
| 65.373 | 1.4263 | 2.9 | KCr0.33W1.67O6 | 1.4290 | 20.0 | 7 1 1 | 65.236 | –0.137 |
| 71.052 | 1.3256 | 2.0 | KCr0.33W1.67O6 | 1.3290 | 25.0 | 7 3 1 | 70.844 | –0.208 |
| 71.372 | 1.3205 | 1.0 | ||||||
| 74.762 | 1.2688 | 3.4 | ||||||
| 81.611 | 1.1787 | 0.9 | KCr0.33W1.67O6 | 1.1780 | 5.0 | 7 5 1 | 81.671 | 0.060 |
| 82.581 | 1.1673 | 2.1 | KCr0.33W1.67O6 | 1.1700 | 20.0 | 6 6 2 | 82.350 | –0.231 |
| 84.931 | 1.1409 | 0.6 | KCr0.33W1.67O6 | 1.1400 | 15.0 | 8 4 0 | 85.015 | 0.084 |
A rough estimate of the rhenium contribution to the intensity of diffraction, based on the formula of the decomposed product, shows that rhenium should contribute about {3(Re)/[18(W) + 8 × 69(O)/74 + 19 × 9(K)/74]} × 100% ≈ 11% of total diffraction intensity. The intensities of the unidentified peaks increase with increase of temperature, for example, the reflection with d = 4.13 Å increases from 5.9% at 600 °C to 18% at 725 and 900 °C, which probably indicates decomposition of the monoclinic phase and formation of a cubic phase. At 600 °C, according to this estimate, a considerable part of the rhenium should be in the monoclinic phase, but it is unclear how much rhenium, if any is contained in the monoclinic, or cubic phase at the higher temperature.
A powder diffraction study of decomposition products resulting from heating the ammonium salt of 1 to 725 °C, shows two different crystallographic phases corresponding to hexagonal [22,23] and tetragonal [24] bronzes (Fig. 6, Tables 1, S4 and S5). As for the potassium salt a few low-intensity reflections could not be identified as known rhenium oxides and bronzes [18,20–22,25], or indexed in either tetragonal [24] or hexagonal [22,23] cell settings. A rough estimate of the rhenium contribution to the intensity of diffraction on the basis of decomposition product’s formula: Re1.9W12O41 suggests that rhenium should contribute about: {2(Re)/[12(W) + 8 × 41(O)/74]} × 100% ≈ 12% of observed diffraction intensity, which is about three times greater than the most intense non-identified peak: 3.9% (Tables S4 and S5). This estimate suggests that considerable part of rhenium is incorporated into the observed tetragonal and hexagonal phases.
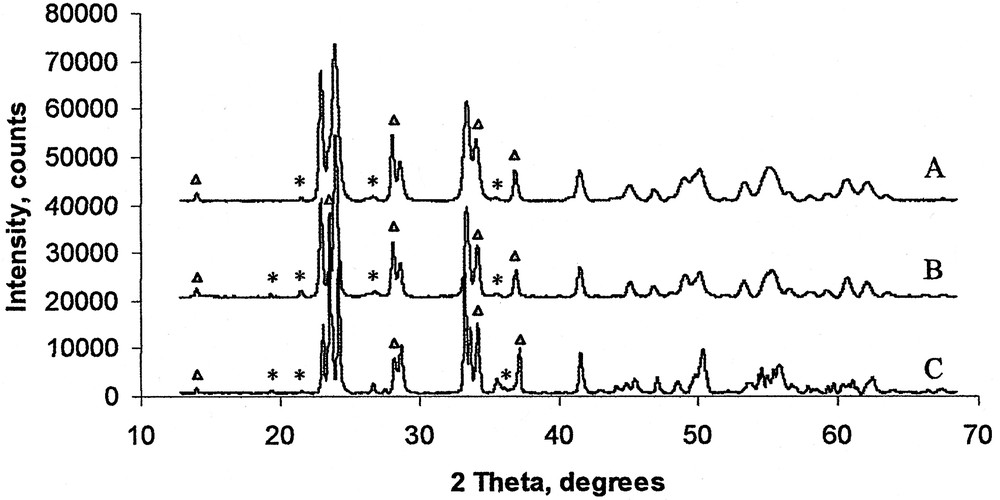
Powder diffractograms of (NH4)9[(ReO)3(AsW9O33)2]·n H2O heated to 600 °C (A), 725 °C (B), and 900 °C. (*) Unidentified reflections. (Δ) Reflections from the hexagonal phase.
Phase identification for a sample of (NH4)9[(ReO)3(AsW9O33)2]·n H2O heated to 600 °C in TGA apparatus under N2 atmosphere
| 2θ(obs) | d(obs) (Å) | I(obs) (%) | Phase ID | d(card) (Å) | I(card) (%) | h k l | 2θ(card) | Δ(2θ) |
| 14.009 | 6.3165 | 5.2 | hexagonala | 6.3264 | 53.0 | 1 0 0 | 13.987 | –0.022 |
| 21.518 | 4.1263 | 2.5 | ||||||
| 22.938 | 3.8739 | 84.5 | tetragonalb | 3.8600 | 70.0 | 0 0 1 | 23.022 | 0.084 |
| 23.938 | 3.7143 | 100.0 | tetragonal | 3.7100 | 100.0 | 1 1 0 | 23.966 | 0.028 |
| 26.278 | 3.3887 | 2.4 | ||||||
| 26.677 | 3.3388 | 3.4 | ||||||
| 28.077 | 3.1754 | 42.6 | hexagonal | 3.1642 | 100.0 | 2 0 0 | 28.179 | 0.102 |
| 28.637 | 3.1146 | 24.3 | tetragonal | 3.1100 | 30.0 | 1 0 1 | 28.680 | 0.043 |
| 33.397 | 2.6808 | 64.1 | tetragonal | 2.6730 | 60.0 | 1 1 1 | 33.497 | 0.100 |
| 34.107 | 2.6266 | 38.7 | hexagonal | 2.6245 | 14.0 | 1 1 2 | 34.135 | 0.028 |
| 35.587 | 2.5207 | 1.3 | ||||||
| 36.896 | 2.4342 | 19.4 | hexagonal | 2.4244 | 42.0 | 2 0 2 | 37.051 | 0.155 |
| 41.486 | 2.1749 | 19.6 | tetragonal | 2.1700 | 25.0 | 2 0 1 | 41.583 | 0.097 |
| 45.085 | 2.0092 | 9.0 | tetragonal | 2.0050 | 12.0 | 2 1 1 | 45.186 | 0.100 |
| 46.835 | 1.9382 | 7.9 | tetragonal | 1.9290 | 8.0 | 0 0 2 | 47.071 | 0.236 |
| 47.964 | 1.8951 | 0.9 | hexagonal | 1.8859 | 9.0 | 0 0 4 | 48.213 | 0.249 |
| 48.975 | 1.8584 | 12.2 | tetragonal | 1.8540 | 16.0 | 2 2 0 | 49.098 | 0.123 |
| 49.685 | 1.8335 | 8.4 | hexagonal | 1.8269 | 33.0 | 2 2 0 | 49.875 | 0.190 |
| 50.095 | 1.8194 | 19.3 | tetragonal | 1.811 | 33.0 | 1 0 2 | 50.344 | 0.249 |
| 51.855 | 1.7617 | 1.2 | hexagonal | 1.7553 | 6.0 | 3 1 0 | 52.058 | 0.203 |
| 53.264 | 1.7184 | 12.2 | tetragonal | 1.7130 | 12.0 | 1 1 2 | 53.445 | 0.180 |
| 55.094 | 1.6656 | 17.7 | tetragonal | 1.6720 | 14.0 | 2 2 1 | 54.864 | –0.230 |
| 56.474 | 1.6281 | 5.4 | hexagonal | 1.6206 | 15.0 | 2 0 4 | 56.760 | 0.286 |
| 57.994 | 1.5890 | 3.8 | hexagonal | 1.5915 | 8.0 | 3 1 2 | 57.894 | –0.100 |
| 59.224 | 1.5589 | 3.4 | tetragonal | 1.5550 | 8.0 | 2 0 2 | 59.387 | 0.163 |
| 60.673 | 1.5251 | 9.5 | tetragonal | 1.5240 | 20.0 | 3 1 1 | 60.720 | 0.047 |
| 62.083 | 1.4938 | 8.5 | tetragonal | 1.4910 | 14.0 | 2 1 2 | 62.212 | 0.128 |
a Hexagonal diffraction pattern is compared with the diffraction pattern of hexagonal KAl0.33W2.67O9 (a = 7.307 Å, c = 7.546 Å).
b Tetragonal diffraction pattern is compared with a diffraction pattern of tetragonal Ca0.035WO3 (a = 5.246 Å, c = 3.858 Å).
Phase identification for a sample of (NH4)9[(ReO)3(AsW9O33)2]·n H2O heated to 725 °C in DSC apparatus under N2 atmosphere
| 2θ(obs) | d(obs) (Å) | I(obs) (%) | Phase ID | d(card) (Å) | I(card) (%) | h k l | 2θ(card) | Δ(2θ) |
| 14.039 | 6.3031 | 4.3 | hexagonala | 6.3264 | 53.0 | 1 0 0 | 13.987 | –0.052 |
| 19.368 | 4.5791 | 1.5 | ||||||
| 21.498 | 4.1300 | 3.9 | ||||||
| 22.938 | 3.8739 | 60.9 | tetragonalb | 3.8600 | 70.0 | 0 0 1 | 23.022 | 0.084 |
| 23.528 | 3.7781 | 16.9 | hexagonal | 3.7730 | 33.0 | 0 0 2 | 23.560 | 0.032 |
| 23.978 | 3.7082 | 100.0 | tetragonal | 3.7100 | 100.0 | 1 1 0 | 23.966 | –0.012 |
| 26.818 | 3.3217 | 2.7 | ||||||
| 28.107 | 3.1721 | 33.2 | hexagonal | 3.1642 | 100.0 | 2 0 0 | 28.179 | 0.072 |
| 28.617 | 3.1167 | 20.7 | tetragonal | 3.1100 | 30.0 | 1 0 1 | 28.680 | 0.063 |
| 33.407 | 2.6800 | 55.1 | tetragonal | 2.6730 | 60.0 | 1 1 1 | 33.497 | 0.090 |
| 34.147 | 2.6236 | 31.7 | tetragonal | 2.6240 | 45.0 | 2 0 0 | 34.141 | –0.005 |
| 35.526 | 2.5248 | 1.5 | ||||||
| 35.646 | 2.5166 | 1.3 | ||||||
| 36.926 | 2.4323 | 16.5 | hexagonal | 2.4244 | 42.0 | 2 0 2 | 37.051 | 0.125 |
| 41.516 | 2.1734 | 18.6 | tetragonal | 2.1700 | 25.0 | 2 0 1 | 41.583 | 0.067 |
| 45.115 | 2.0080 | 9.0 | tetragonal | 2.0050 | 12.0 | 2 1 1 | 45.186 | 0.070 |
| 46.855 | 1.9374 | 6.5 | tetragonal | 1.9290 | 8.0 | 0 0 2 | 47.071 | 0.216 |
| 47.965 | 1.8951 | 1.5 | hexagonal | 1.8859 | 9.0 | 0 0 4 | 48.213 | 0.248 |
| 49.035 | 1.8562 | 12.0 | tetragonal | 1.8540 | 16.0 | 2 2 0 | 49.098 | 0.063 |
| 49.655 | 1.8345 | 5.1 | hexagonal | 1.8413 | 6.0 | 3 0 2 | 49.460 | –0.195 |
| 50.085 | 1.8198 | 13.7 | hexagonal | 1.8269 | 33.0 | 2 2 0 | 49.875 | –0.210 |
| 50.314 | 1.8120 | 9.7 | tetragonal | 1.8110 | 20.0 | 1 0 2 | 50.344 | 0.030 |
| 51.944 | 1.7589 | 1.1 | hexagonal | 1.7553 | 6.0 | 3 1 0 | 52.058 | 0.114 |
| 53.294 | 1.7175 | 9.3 | tetragonal | 1.7130 | 12.0 | 1 1 2 | 53.445 | 0.150 |
| 53.504 | 1.7113 | 5.9 | hexagonal | 1.7099 | 1.0 | 3 1 1 | 53.550 | 0.046 |
| 54.874 | 1.6717 | 13.3 | tetragonal | 1.6720 | 14.0 | 2 2 1 | 54.864 | –0.011 |
| 55.304 | 1.6597 | 15.4 | tetragonal | 1.6590 | 20.0 | 3 1 0 | 55.330 | 0.026 |
| 56.634 | 1.6239 | 3.3 | hexagonal | 1.6206 | 15.0 | 2 0 4 | 56.760 | 0.126 |
| 57.944 | 1.5902 | 3.0 | hexagonal | 1.5915 | 8.0 | 3 1 2 | 57.894 | –0.050 |
| 58.164 | 1.5848 | 2.8 | hexagonal | 1.5823 | 15.0 | 4 0 0 | 58.264 | 0.100 |
| 59.094 | 1.5620 | 3.5 | tetragonal | 1.5550 | 8.0 | 2 0 2 | 59.387 | 0.293 |
| 60.693 | 1.5246 | 12.1 | tetragonal | 1.5240 | 20.0 | 3 1 1 | 60.720 | 0.027 |
a Hexagonal diffraction pattern is compared with the diffraction pattern of hexagonal KAl0.33W2.67O9 (a = 7.307 Å, c = 7.546 Å).
b Tetragonal diffraction pattern is compared with a diffraction pattern of tetragonal Ca0.035WO3 (a = 5.246 Å, c = 3.858 Å).
The hexagonal bronze structure is formed of WO6 octahedra connected by vertices (Fig. 7). Cations reside inside the large channels. The hexagonal structural framework is stable even if channels are empty, so that a hexagonal tungsten oxide (WO3) structure exists [22,23]. The tetragonal bronze structure is similar to the structure of perovskite [24,25]. The perovskite structure consists of a framework of WO6 octahedra connected by vertices (Fig. 8). This forms a cubic-type 3D structure, with interconnected pores partially occupied by cations. Since the tungsten octahedra are distorted, there is a deviation from ideal cubic symmetry. The a-axis of the smallest tetragonal cell is equal to the face diagonal of the cubic cell (a = 3.8 × √2 ≈ 5.22 Å). Some tetragonal bronzes have been indexed on the basis of a larger tetragonal cell with a ~ 7.4 Å, which approximately equals 2a for the cubic cell (Fig. 8). For both tetragonal cell types c (~3.8 Å) is close to the parameter for the cubic cell. Structures with orthorhombic or monoclinic symmetry with unit cells close to the larger tetragonal cell have also been reported [26,27]. Decomposition products found at 600 and 725 °C could be indexed on the basis of both tetragonal cells with a cell parameter of either ~5.22 Å (‘Ca0.035WO3’) or ~7.4 Å (‘H0.23WO3’), which in fact represent the same perovskite-type structure.
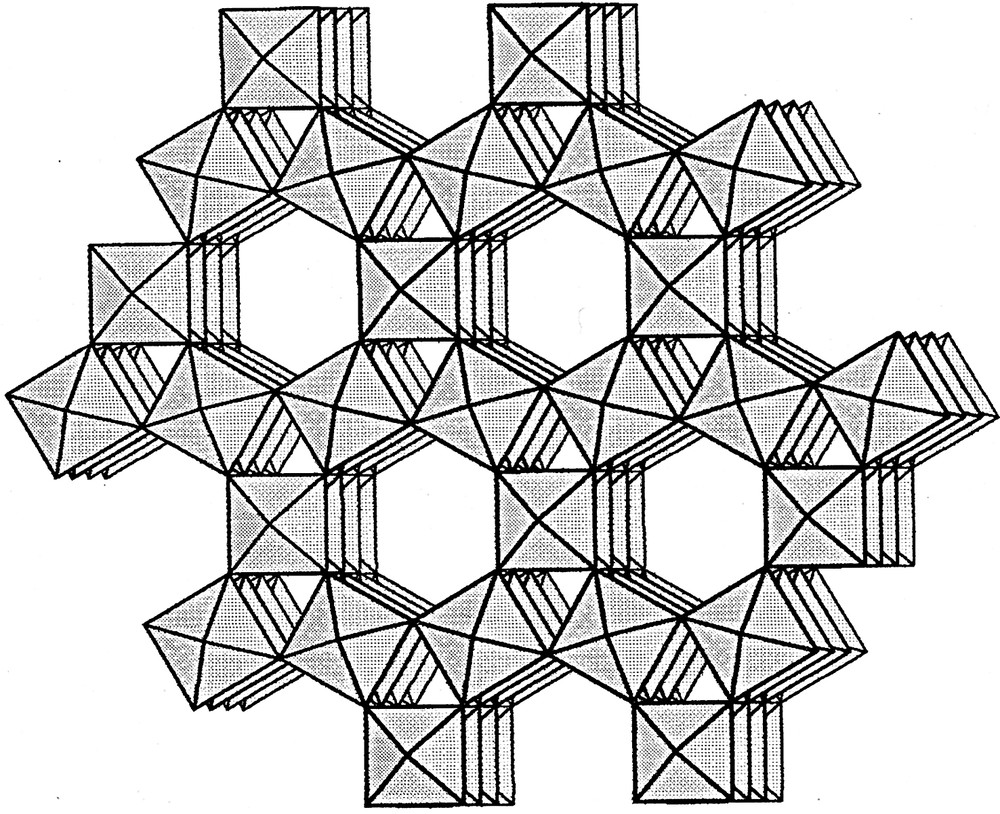
Structure of hexagonal tungsten bronze (oxide) showing the channels parallel to the crystallographic c-axis.

Structure of tetragonal tungsten bronze (oxide). A, a perspective along the c-axis. B, relationship between different lattice cell types. Perovskite-type cubic cell (a ~ 3.7 Å) is shown by dashed line; smallest tetragonal cell (a ~ 5.2 Å) is shown by continuous line; larger tetragonal cell (a ~ 7.4 Å) is shown by another type of dashed line. Crystallographic c-axis is perpendicular to the plane of paper.
Sleight and Gillson [16] studied formation of WO3–ReO3 solid solutions. They found cubic (a = 3.7574 Å), perovskite-type phases, similar to the tetragonal (orthorhombic) phase observed for the decomposition of ammonium salt of 1.
As for the potassium salt, a change in powder diffraction pattern was observed for a sample decomposed at 900 °C. Search of a match in the powder diffraction database shows a mixture of hexagonal (also observed at lower temperatures) and orthorhombic phases.
The lattice parameters of the orthorhombic compound are very similar to those of the tetragonal compound, suggesting a deformation of the tetragonal lattice. Orthorhombic deformation of a tetragonal lattice is easily demonstrated by splitting of the (1 1 0) reflection of the tetragonal phase (3.71, 100%, Tables S4 and S5) into the (0 2 0), (2 0 0) reflections of the orthorhombic phase (3.74, 38%; 3.67, 74%, Table S6).
Phase identification for a sample of (NH4)9[(ReO)3(AsW9O33)2]·n H2O heated to 900 °C in TGA apparatus under N2 atmosphere
| 2θ(obs) | d(obs) (Å) | I(obs) (%) | Phase ID | d(card) (Å) | I(card) (%) | h k l | 2θ(card) | Δ(2θ) |
| 14.019 | 6.3122 | 3.2 | hexagonala | 6.3264 | 53.0 | 1 0 0 | 13.987 | –0.032 |
| 19.329 | 4.5884 | 1.6 | ||||||
| 21.508 | 4.1282 | 1.1 | ||||||
| 23.088 | 3.8492 | 37.9 | orthorhombicb | 3.8500 | 100.0 | 0 0 1 | 23.082 | –0.005 |
| 23.568 | 3.7718 | 100.0 | hexagonal | 3.7730 | 33.0 | 0 0 2 | 23.560 | –0.008 |
| 23.747 | 3.7437 | 37.9 | orthorhombic | 3.7500 | 65.0 | 0 2 0 | 23.707 | –0.040 |
| 24.208 | 3.6735 | 74.4 | orthorhombic | 3.6900 | 95.0 | 2 0 0 | 24.098 | –0.110 |
| 26.027 | 3.4207 | 0.5 | orthorhombic | 3.4300 | 2.0 | 0 1 1 | 25.955 | –0.072 |
| 26.687 | 3.3376 | 5.4 | orthorhombic | 3.3500 | 10.0 | 1 2 0 | 26.586 | –0.101 |
| 27.527 | 3.2376 | 2.0 | hexagonal | 3.2408 | 20.0 | 1 0 2 | 27.500 | –0.027 |
| 28.227 | 3.1589 | 18.6 | hexagonal | 3.1642 | 100.0 | 2 0 0 | 28.179 | –0.048 |
| 28.687 | 3.1093 | 26.6 | orthorhombic | 3.1000 | 25.0 | 1 1 1 | 28.775 | 0.088 |
| 33.267 | 2.6909 | 66.2 | orthorhombic | 2.6860 | 35.0 | 0 2 1 | 33.330 | 0.063 |
| 33.637 | 2.6622 | 35.4 | orthorhombic | 2.6620 | 35.0 | 2 0 1 | 33.639 | 0.003 |
| 34.167 | 2.6221 | 38.5 | hexagonal | 2.6245 | 14.0 | 1 1 2 | 34.135 | –0.032 |
| 35.586 | 2.5207 | 7.5 | orthorhombic | 2.5250 | 6.0 | 1 2 1 | 35.524 | –0.063 |
| 36.126 | 2.4843 | 1.5 | ||||||
| 37.196 | 2.4152 | 23.8 | hexagonal | 2.4244 | 42.0 | 2 0 2 | 37.051 | –0.145 |
| 41.586 | 2.1699 | 21.7 | orthorhombic | 2.1730 | 16.0 | 2 2 1 | 41.523 | –0.063 |
| 42.945 | 2.1043 | 1.4 | hexagonal | 2.1095 | 5.0 | 3 0 0 | 42.834 | –0.111 |
| 44.135 | 2.0502 | 2.9 | orthorhombic | 2.0560 | 2.0 | 3 2 0 | 44.005 | –0.130 |
| 44.355 | 2.0406 | 1.4 | ||||||
| 44.885 | 2.0177 | 4.7 | orthorhombic | 2.0180 | 10.0 | 1 3 1 | 44.879 | –0.007 |
| 45.465 | 1.9933 | 6.8 | orthorhombic | 1.9980 | 6.0 | 3 1 1 | 45.353 | –0.112 |
| 45.815 | 1.9789 | 2.5 | ||||||
| 47.035 | 1.9304 | 8.7 | orthorhombic | 1.9230 | 20.0 | 0 0 2 | 47.227 | 0.191 |
| 48.585 | 1.8724 | 6.2 | orthorhombic | 1.8780 | 10.0 | 0 4 0 | 48.430 | –0.155 |
| 48.814 | 1.8641 | 1.7 | orthorhombic | 1.863 | – | 0 1 2 | 48.847 | 0.033 |
| 49.480 | 1.8406 | 4.7 | hexagonal | 1.8413 | 6.0 | 3 0 2 | 49.460 | –0.020 |
| 49.805 | 1.8293 | 10.0 | hexagonal | 1.8269 | 33.0 | 2 2 0 | 49.875 | 0.070 |
| 50.355 | 1.8106 | 24.0 | hexagonal | 1.8079 | 2.0 | 1 0 4 | 50.436 | 0.081 |
| 52.134 | 1.7529 | 1.3 | hexagonal | 1.7553 | 6.0 | 3 1 0 | 52.058 | –0.076 |
| 53.554 | 1.7098 | 5.6 | hexagonal | 1.7099 | 1.0 | 3 1 1 | 53.550 | –0.004 |
| 53.794 | 1.7027 | 5.6 | orthorhombic | 1.7060 | 10.0 | 2 0 2 | 53.682 | –0.113 |
| 54.334 | 1.6870 | 7.3 | orthorhombic | 1.6880 | 16.0 | 0 4 1 | 54.301 | –0.033 |
| 54.555 | 1.6807 | 9.8 | hexagonal | 1.6765 | 2.0 | 1 1 4 | 54.704 | 0.150 |
| 54.964 | 1.6692 | 4.9 | orthorhombic | 1.6650 | 16.0 | 4 0 1 | 55.114 | 0.150 |
| 55.434 | 1.6561 | 9.4 | orthorhombic | 1.6570 | 16.0 | 4 2 0 | 55.403 | –0.031 |
| 55.774 | 1.6468 | 12.4 | orthorhombic | 1.6450 | 6.0 | 1 4 1 | 55.842 | 0.068 |
| 56.664 | 1.6231 | 4.6 | hexagonal | 1.6206 | 15.0 | 2 0 4 | 56.760 | 0.096 |
| 56.954 | 1.6155 | 3.3 | ||||||
| 57.864 | 1.5922 | 4.1 | hexagonal | 1.5915 | 8.0 | 3 1 2 | 57.894 | 0.030 |
| 58.184 | 1.5842 | 2.1 | hexagonal | 1.5823 | 15.0 | 4 0 0 | 58.264 | 0.080 |
a Hexagonal diffraction pattern is compared with the diffraction pattern of hexagonal KAl0.33W2.67O9 (a = 7.307 Å, c = 7.546 Å).
b Orthorhombic diffraction pattern is compared with the diffraction pattern of orthorhombic WO3 (a = 7.384 Å, b = 7.512 Å, c = 3.846 Å).
Thus thermal decomposition of the ammonium salt of [(ReO)3(AsW9O33)2]9– gives mostly a mixture of hexagonal and tetragonal (perovskite) type bronzes. The intensities of the diffraction peaks that belong to the hexagonal phase increase with increasing temperature, which suggests higher stability of the hexagonal phase at high temperatures. A structural phase transition is observed for the tetragonal phase between 725 and 900 °C, which results in an orthorhombic deformation of the observed unit cell.
4 Conclusions
Thermolysis of solid samples of ammonium and potassium salts of the new sandwich polyoxometalate anion [(ReO)3(AsW9O33)2]9– at 600–900 °C yield tungsten–rhenium bronzes based on K2W3O10 and hexagonal and tetragonal oxides. About 95% of the rhenium content of the original polyoxoanion is retained at 900 °C. This behavior suggests the possibility of generating analogous thermally stable technetium oxide bronzes for use as radioactive waste forms.
Acknowledgments
We thank the DOE for support of this work through the Office of Energy research and Environmental Management Science Program, Grant DE-FG07-96ER14695.
Supporting information
Tables S1–S15 listing phase identification and unit cell refinement from powder diffractograms of thermally-treated samples of 1-K, and 1-NH4.