

1 Introduction
Zeolites are currently synthesized as microscopic crystals and formed into pellets for catalytic or adsorptive applications in packed beds. Many of these applications could take advantage of a size reduction of the zeolite particles from the micrometer to the nanometer scale, provided these nanoparticles can be assembled into porous matrices. Substantial progress has already been made in the assembly of zeolite nuclei and nanocrystals into mesoporous materials [1–8] or macrostructures [9–16]. Zeolite micropores are conventionally designated as ultra-micropores with pore widths smaller than 1 nm, to be distinguished from super-micropores with diameters from 1 to 2 nm. An ultra-micropore–super-micropore combination can be realized in Zeogrid materials [17,18]. Zeogrid is obtained through precipitation of a suspension of Silicalite-1 nanoslabs [19,20] upon addition of an ethanolic solution of cetyltrimethylammonium bromide (CTMABr). During the precipitation, the nanoslabs are organized in layers with intercalated surfactant molecules (Fig. 1). Removal of the surfactant through calcination causes facial and lateral fusion of the nanoslabs (Fig. 1). Empty spaces left laterally between nanoslabs are responsible for the formation of well-defined slit-shaped super-micropores, with a characteristic height of ca. 1.4 nm [17]. The presence of a dual microporosity, viz. a combination of ultra- and super-micropores was evidenced with nitrogen adsorption isotherms at 77 K [17]. Zeogrid exhibits molecular shape selectivity in chromatographic separations of mixtures of branched and linear alkanes [17].
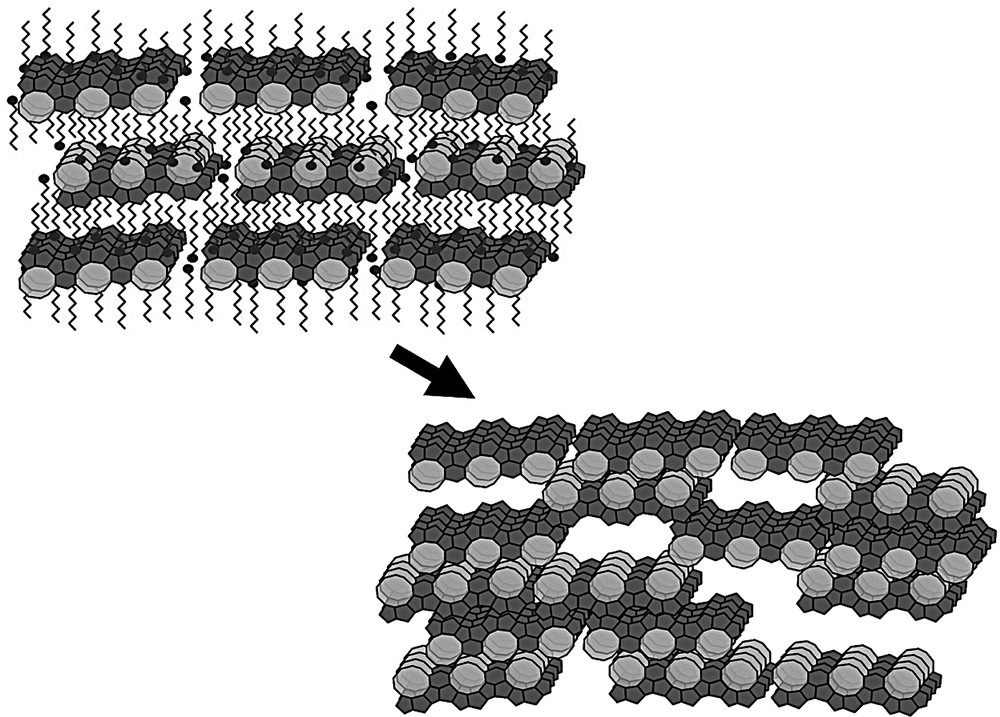
Transformation of CTMABr-nanoslab precipitate into Zeogrid upon calcination [17].
In this work, we explored the possibility of varying the super- and ultra-microporosity by assembling the Zeogrid from differently sized building units, obtained at intermediate stages of the aggregation sequence of nanoslabs into colloidal Silicalite-1 [20,21] (Fig. 2). The sizes of the building blocks from which the Zeogrids were assembled were determined using dynamic light scattering (DLS). The Zeogrids were characterized with scanning electron microscopy (SEM), X-ray diffraction (XRD), nitrogen adsorption and thermogravimetric analysis (TGA). Zeogrids are compared with zeolites and mesoporous materials in molecular separations of alkane mixtures.
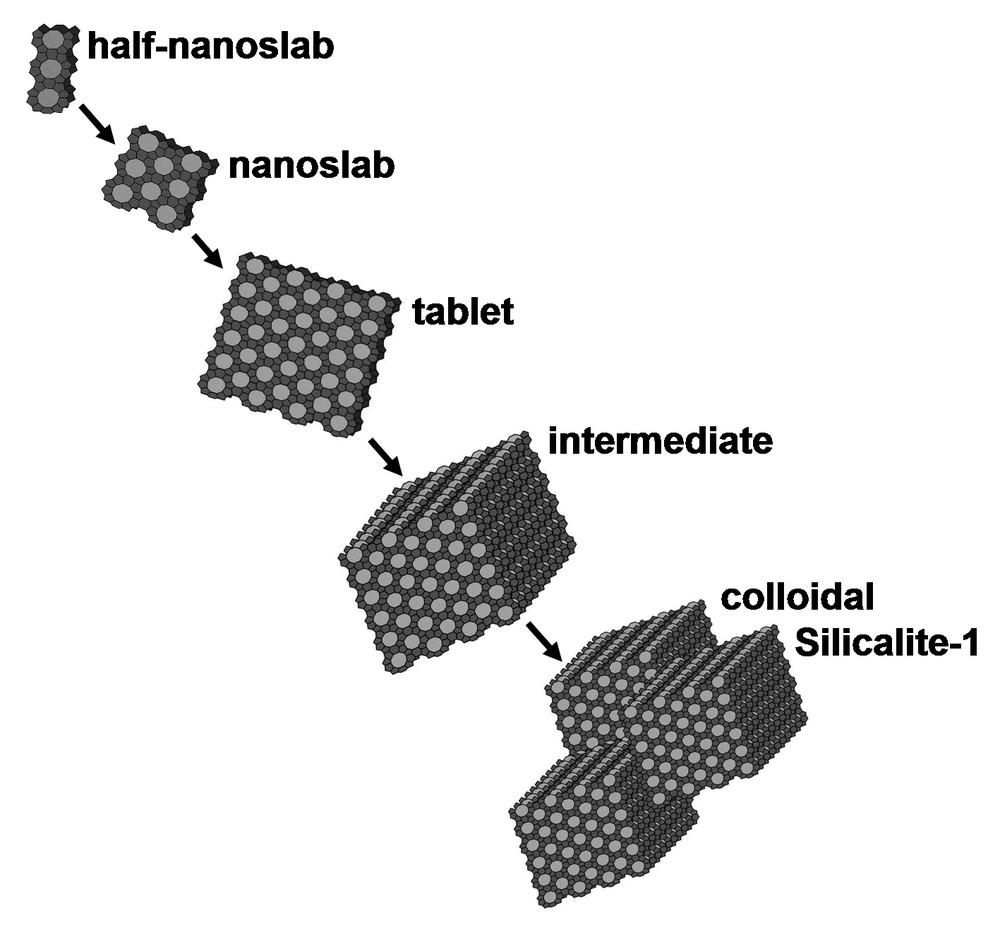
Aggregation sequence of half-nanoslabs into colloidal Silicalite-1 upon heating [21].
2 Results and discussion
2.1 Zeogrid synthesis
A suspension of half-nanoslabs was obtained by hydrolyzing 49.26 g tetraethylorthosilicate (TEOS, Acros, 98%) in 42.41 g aqueous tetrapropylammonium (TPA) hydroxide solution (TPAOH, Alfa, 40 wt.%) under stirring. Hydrolysis, noticed by the homogenization of the two liquids and marked temperature increase (70 °C), occurred after 7 min. After 10 more min, 40.33 g water was added and stirring continued for 24 h. The molar ratios of Si/TPA/water were 25:9:400. The obtained transparent liquid was divided in six samples of 20 g each. A first sample was used as such, while the five other samples were transferred in closed glass flasks placed in holes of an aluminum heated block and kept at 120 °C for 60, 90, 120, 150, and 220 min, respectively. After the selected heating periods, the sample flasks were quenched in a large volume of cold water. The 60′, 90′ and 120′ samples were transparent, the 150′ sample translucent, and the 220′ sample turbid.
The particle size distributions in the suspensions obtained upon thermal treatment of the starting half-nanoslab suspensions according to DLS are shown in Fig. 3. The curves were normalized to the same maximum signal intensity. Mass nor number weighing was applied to the intensities. Bimodal particle size distributions were observed in samples 90′ and 120′. Mixtures with Si/TPA/water molar ratios of 25:9:440 give rise to nanoslabs with a DLS signal around 2.8 nm [19]. With the present chemical composition characterized by a lower water content, the DLS signal in the 0′ sample exhibits an intensity maximum at 1.8 nm. This signal fits with the presence of half-nanoslabs measuring 1.3 × 2.0 × 4.0 nm [20]. In the 60′ sample the DLS peak maximum is shifted to 3.7 nm. This size can be ascribed to tablets measuring 1.3 × 8.0 × 8.0 nm [20,21]. After 90′, intermediates were formed by the stacking of tablets (Fig. 2), with sizes around 24 nm according to DLS. In the 120′ sample, the DLS signal was at 38 nm due to intermediate aggregation and colloidal Silicalite-1 formation. After 150′ and 220′, the particles had grown to 48 and 83 nm, respectively. These DLS data are in agreement with former observations of Silicalite-1 formation via the clear solution route [21–24].

Normalized DLS signals of the suspensions from which Zeogrids were precipitated.
Suspension heating times at 120 °C are indicated on the curves.
To obtain Zeogrid, an amount of 7 g of ethanol (technical grade) was added to each sample under stirring. Subsequently, 60 g of a solution of CTMABr (Acros, 99%) in ethanol (12 wt.%) was added drop wise under stirring (30 ml/h). The formation of a white precipitate was observed during CTMABr addition. The samples were stored under quiescent conditions for 24 h, where after the solids were recovered by filtration, washed with ethanol and dried at 60 °C for 24 h. The samples were labeled as ZGΔT–0-as, ZGΔT–60-as, etc., referring to the heating (ΔT) time (in minutes) before CTMABr addition; the code ‘-as’ indicates that the sample is as-synthesized. An amount of 2 g of each sample was loaded as a packed bed in a quartz tube and subjected to calcination at 400 °C under flowing nitrogen gas during 1 day followed by a second step at 400 °C under oxygen gas for 2 days. The heating rate was 0.2 °C/min and the gas flow was 50 ml/min.
2.2 Characterization of the ZGΔT samples
SEM micrographs of the as-synthesized ZGΔT materials are shown in Fig. 4. In all samples, micrometer sized spherical particles were observed. Some spheres were twinned or fused, resulting in large sizes and deviating morphologies, e.g. the particle measuring ca. 30 μm in ZGΔT–0-as observed in the center of the SEM micrograph (Fig. 4). The globate surface of this particle must have arisen from coalescence of smaller spherical particles. Zeogrid samples of the series up to ZGΔT–120-as showed essentially spherical particle morphology in SEM (Fig. 4). In the ZGΔT–150-as and ZGΔT–220-as samples, assembled from the largest nanometer building units such as intermediates and Silicalite-1 crystallites (Fig. 2), micrometer sized particles with faces and edges were observed next to the spherical particles.

SEM micrographs of the ZGΔT-as samples (scale bars = 10 μm).
The overall weight losses observed in TGA upon calcination of the ZGΔT-as samples at 600 °C are reported in Table 1. These weight losses were ascribed to CTMA and TPA evacuation. TPA is occluded in the channel intersections of Silicalite-1 zeolite. Large particles such as colloidal Silicalite-1 contain ca. 11.4 wt.% occluded TPA [25]. With decreasing particle size, and especially in the nanometer range, the concentration of channel intersections in the Silicalite-1 particle decreases. The occluded TPA content of nanoslabs is 6.6 wt.% [26]. In half-nanoslabs, it is only 4.4 wt.%. Based on these assumed TPA contents, from the data of Table 1 it can be estimated that the CTMA content of ZGΔT–0-as was 52 wt.% and decreased to 28 wt.% in ZGΔT–220-as.
TGA weight losses (%) upon heating the ZGΔT-as samples from ambient temperature to 600 °C under oxidizing atmosphere; the weight losses all were observed at temperatures below 350 °C
| ZGΔT–0-as | ZGΔT–60-as | ZGΔT–90-as | ZGΔT–120-as | ZGΔT–150-as | ZGΔT–220-as |
| 54 ± 1 | 50 ± 1 | 51 ± 1 | 50 ± 1 | 47 ± 1 | 36 ± 1 |
ZGΔT–0-as showed the typical Zeogrid XRD pattern with a prominent reflection at 2.7° 2theta and a weak signal at 5.4° 2theta (Fig. 5). This pattern can be assigned as a layered structure with a repeat distance of 3.2 nm, which is in accordance with the structure model of Zeogrid. Except for ZGΔT–120-as all samples contain the described features, albeit in weakened form, indicating a growing disorder with longer heating times of the synthesis solutions. In addition to the layer-like diffraction behavior another strong signal at 2.0° 2theta (d = 4.4 nm) is seen in the files ZGΔT–90-as to ZGΔT–150-as. The sample ZGΔT–120-as only contains this signal. XRD peaks typical for MFI were visible in the XRD patterns of ZGΔT–150-as and ZGΔT–220-as, at 7.95 and 8.85° 2theta. In the XRD patterns of the calcined samples, the second order reflections related to the layered structures were no more visible (Fig. 6). ZGΔT–0 showed a single signal at 2.8° 2theta, whereas ZGΔT–60, ZGΔT–90, ZGΔT–120 and ZGΔT–150 showed a broad signal at 2.0° 2theta, with possibly a shoulder at 2.8° 2theta. ZGΔT–220 did not show any resolved low-angle reflection. The intensity of the Silicalite-1 diffraction peaks increased with the calcination process, indicating that the size of the zeolite domains increased during the calcination (Figs. 5 and 6). A zoom of this region is shown in Fig. 7. This increase of the size of the zeolite domains was ascribed to ordered chemical bonding between large particles (intermediates, crystals) and surrounding nanoparticles.
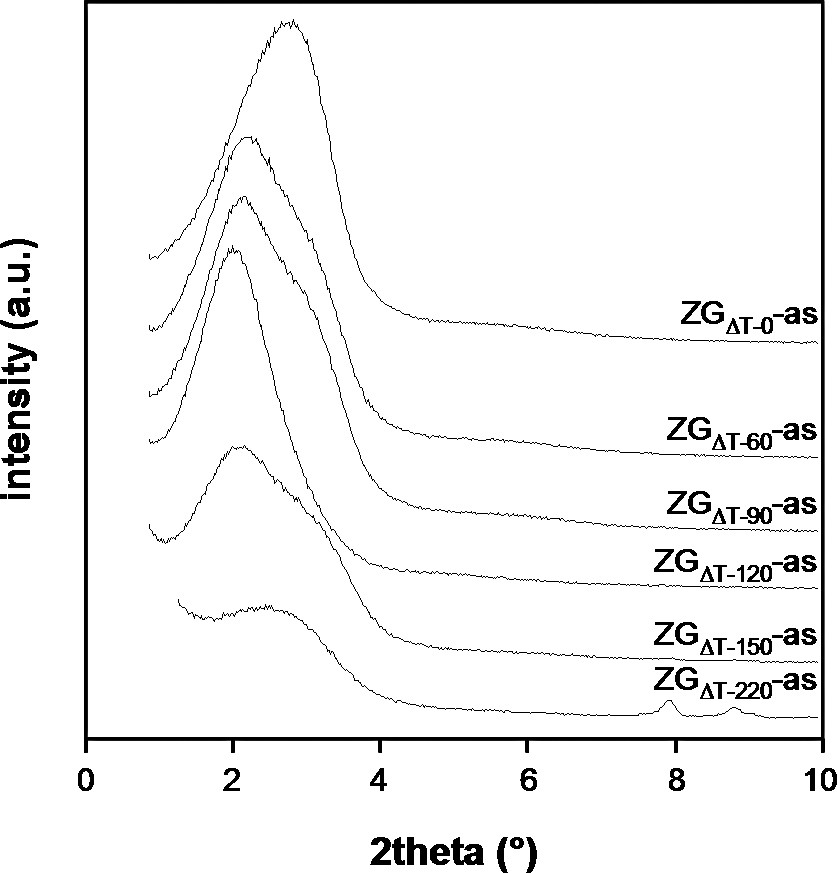
Transmission XRD patterns of the ZGΔT-as samples.

Transmission XRD patterns of the ZGΔT samples.
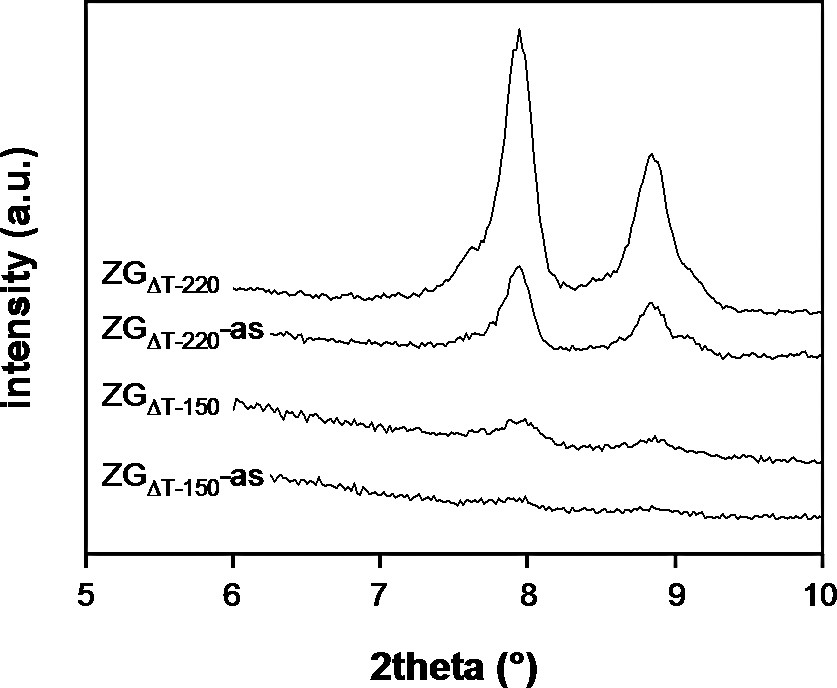
Transmission XRD patterns of as-synthesized and calcined ZGΔT–150 and ZGΔT–220 in the range 5–10° 2theta.
Nitrogen adsorption isotherms of the ZGΔT samples and colloidal Silicalite-1 are shown in Fig. 8. Zeogrids exhibit a type I isotherm. The extension of the plateau to high P/P° values, characteristic of microporous materials with small specific external surface area is in agreement with the particle size of several microns observed with SEM (Fig. 4). The absence of mesoporous volume is further confirmed by t-plot analysis. The t-plot of ZGΔT–0 is shown as an example in Fig. 9. Colloidal Silicalite-1 sample, representing the building units from which ZGΔT–220 was composed adsorbs much smaller quantities of nitrogen at low pressures, and shows a substantial additional uptake at P/P° values above 0.8 in the void spaces between these crystallites measuring tens of nanometers. The difference in nitrogen adsorption behavior between colloidal Silicalite-1 and the ZGΔT–220 sample shows that the procedure of CTMABr addition and calcination resulted in an entirely different linking of the colloidal Silicalite-1 particles in a powder and a Zeogrid. Micropore volumes were derived from the t-plots and are listed in Table 2. In the series of samples from ZGΔT–0 to ZGΔT–220, the micropore volume varies. ZGΔT–0 sample has the highest micropore volume of ca. 0.73 ml/g. The lowest micropore volume of 0.51 ml/g is found in ZGΔT–220. The adsorption isotherms were fitted with a model accounting for ultra-micropore filling in Silicalite-1 type pores and additional adsorption of a limited number of nitrogen layers according to a BET model in slit-shaped super-micropores. The method is detailed in Ref. [17]. The slit height of the super-micropores are in the range 1.13–1.42 nm for all samples, excepted ZGΔT–220 in which the pore width reaches 3.18 nm, corresponding to a number of 4.5 nitrogen layers adsorbed on the walls of these slit-shaped pores.
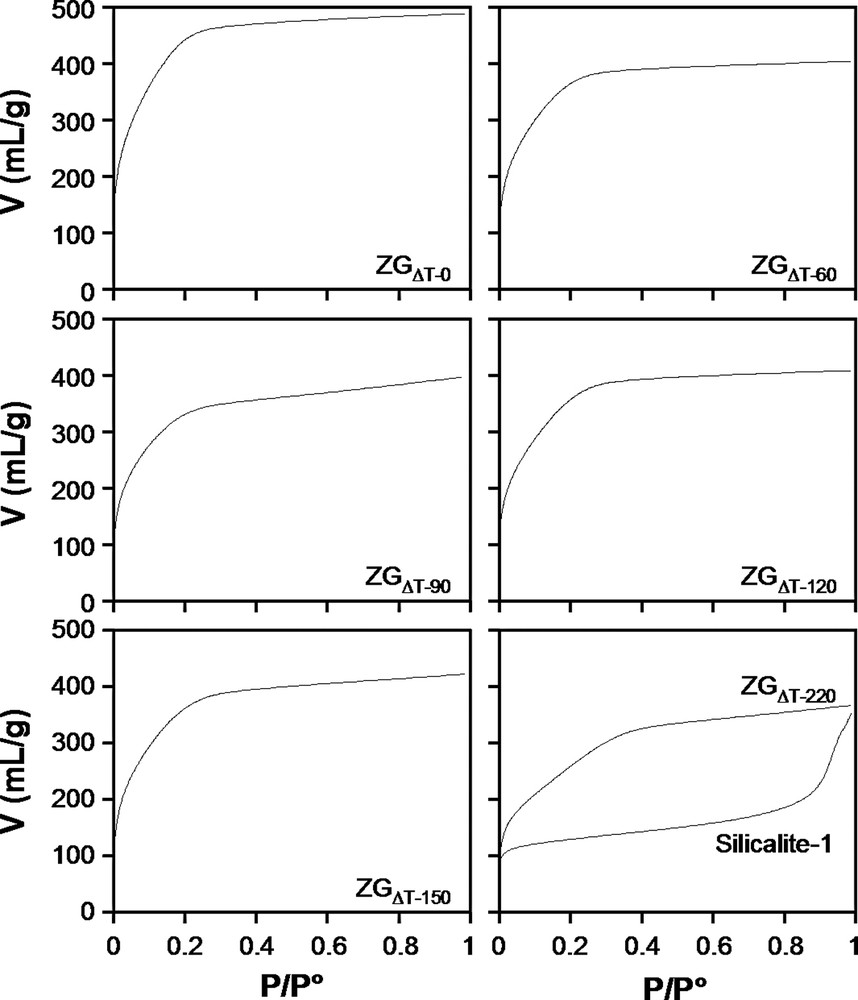
N2 adsorption isotherms of the ZGΔT samples and Silicalite-1.
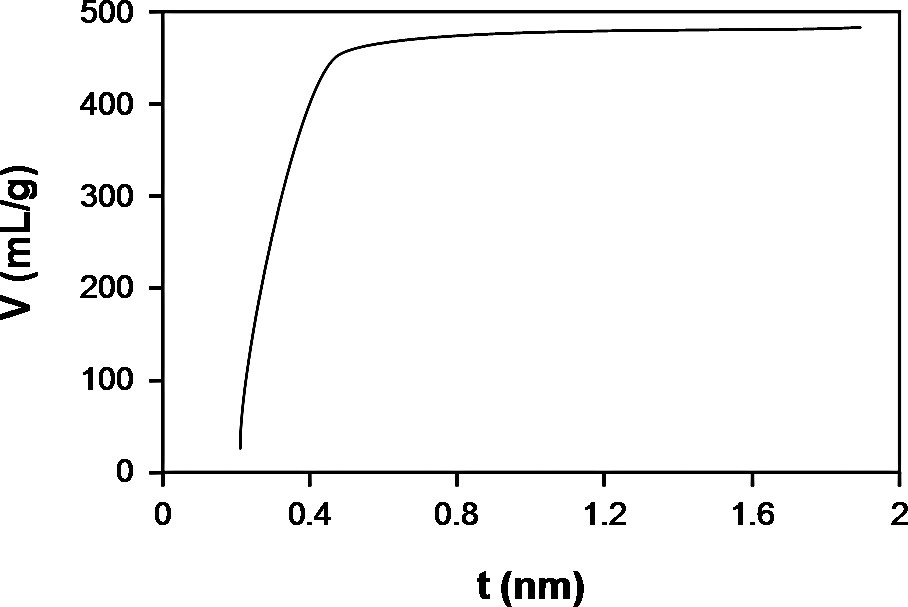
t-Plot of ZGΔT–0.
Super-micropore width according to the BET model (dBET) [17], mean super-micropore diameter according to the BJH model (dBJH), and total micropore volume, as derived from the t-plots (V) of the ZGΔT samples
| ZGΔT–0 | ZGΔT–60 | ZGΔT–90 | ZGΔT–120 | ZGΔT–150 | ZGΔT–220 | |
| V (ml/g) | 0.73 ± 0.01 | 0.60 ± 0.01 | 0.54 ± 0.01 | 0.62 ± 0.01 | 0.64 ± 0.01 | 0.51 ± 0.01 |
| dBET (nm) | 1.18 ± 0.02 | 1.18 ± 0.02 | 1.13 ± 0.02 | 1.42 ± 0.02 | 1.30 ± 0.02 | 3.18 ± 0.05 |
| dBJH (nm) | 1.51 ± 0.02 | 1.65 ± 0.02 | 1.65 ± 0.02 | 1.71 ± 0.02 | 1.70 ± 0.02 | 2.04 ± 0.02 |
The BJH model assuming cylindrical pores was applied to the adsorption isotherms in order to assess the variations of the super-micropore size of the ZGΔT samples (Table 2). The BJH approach revealed a stepwise increase of the super-micropore size from ca. 1.51 to 1.65, 1.70 and 2.04 nm with increasing heating time of nanoslab suspension before surfactant addition (Table 2). For the samples in the series ZGΔT–0 to ZGΔT–150, these values are larger than the ones estimated via the BET model. Given the different approximations of the two models, and especially the pore model, viz. slit in BET versus cylinder in BJH, such discrepancies are to be expected. Nevertheless, the evolution in pore width, depending on the heating time of the clear solution before composing the Zeogrid is evident from the two models.
ZGΔT–220 was assembled from colloidal Silicalite-1 particles. The same colloidal Silicalite-1 material when recovered by centrifugation, drying and calcination exhibits an entirely different N2 adsorption isotherm (Fig. 8). The Silicalite-1 isotherm also exhibited a type I isotherm with capillary condensation in the void spaces between the crystallites revealed by the substantial uptake of nitrogen at P/P° of ca. 0.9. The difference between both isotherms reveals the strong impact of precipitation using CTMABr. The creation of super-microporosity is linked with the use of CTMABr, which seems to order intermediates and crystals into a super-microporous matrix.
2.3 Molecular sieving properties of the ZGΔT samples
The molecular sieving properties of the ZGΔT samples were evaluated with chromatographic separations of several alkane mixtures and comparison with reference USY and ZSM-5 zeolites and MCM-41 mesoporous material [27,28]. The BJH pore width of MCM-41 material was 3.0 nm. The diameter of the Y zeolite spherical cavities is 1.2 nm. ZSM-5 has the same framework topology as Silicalite-1. The straight and sinusoidal pores in ZSM-5 have free diameters of 5.3 × 5.6 and 5.1 × 5.5 Å, respectively. The chosen alkanes were 2-MC4, 2,2-dMC4, 2,3-dMC5, 2,2,4-tMC5, nC6, nC7, nC8, and nC9. The Lennard–Jones kinetic diameters are 6.3, 5.8, 5.0, and 4.3 Å for, respectively, the alkanes with quaternary carbon atom (such as 2,2,4-tMC5 and 2,2-dMC4), the alkanes with vicinal methyl side chains (such as 2,3-dMC5), the monomethyl alkanes (such as 2-MC4) and the linear alkanes [29]. These kinetic diameters are well below the sizes of the super-micropores of the Zeogrid samples (>15 Å), but are in the range of the ultra-micropore size. Representative chromatograms are shown in Figs. 10–14. Assignment of elution peaks was done using single compound injections. Separation factors, defined as the ratio of the retention times are listed in Table 3.
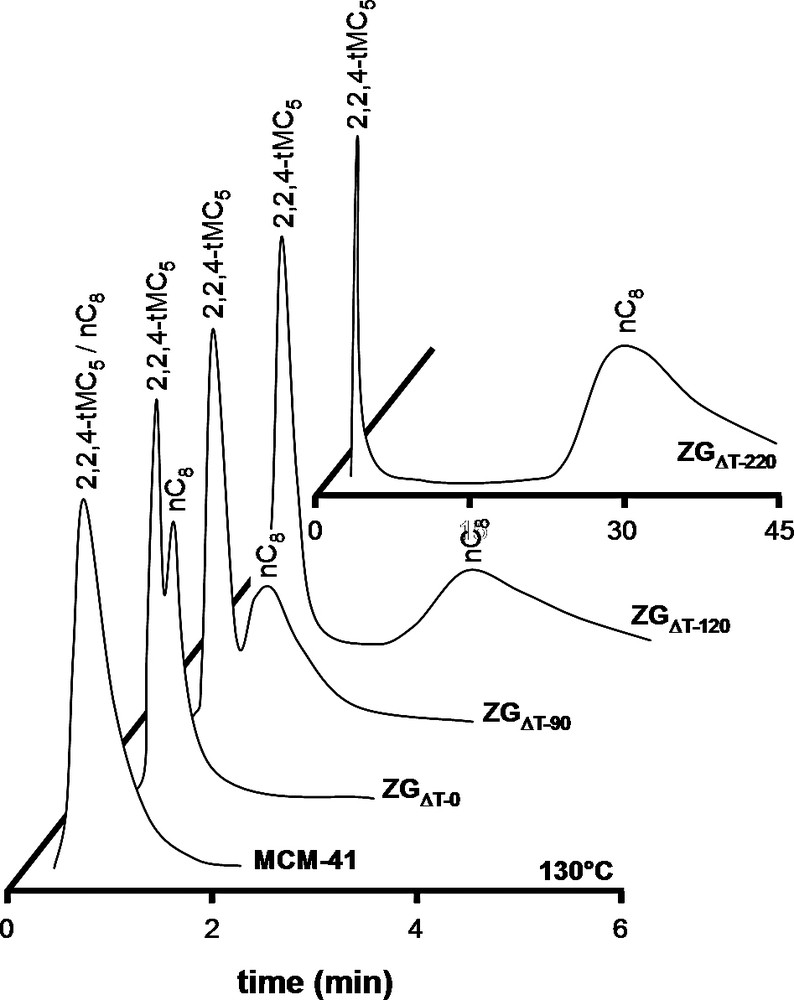
Chromatograms of equimolar nC8/2,2,4-tMC5 mixture on MCM-41, ZGΔT–0, ZGΔT–90, ZGΔT–120 and ZGΔT–220 at 130 °C.

Chromatograms of equimolar nC7/2,3-dMC5 mixture on ZGΔT–0, ZGΔT–60, ZGΔT–150 and ZGΔT–220 at 110 °C.

Chromatograms of equimolar 2-MC4/2,2-dMC4 mixture on ZGΔT–0, ZGΔT–90, ZGΔT–120 and ZGΔT–150 at 90 °C.

Chromatograms of equimolar nC7/2,2,4-tMC5 mixture on ZGΔT–0, ZGΔT–60, ZGΔT–120, ZGΔT–150 and ZGΔT–220 at 110 °C.
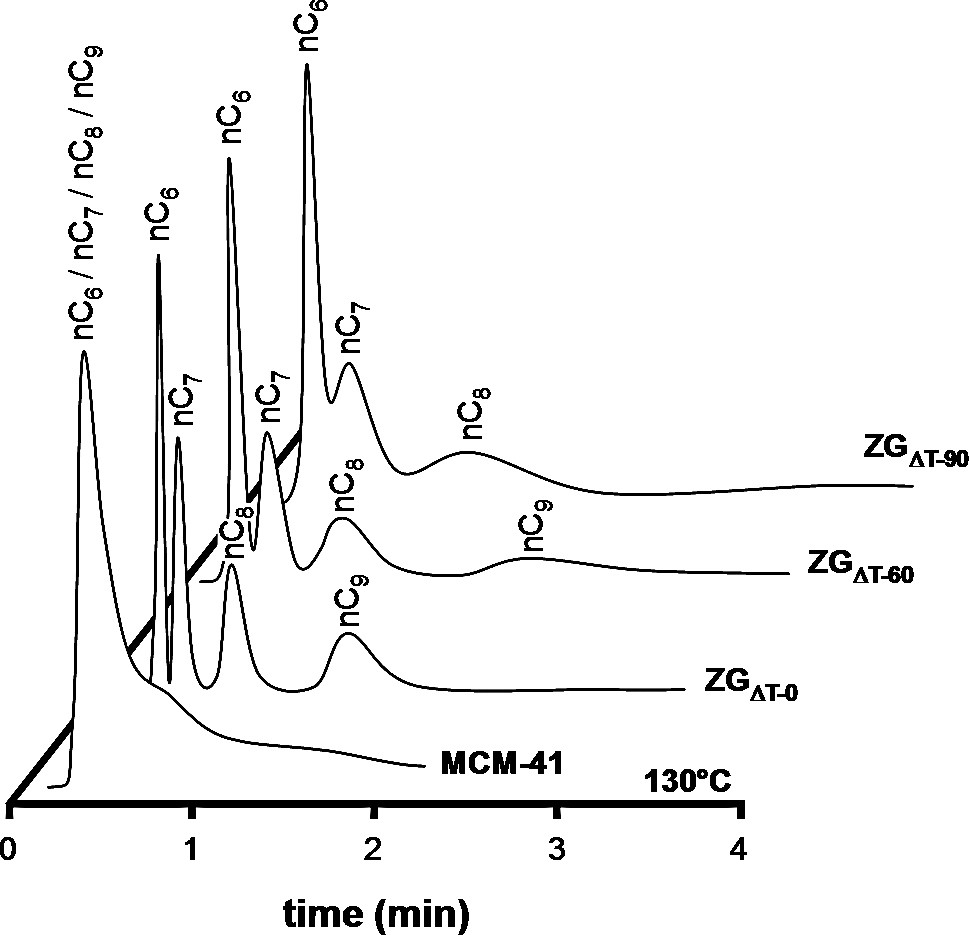
Chromatograms of equimolar nC6/nC7/nC8/nC9 mixture injected on MCM-41, ZGΔT–0, ZGΔT–60 and ZGΔT–90 at 130 °C.
Separation factors of alkanes on the ZGΔT samples
| Mixture | T (°C) | ZGΔT–0 | ZGΔT–60 | ZGΔT–90 | ZGΔT–120 | ZGΔT–150 | ZGΔT–220 |
| nC8/2,2,4-tMC5 | 130 | 1.61 ± 0.06 | 2.02 ± 0.08 | 2.6 ± 0.1 | 4.5 ± 0.2 | 6.7 ± 0.3 | 260 ± 10 |
| nC7/2,3-dMC5 | 110 | 1.00 ± 0.04 | 1.39 ± 0.06 | 1.43 ± 0.06 | 2.4 ± 0.1 | 2.9 ± 0.1 | 5.7 ± 0.2 |
| 2-MC4/2,2-dMC4 | 90 | 0.39 ± 0.02 | 0.51 ± 0.02 | 0.62 ± 0.02 | 1.00 ± 0.04 | 1.43 ± 0.06 | 2.2 ± 0.1 |
| nC7/2,2,4-tMC5 | 110 | 0.79 ± 0.03 | 1.00 ± 0.04 | 1.00 ± 0.04 | 1.74 ± 0.07 | 2.7 ± 0.1 | 81 ± 3 |
The chromatograms of nC8/2,2,4-tMC5 mixture on MCM-41 at 130 °C (Fig. 10) displayed no separation, confirming the absence of molecular sieving in this mesoporous material. Similarly, no separation was observed on USY zeolite. This large pore zeolite separates alkanes on carbon number basis rather than on branching [29]. ZGΔT–0 did separate nC8 from 2,2,4-tMC5. The 2,2,4-tMC5 molecule eluted faster than nC8. This molecular sieving must result from ultra-microporosity, accessible to linear nC8, but not to bulky 2,2,4-tMC5 [30]. When injecting this mixture on ZGΔT–90, the retention time of nC8 is longer and that of 2,2,4-tMC5 shorter. The separation factor increased from 1.61 to 2.02 (Table 3). The separation factor was further increased on ZGΔT–120. Finally, the separation observed on ZGΔT–220 was similar to the one observed on ZSM-5. 2,2,4-tMC5 eluted almost immediately, whereas nC8 strongly adsorbed in the ultra-micropores and eluted after 30 min, resulting in a separation factor of 260 (Table 3).
The adsorption enthalpies of nC8 and 2,2,4-tMC5 on the different materials were derived from the temperature dependencies of the Henry constants [29] (Table 4). The adsorption enthalpy of an alkane reflects the van der Waals interaction with the pore walls, and the confinement of the molecule in the pore. 2,2,4-tMC5 molecules can not penetrate the 10 rings of Silicalite-1 type zeolites [30]. The adsorption enthalpy of 2,2,4-tMC5 on ZGΔT–0 was lower than on USY, but higher than on MCM-41. This order reflects the pore width in these materials, viz. USY (1.2 nm) < ZGΔT–0 (1.5 nm) < MCM-41 (3.0 nm). On USY and MCM-41, the adsorption enthalpies of nC8 and 2,2,4-tMC5 were similar. On ZGΔT–0, the adsorption enthalpy of nC8 is higher than that of 2,2,4-tMC5, viz. ca. –59 kJ/mol compared to ca. –51 kJ/mol (Table 4), confirming the interaction of nC8 with ultra-micropores to which 2,2,4-tMC5 has no access. ZGΔT–60 and ZGΔT–90 materials are composed of larger building units which contain longer ultra-micropores. The adsorption enthalpy of nC8 in ZGΔT–60 and ZGΔT–90 is higher than in ZGΔT–0, viz. ca. –69 and –72 kJ/mol compared to ca. –59 kJ/mol on ZGΔT–0. The increased size of the zeolitic building units in the ZGΔT–60 and ZGΔT–90 materials adds little to the adsorption enthalpy of 2,2,4-tMC5, as expected.
Adsorption enthalpies (kJ/mol) of nC8 and 2,2,4-tMC5 on ZGΔT–0, ZGΔT–60, ZGΔT–90, MCM-41 and USY
| Akane | ZGΔT–0 | ZGΔT–60 | ZGΔT–90 | MCM-41 | USY |
| nC8 | –59 ± 2 | –69 ± 2 | –72 ± 2 | –43 ± 2 | –54 ± 2 |
| 2,2,4-tMC5 | –51 ± 2 | –57 ± 2 | –56 ± 2 | –43 ± 2 | –55 ± 2 |
Chromatograms of a nC7/2,3-dMC5 mixture at 110 °C are displayed in Fig. 11. Both alkanes have the same carbon number and were not separated on USY zeolite (chromatogram not shown). On ZSM-5 and ZGΔT–220, the branched 2,3-dMC5 molecule was less retained compared to nC7 (not shown). The separation factor was 5.7 (Table 3). The separation of nC7 from 2,3-dMC5 decreased in the order: ZGΔT–150 > ZGΔT–120 > ZGΔT–90 > ZGΔT–60 (Table 3 and Fig. 11). This can be explained by the decrease of ultra-microporosity, being responsible for the adsorption of nC7. In ZGΔT–0 the ultra-micropore contribution was so small that the mixture was not separated.
The transition from predominantly super-micropore adsorption to ultra-micropore adsorption with increasing size of the zeolitic building units for Zeogrid is further illustrated in Figs. 12 and 13, showing chromatograms of a 2-MC4/2,2-dMC4 mixture at 90 °C and of a nC7/2,2,4-tMC5 mixture at 110 °C, respectively. The 2-MC4/2,2-dMC4 mixture was separated on ZGΔT–0 (Fig. 12). The lighter 2-MC4 molecule eluted fastest. The separation factor was 0.39 (Table 3). On ZGΔT–90, separation was less pronounced. On ZGΔT–120, 2-MC4 and 2,2-dMC4 eluted simultaneously. On ZGΔT–150, separation was observed, but the peak sequence was reversed, 2,2-dMC4 eluted first. A similar situation was encountered with nC7/2,2,4-tMC5 mixture (Fig. 13). On ZGΔT–0, nC7 eluted first. On ZGΔT–60 and ZGΔT–90, no separation was observed. On ZGΔT–120, ZGΔT–150 and ZGΔT–220, separation was observed, but the separation sequence was reversed, and 2,2,4-tMC5 eluted first, whereas nC7 remained adsorbed for longer time. These separations reflect the transition from a predominantly super-microporous material (ZGΔT–0) to an essentially ultra-microporous material (ZGΔT–220). The absence of separation in the intermediary materials is caused by a compensation of preferential adsorption of the heaviest molecule in super-micropores and preferential adsorption of the lighter linear molecule in the ultra-micropores. These separations depending on the balance of ultra- and super-microporosity illustrated the potential of the Zeogrid approach for fine-tuning of adsorption behavior. A comparison of Zeogrid with MCM-41 in nC6–nC9 normal alkane separation further illustrates the superior separation capacity of Zeogrid (Fig. 14). On MCM-41, the separation of n-alkanes was poor. The best separation was obtained on ZGΔT–0. When injecting the alkane mixture on ZGΔT–60 and ZGΔT–90, the retention times increased, and peak broadening was observed. This was due to the elongation of the ultra-micropores in these particular samples built from larger Silicalite-1 units. The retention time of nC6 and nC7 (Table 5) increased in the Zeogrid series from ZGΔT–0 to ZGΔT–220, as a consequence of the increasing size of the zeolite building units and the increased length of the ultra-micropores in these units.
Retention times (min) of nC6 and nC7 on the ZGΔT samples
| Alkane | T (°C) | ZGΔT–0 | ZGΔT–60 | ZGΔT–90 | ZGΔT–120 | ZGΔT–150 | ZGΔT–220 |
| nC6 | 90 | 0.27 ± 0.01 | 0.62 ± 0.01 | 0.73 ± 0.01 | 1.31 ± 0.03 | 1.37 ± 0.03 | 10.0 ± 0.2 |
| nC7 | 110 | 0.45 ± 0.01 | 0.70 ± 0.01 | 0.71 ± 0.01 | 1.54 ± 0.03 | 1.50 ± 0.03 | 17.0 ± 0.3 |
3 Conclusions
Zeogrids were successfully synthesized by interrupting the aggregation process of nanoslabs into Silicalite-1, precipitation of the particles by addition of CTMABr and calcination. Zeogrids present a new family of materials with dual microporosity. The size of the zeolitic building units varied from 1.8 nm, corresponding to half-nanoslabs, to colloidal Silicalite-1 particles measuring ca. 80 nm. The ultra-micropores of the Zeogrids are located inside the elementary zeolitic building units; super-micropores between the units at locations from which CTMABr is evacuated through calcination. Zeogrid super-micropores have diameters of 1.13–3.18 nm, when assuming a slit shape, or 1.51–2.04 nm when assuming a cylindrical shape. The sample prepared from colloidal Silicalite-1 (ZGΔT–220) has substantially wider pores. The total micropore volume is very large, and varies from 0.5 to 0.7 ml/g depending on the nature of the zeolitic building units. In Zeogrid samples prepared from colloidal Silicalite-1 or intermediates (ZGΔT–150 and ZGΔT–220), the Silicalite-1 crystallites composing the Zeogrid exhibit Silicalite-1 type XRD, whereas samples prepared from smaller building units do not display such wide angle XRD. Irrespective of the presence of Silicalite-1-type crystallinity, on all Zeogrid samples iso-alkanes can be separated from n-alkane through molecular sieving. Adsorption enthalpies of n-alkanes are larger than of iso-alkanes. These observations reveal the ultra-microporous nature of the building units, irrespective of their size. The incorporation of larger zeolite units in the Zeogrid particles enhances the molecular sieving. The combination of very short ultra-micropores with well-defined super-microporosity results in extraordinary separation properties for n-alkanes in Zeogrids.
4 Experimental
DLS was performed with a non-invasive backscattering high performance particle sizer from ALV GmbH, equipped with a photomultiplier detector. The detector was situated close to the light emitter, at an angle of 173°. A helium-neon laser with a wavelength of 632.8 nm and an output power of 3 mW, ensured non-destructive measurements. The samples were filtered through a polytetrafluoroethylene filter membrane (Alltech) with pore size of 200 nm prior to measurement. The measurements were done in new polystyrene cells. The results were corrected for viscosity, determined using a U-tube Ostwald viscosity meter (Brand), in accordance with the Stokes-Einstein equation. X-ray characterization took place on a Siemens D5000 diffractometer in transmission geometry (Debye Scherrer). The samples were sealed in capillaries with outer diameter of 1 mm. As X-ray source served a Rigaku rotating anode with Cu target (Rigaku) (λ = 0.154 nm). The source was equipped with a Goebel mirror (AXS Bruker) to obtain an intense parallel beam made up from Kα radiation (residual Kβ was removed with a Ni filter). The scattered and diffracted X-ray intensity was recorded with a scintillation detector. SEM was performed with a JXA-733 JEOL on gold plated samples. TGA analyses were done in a Setaram TGA 92 balance, at a heating rate of 1 °C/min under 30 vol.% oxygen in helium atmosphere. The temperature was raised to 800 °C. Nitrogen adsorption experiments were carried out in an Omnisorp 100 instrument (Coulter), operated in continuous flow mode. Typically 50–100 mg of sample was outgassed during 15 h at 200 °C under vacuum (1 Pa) prior to measurement. The BJH super-micropore diameters were derived from the adsorption isotherms using the Advanced Data Processing software (version 4.0, release 1.21) from CE Instruments. In the tracer gas chromatography experiments, an amount of 0.1 μl of a hydrocarbon mixture was injected in a 4 mm inner diameter and 78 mm long cylindrical split/splitless liner for a capillary GC inlet system (Hewlett Packard 5890A with flame ionization detector). The liner was filled over a length of 30 mm with a packing of pelletized material (particle size range 0.25–0.5 mm). Pre-treatment was done at 300 °C for 1 h at a heating rate of 2 °C/min. The nitrogen carrier gas flow was 30 ml/min.
Acknowledgements
The authors acknowledge the Flemish Government for financially supporting a GOA project on the understanding of active site in catalysis. C.E.A.K. acknowledges the Flemish FWO for a postdoctoral fellowship.