

1 Introduction
Pt/mordenite is used in industry for the isomerization of C5/C6 naphtha into high octane number isomers. Compared to the chlorided Pt/Al2O3 catalyst, Pt/MOR has major advantages [1–3]: avoiding the necessity to add chloride in the feed in order to stabilize the acidity of the catalyst, avoiding corrosion problems, and being less sensitive to poisons such as sulfur and steam. In Pt/mordenite, the acid function is ensured by the modified mordenite and the hydro/dehydrogenation function is ensured by the Pt. These catalysts work at low temperatures (about 250 °C) and can accept some impurities in the charge. However, Pt/mordenite, as the other isomerization catalysts, deactivates during the process. Due to the catalyst deactivation, commercial isomerization plants are often operated at an increasing temperature in order to maintain high performances. This increase of the operation temperature can be limited by the catalyst stability and selectivity. Although an in situ catalyst regeneration can be done, it is usually impossible to restore the initial activity completely, due to various causes such as insufficient coke elimination or progressive changes of the solid state properties of the catalyst. Commercially, deactivation requires to change catalysts after some years of operation [4–6]. Literature shows that deactivation can be explained principally by [7–12]: purity of the gaseous charge, partial pressure of hydrogen, nature of the reactant, reaction temperature, ratio between the metallic and the number of acid sites, presence of a mesoporous framework, diameter of the pores, and dispersion of platinum. Additional fundamental studies are necessary to clarify the importance of these factors. The objective of this paper is to shed light on these aspects in order to contribute to the understanding of catalyst deactivation and of the process involved in the regeneration of deactivated catalysts.
We present results obtained following a systematic study to explain deactivation and regeneration of a Pt/mordenite catalyst. The study considers the deactivation of the pure mordenite (MOR) support at low temperature, the deactivation of the Pt/MOR catalysts at low and at high temperatures, the regeneration of the MOR deactivated support and of the Pt/MOR catalysts. In all cases, catalytic performance was followed by a reference test performed under standard conditions. In order to correlate the deactivation process, solid state, and reactivity properties, catalysts and support were characterized by several physico-chemical techniques: chemical analysis, X-ray diffraction, XPS spectroscopy, CO chemisorption, NH3-TPD, NMR-spectroscopy and IR-spectroscopy.
2 Experimental
2.1 Catalyst preparation
A mordenite with Si/Al atomic ratio of 11 was obtained from Conteka. Platinum deposition (0.5 wt.%) was performed by ion exchange using NH4NO3 and Pt(NH3)4Cl2·xH2O. The NH4NO3 to Pt(NH3)4Cl2·xH2O molar ratio was 250. The exchange was performed at room temperature for 30 h applying a pH of 10. Finally, the catalysts were calcined at 400 °C for 6 h. This sample is termed MOR/Pt(11). A MOR/B(11) blank sample was also prepared by performing the same exchange conditions but without the platinum precursor.
2.2 Catalytic tests
A pyrex glass reactor was used (8 mm i.d. with a 3 mm concentric tube for thermocouple placement). Before the tests, all catalysts were activated by hydrogen (flow rate: 17 ml/min) and temperature increase from 100 to 400 °C. The temperature was maintained at 400 °C for 1 and 1/2 h and then decreased again to 100 °C. Three different catalytic tests were realized. The first test allowed to obtain the catalytic performance of a “non deactivated” sample and to check the activity of the catalyst after deactivation or regeneration (termed TR). In order to study the influence of the temperature, tests (termed TT) were performed at 250, 280 and 300 °C. A second test (termed TD), was performed at high temperature in order to get a strong deactivation and, finally, a third test was performed at low temperature to get a weak deactivation, and is termed TDLT. A regeneration procedure was carried out in order to burn off part of the coke formed on the catalyst surfaces during the TD deactivation test: 200 mg of deactivated TD catalysts were treated using an air flow (23 ml/min) at 400 °C for 2 h. After regeneration, a test under TR conditions was performed as well. The catalyst sample obtained with this regeneration procedure was called TREGMOR/Pt(11) (see Table 1).
Experimental reaction conditions for the catalytic tests in the TR, TD and TDLT mode, respectively. The notation of the samples after the different catalytic tests is indicated. Total flow (H2/pentane) = 11.5 ml/min. Partial pressure of pentane in the feed = 209 mbar. Atmospheric pressure
| Reaction parameters | Reference test (TR) | Test at three different temperatures (TT) | (Strong) Deactivation test at high temperature (TD) | (Weak) Deactivation at low temperature (TDLT) |
| Catalyst mass | 500 mg (fresh catalyst), 200 mg (fresh and regenerated catalyst) | 500 mg (fresh catalyst) | 500 mg (fresh catalyst) | 500 mg (fresh catalyst) |
| Temperature program | 280 °C during 1 h | 250 °C during 1 and 1/2 h, 280 °C during 1 and 1/2 h, 300 °C during 1 and 1/2 h | 280 °C during 1 h, 370 °C during 24 h, 280 °C during 1 h | 280 °C during 23 h, 300 °C during 6 h, 280 °C during 1 h |
| Sample name | TRMOR/Pt(11) | TTMOR/Pt(11) | TDMOR/Pt(11) | TDLTMOR/Pt(11) |
Moreover, other tests (noted TT) were realized on 500 mg of catalyst at three different temperatures (250, 280 and 300 °C). The same test was performed on a blank sample. The two samples issued from those tests are called TTMOR/Pt(11) and TTMOR/B(11). Another deactivation procedure (TD*) was applied on the blank (named TD*MOR/B(11) after the test): the reaction was performed at 280 °C during 17 h.
The outlet gas was analyzed using a GC equipped with a thermal conductivity detector (TCD) and two columns: washed molecular sieve type (Alltech Ref. 57732, 6 ft. length, 80–100 mesh) and a Graphpac-GC phase (Alltech Ref. 85501PC, 7 ft. length, 80–100 mesh) impregnated with 0.19 wt.% picric acid.
2.3 Characterization of the catalysts
2.3.1 Chemical analyses
The analyses were performed for Pt, Al, Si and Na. A Thermo Jarrel Ash Iris Advantage type ICP spectrometer was used.
2.3.2 Samples textural determination
The surface area and diameters of micropores and mesopores were analyzed using a Micromeritics ASAP 2010 Micro-pore system using argon as adsorption gas. Previous to the analysis, the samples were degassed for 2 h at 100 °C under a pressure of 10–3 mbar. The temperature was then increased to 300 °C for 8 h, followed by the argon adsorption (–185.5 °C). The adsorption–desorption isotherms were measured for relative pressures comprised between 10–6 and 1.
2.3.3 X-ray diffraction
Samples were dispersed on plates constituted of a silica mono-crystal. A Kristalloflex Siemens D 5000 diffractometer using the CuKα radiation (λ = 1.5418 Å) and powered at 40 kV × 40 mA was used. Diffractograms were registered for 2θ values comprised between 5° and 50°, with an increasing step of 0.02° every 3 s. Diffractograms were studied by comparison with the JCPDS (International Center for Diffraction Data) data bank.
2.3.4 XPS spectroscopy
A Kratos Ultra XPS spectrometer (Kratos Analytical, Manchester, UK) equipped with a monochromatic aluminum X-ray source (powered at 10 mA and 15 kV) and an eight-channel detector was used. The powder samples were fixed on a stainless steel multiple-specimen holder (gently compacted troughs of inner diameter of 4 and 0.5 mm depth) by using double sided conductive tape. The following sequence of spectra were recorded: survey spectrum, C1s, Al2p, Pt4f, O1s, Pt4d, Na1s, N1s and C1s again in order to check the stability of charge compensation depending on time and the absence of degradation of the sample during analysis. The binding energies were calculated with respect to the C–(C, H) component of the C1s peak of adventitious carbon fixed at 284.8 eV. The spectra were decomposed with a Gaussian/Lorentzian ratio of 70:30. The percentages of atomic concentration ratios were calculated using peak areas normalized on the basis of acquisition parameters, sensitivity factors provided by the manufacturer (based on experimental Wagner sensitivity factors) and transmission factors included in the software (depending on kinetic energy, analyzer pass energy and lenses combination).
2.3.5 CO chemisorption
The ratio between the number of surface platinum atoms, given by the number of adsorbed CO molecules and the number of total platinum atoms in the samples, was taken as the dispersion estimation. A Micromeritics Pulse Chemisorb 2700 equipment was used. The measurements were performed on 100 mg of catalyst samples. First, the samples were subjected to a temperature enhancement to 100 °C, with a rate of 10 °C/min and under an H2 flow. The temperature was maintained for 1 h (under H2) and then increased to 400 °C. This temperature was kept for 2 h. After that, a helium flow (40 ml/min for 1 h) was applied. After cooling at room temperature, CO pulses (58 μl) were introduced.
2.3.6 NH3–TPD
The applied technique was a ‘dynamic flow-through static bed’. The analysis of the effluent was performed with a Balzers Instruments (ThermoStar GSD 300T) mass spectrometer using the “Balzers Quadstar™” software. The evolution of the 15, 16, 17 and 18 mass fragments in the gas flow was studied. One hundred milligrams of catalyst was placed in a U shaped mini-reactor (3.8-mm diameter). The sample was pre-treated at 520 °C (at 10 °C/min) under a helium flow of 30 ml/min, then the temperature was decreased to 100 °C and maintained for 1 h. The ammonia adsorption (30 ml/min) was performed at 100 °C. The ammonia temperature programmed desorption was carried out by increasing the temperature up to 520 °C (at 10 °C/min). The ammonia was trapped in a fresh boric acid solution and titrated with a sulfuric acid solution (concentration: 0.005 M). The desorption profiles (qualitatively) are designed by the evolution of the m/z = 16 fragment (corresponding to ammonia) intensity.
2.3.7 NMR-spectroscopy
Analyses were run on a Varian VXR 300 S WB spectrometer, equipped with a Jakobsen high spinning speed MAS probe using 7 mm zirconia rotors. For 27Al MAS NMR the recording conditions were as follows: frequency: 78.157 MHz, sweep width: 38, 350 Hz, pulse width: 0.5 μs (90° pulse: 5.0 μs), repetition time: 2.0 s, acquisition time: 0.05 s, number of scans: 2000–5400, MAS spinning speed: 5–5.7 kHz. The lines were referenced to 1 M aluminum nitrate solution = 0 ppm. For 13C CP/MAS NMR: frequency: 75.429 MHz, sweep width: 30, 418 Hz, pulse width: 5.8 μs (90° pulse: 5.8 μs), repetition time: 2.0 s, acquisition time: 0.1 s, contact time: 1000 μs, number of scans: 3500, MAS spinning speed: 4.5 kHz. The lines were referenced to the aliphatic signal of hexa methyl benzene = 17.3 ppm. The evaluation of the 13C CP/MAS NMR data was done only qualitatively, since the pulse sequence used does not allow quantitative interpretation of the results.
2.3.8 IR-spectroscopy
A Perkin-Elmer System 2000 FT-IR spectrometer was used, applying the transmission mode. The samples were pressed into thin self-supporting wafers and mounted into a vacuum chamber (reduced pressure ≈ 10–5 mbar), equipped with quartz-windows and thermocouples. After the removal of adsorbed water by heating to 400 °C in vacuum (10–5 mbar), the samples were exposed to 1–5 mbar of pyridine for 15 min. The samples were then evacuated under vacuum and heated to 200 °C. The interaction of pyridine with acid sites on the surface gives rise to two characteristic bands in the IR-spectrum, indicative for Lewis (about 1450 per cm) and Brønsted acid sites (about 1540 per cm), respectively. The evaluation of the bands corresponding to Lewis and Brønsted acid site areas allowed the quantitative determination of the abundance of acid sites for the different samples.
3 Results
3.1 Catalytic tests
3.1.1 Reference test (TR)
The pentane conversion and iso-pentane selectivity and yield for the MOR/Pt(11) in the reference test are presented in Table 2.
Reference test (TR) results of the MOR/Pt(11) catalyst
| C5 conversion | i-C5 selectivity | i-C5 yield |
| 72% | 51% | 37% |
3.1.2 Tests at three different temperatures (TT)
The results of the test at three temperatures (250, 280 and 300 °C) are presented in Fig. 1. The pentane conversion value of the MOR/B(11) blank are about 30–40% lower than those of the MOR/Pt(11) fresh catalyst, but follow the same evolution with the temperature: the conversions are 47% and 15% at 250 °C; 80% and 33% at 300 °C, respectively, for MOR/Pt(11) and MOR/B(11) samples. The iso-pentane selectivities are quite similar for each temperature and follow the same trend: the selectivities decrease from 76–69% at 250 °C to 31–46% at 300 °C for MOR/Pt(11) and MOR/B(11) samples, respectively.
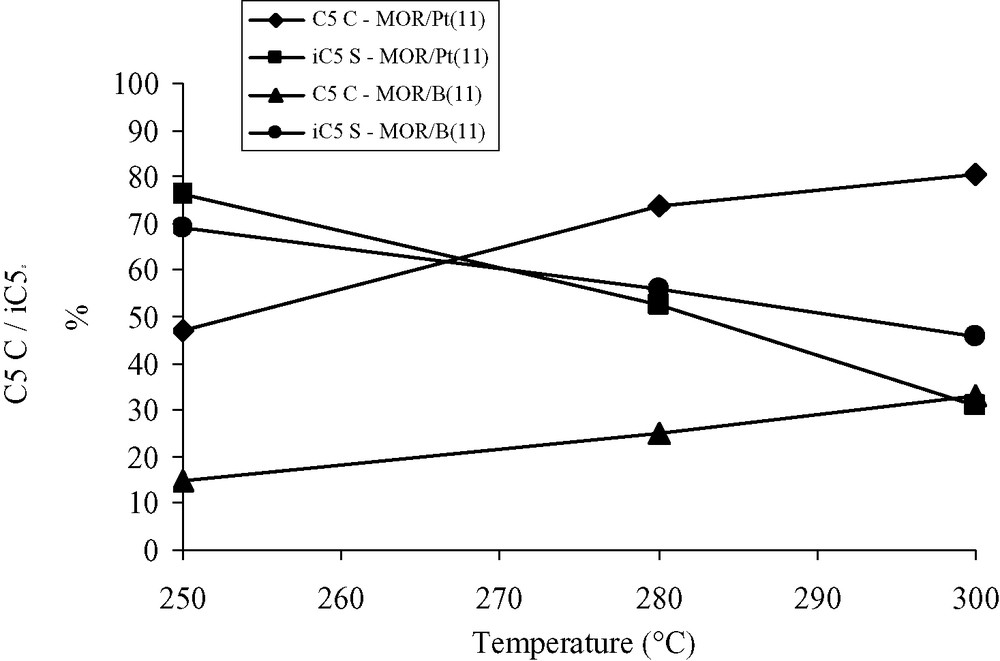
Results of the test at three different temperatures (TT) for the MOR/Pt(11) catalyst and the MOR/B(11) blank sample. C5C: C5 conversion; i-C5S: i-C5 selectivity.
3.1.3 Deactivation test at low temperature (TDLT)
During the first 1350 min of reaction time (i.e. before the temperature rises to 300 °C), the conversion decreases from 74% to about 69% for the MOR/Pt(11) catalyst (see Fig. 2). Initially, the selectivity for MOR/Pt(11) is 49%. After 1350 min, the selectivity is 55%. After 6 h at 300 °C, the decrease of the conversion of the catalyst is accelerated (to 56%). The activity loss, defined as the percentage ratio of the activity lost compared to the initial activity, is calculated. After the deactivation procedure, the MOR/Pt(11) catalyst is characterized by a conversion decrease from 74% to 56%, i.e. a loss of 24% of the initial activity. The final iso-pentane selectivity of the MOR/Pt(11) catalyst is 64%.
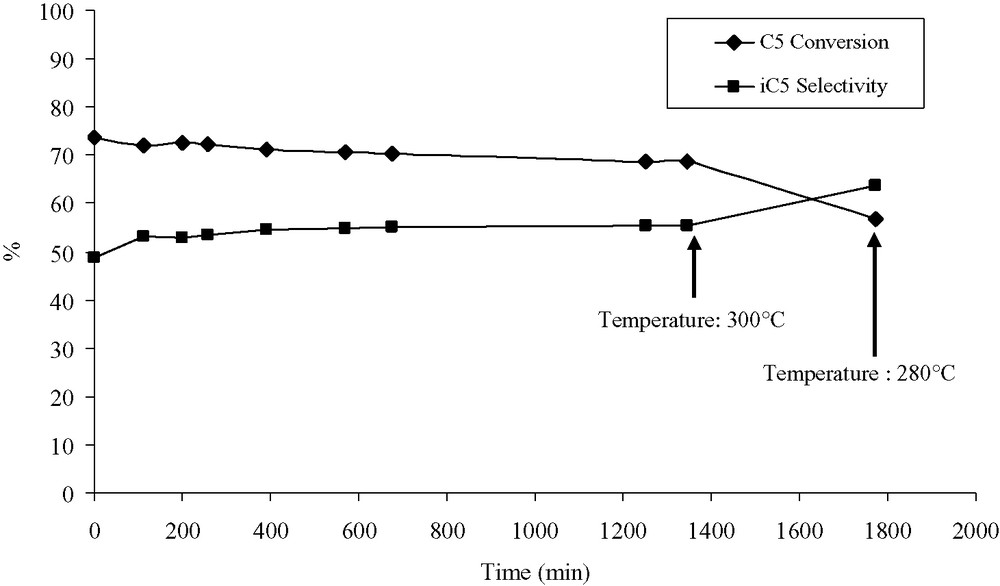
Deactivation test at low temperature (TDLT) results: C5 conversion and i-C5 selectivity evolution for the MOR/Pt(11) catalysts in the course of time (measurements performed at 280 °C). After 1350 min, the temperature was raised to 300 °C.
3.1.4 Deactivation tests at high temperature (TD)
Initial conversion is 73% for MOR/Pt(11). At 370 °C, the MOR/Pt(11) catalyst is quickly deactivated and reaches a very low conversion level after 5 h. After the deactivation procedure, the catalyst conversion under TR conditions (280 °C) is very weak (less than 10%). These results allow to assume that there is a total deactivation of the catalysts. The iso-pentane selectivity increases from 50% at the beginning of the test, to close to 100% after the deactivation procedure.
Concerning the deactivation test (TD*) for the MOR/B(11) blank sample, the conversions and selectivity follow the same evolution as the MOR/Pt(11) catalyst: the pentane conversion decreases from 39% to 6% after the deactivation procedure (17 h at 280 °C) while the iso-pentane selectivity increases form 40% to 68% during the same time. The total deactivation of the blank is expected.
3.1.5 Comparison between the fresh catalyst (after TR treatment) and the regenerated catalyst (after regeneration (REG))
These results are presented in Table 3.
Results of reference tests performed on 200 mg of MOR/Pt(11) fresh catalyst and TREGMOR/Pt(11) regenerated catalyst
| MOR/Pt(11) | TREGMOR/Pt(11) | |
| C5 conversion | 49% | 48% |
| i-C5 selectivity | 66% | 64% |
The activity of the TREGMOR/Pt(11) is quite similar to these of the MOR/Pt(11) fresh catalyst (activity loss of 2%); the observation is the same concerning the iso-pentane selectivity (selectivity loss of 3%). The regeneration procedure allows a deactivated catalyst to recover its original activity.
3.2 Characterization of the catalysts
3.2.1 ICP (elemental analysis)
The results of the elemental analysis are presented in Table 4. The theoretical value of the Si/Al ratio is indicated in parentheses. The Si and Al contents remain quite constant for the three samples (about 35–36% for silicium and 3.1% for aluminum), the Si/Al ratios (11.4) are thus similar and close to the theoretical value (11.5). The sodium percentage decreases after the ionic exchange procedure (from 0.1% for MOR(11) to less than 0.01% for MOR/B(11) and MOR/Pt(11)). The platinum content of the MOR/Pt(11) catalyst sample is about 0.5%.
ICP results of the pure MOR(11) zeolite, the MOR/B(11) blank and the MOR/Pt(11) catalyst
| Samples | Si (% w/w) | Al (% w/w) | Si/Al | Na (% w/w) | Pt (% w/w) |
| MOR(11) | 35.4 | 3.1 | 11.4 (11.5) | 0.1 | – |
| MOR/B(11) | 36.0 | 3.2 | 11.3 (11.5) | <0.01 | – |
| MOR/Pt(11) | 34.9 | 3.0 | 11.6 (11.5) | <0.01 | 0.5 |
3.2.2 Textural determination
The results of the textural determination are presented in Table 5. The surface area values of the MOR/B(11) blank and MOR/Pt(11) catalyst are higher than those of the pure MOR(11) zeolite. The total pore volumes of MOR(11), MOR/B(11) and MOR/Pt(11) are similar (about 0.32 cm3/g). No changes of the micro-pore diameter (about 6.6 Å) and volume (0.19 cm3/g) are observed for the three samples.
Surface areas, total pore volumes, micro-pore volumes and micro-pore diameters of the pure MOR(11) zeolite, the MOR/B(11) blank and the MOR/Pt(11) catalyst
| Samples | Surface area (m2/g) | Total pore volume (cm3/g) | Micro-pore diameter (Å) | Micro-pore volume (cm3/g) |
| MOR(11) | 400 | 0.31 | 6.5 | 0.18 |
| MOR/B(11) | 445 | 0.33 | 6.6 | 0.20 |
| MOR/Pt(11) | 420 | 0.32 | 6.7 | 0.19 |
3.2.3 X-ray diffraction
After the platinum deposition procedure, no new peaks are observed in the diffractograms of the zeolites. In the MOR/Pt(11) catalyst diffractogram, the peak situated at a 2θ angle of 9.8°, corresponding to the (200) plane, is characterized by a lower relative intensity compared to the same peak in the MOR(11) zeolite diffractogram (see Fig. 3). The activation procedure of the catalyst does not alter the catalyst structure at all. The peak corresponding to the (150) plane (situated at a 2θ angle of 22.1°) shows a higher relative intensity after the deactivation procedure (TDMOR/Pt(11) catalyst). This is confirmed if a comparison is made between the diffractogram of the MOR/B(11) fresh blank and the TD*MOR/B(11) deactivated blank samples. After the regeneration procedure, the peak corresponding to the (150) plane decreases for the catalyst.
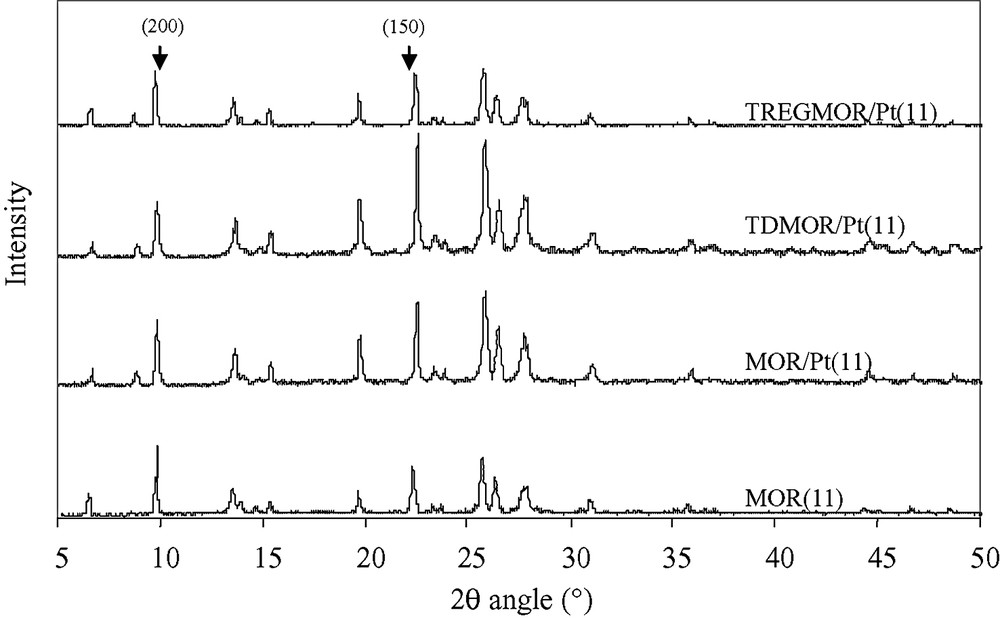
XRD diffractograms of MOR(11) pure zeolite, MOR/Pt(11) fresh catalyst, TDMOR/Pt(11) deactivated catalyst and TREGMOR/Pt(11) regenerated catalyst.
3.2.4 XPS spectroscopy
The Pt4d peaks were chosen in order to calculate the elemental atomic percentages. The MOR/Pt(11), TRMOR/Pt(11), TDLTMOR/Pt(11), TDMOR/Pt(11), TREGMOR/Pt(11) samples were analyzed (Table 6). The XPS atomic ratio of the MOR/Pt(11) catalyst (10.5) is slightly lower than the theoretical (11) and ICP calculated (11.1) values. This ratio increases during the whole deactivation process, i.e. from the TRMOR/Pt(11) sample (10.8) to the TDMOR/Pt(11) strongly deactivated catalyst (11.4). After the regeneration procedure, the Si/Al surface ratio decreases to reach a value (10.7) close to that of the MOR/Pt(11) fresh catalyst. The XPS C/(Si + Al) atomic ratio decreases after the reference test (0.18 for TRMOR/Pt(11)), increases after the deactivation process (0.19 for TDLTMOR/Pt(11) and 0.42 for TDMOR/Pt(11)) and then decreases after the regeneration (0.25 for TREGMOR/Pt(11)).
Si/Al and C/(Si + Al) surface atomic ratios of the MOR/Pt(11) fresh catalyst and the catalysts issued from different tests (TR, TDLT, TD and TREG)
| MOR/Pt(11) | TRMOR/Pt(11) | TDLTMOR/Pt(11) | TDMOR/Pt(11) | TREGMOR/Pt(11) | |
| Si/Al | 10.5 | 10.8 | 11.1 | 11.4 | 10.7 |
| C/(Si + Al) | 0.22 | 0.18 | 0.19 | 0.42 | 0.25 |
No change in the surface carbon nature is observed during the activation, deactivation and regeneration procedures: the nature of the surface carbon corresponds mainly to the C–(C, H) carbon.
XPS analyses on blank samples (MOR/B(11) and TD*MOR/B(11) confirm the increase of the Si/Al and C/(Si + Al) surface atomic ratios and the non-alteration of the coke during the deactivation.
3.2.5 Ammonia adsorption and temperature programmed desorption (NH3-TPD)
The MOR/Pt(11) catalyst is characterized by a 1.3 μmol NH3 per m2 total acidity and amount of 0.8 sites per nm2 acid sites (Table 7). The desorption profiles of the fresh catalyst show two peaks: the first one has a maximum intensity between 255 and 275 °C, whereas the maximum intensity of the second peak is located between 490 and 505 °C (Fig. 4). The first peak is more intense than the second one. The acidity of the sample from the reference test—TRMOR/Pt(11)—is the same as that of the fresh catalyst. The TDLTMOR/Pt(11) deactivated catalyst is characterized by a total acidity loss and an acid site loss of about 50%. The TREGMOR/Pt(11) regenerated catalyst represents a total acidity of 1.4 μmol NH3 per m2, i.e. about identical to the acidity of the MOR/Pt(11) fresh catalyst sample (1.3 μmol NH3 per m2). Compared with the TRMOR/Pt(11) catalyst issued from the reference test, the desorption profile of the TDLTMOR/Pt(11) deactivated catalyst is characterized by an identical shape but the intensities of the desorption peaks of the deactivated sample are lower than those of the TRMOR/Pt(11) catalyst.
Total acidity and acid sites density of MOR/Pt(11) fresh catalyst, TRMOR/Pt(11) catalyst after reference test, TDLTMOR/Pt(11) deactivated catalyst and TREGMOR/Pt(11) regenerated catalyst
| Samples | MOR/Pt(11) | TRMOR/Pt(11) | TDLTMOR/Pt(11) | TREGMOR/Pt(11) |
| Total acidity (μmol NH3 per m2) | 1.3 | 1.2 | 0.7 | 1.4 |
| Acid sites density (sites per nm2) | 0.8 | 0.7 | 0.4 | 0.8 |
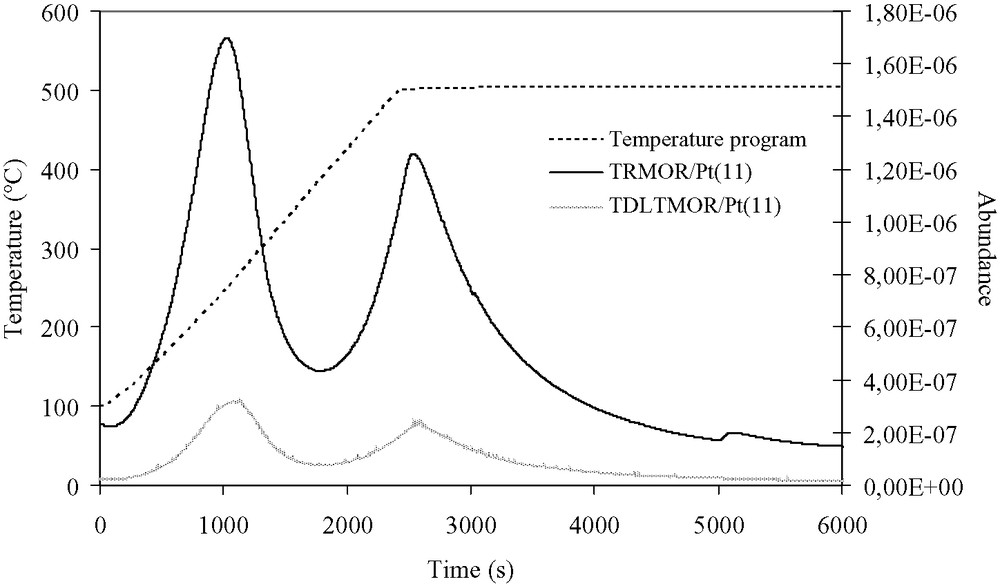
Ammonia desorption profiles of the TRMOR/Pt(11) catalyst issued from the reference test and the TDLTMOR/Pt(11) deactivated catalyst.
The total acidity of the MOR/B(11) fresh blank sample (Table 8) is identical to that of the MOR/Pt(11) fresh sample (1.4 μmol NH3 per m2). After the deactivation procedure, the TD*MOR/B(11) (0.2 μmol NH3 per m2) loses about 85% of the acidity of the original MOR/B(11) fresh blank sample. The observations concerning the intensity loss of the TD*MOR/B(11) deactivated blank sample desorption profile (compared with the MOR/B(11) fresh blank) are also valid.
Total acidity and acid sites density of MOR/B(11) fresh blank and TD*MOR/B(11) deactivated blank
| Samples | MOR/B(11) | TD*MOR/B(11) |
| Total acidity (μmol NH3 per m2) | 1.3 | 0.7 |
| Acid sites density (sites per nm2) | 0.8 | 0.4 |
3.2.6 Platinum efficiency measurement by CO chemisorption
On the MOR/Pt(11) catalyst, the platinum efficiency is about 38%. The TDMOR/Pt(11) deactivated catalysts lose about 50% of their Pt efficiency. A regeneration procedure (under 40 ml/min of O2 at 100 °C during 1 h and at 400 °C during 2 h) allows the TDMOR/Pt(11) deactivated catalyst to recover its original platinum efficiency.
3.2.7 NMR-spectroscopy
27Al-NMR: all samples reveal a strong signal at about 52 ppm, corresponding to tetrahedrally co-ordinated aluminum, and all samples contain a small amount of octahedrally co-ordinated aluminum as well.
13CP/MAS NMR: all samples show signals due to aliphatic hydrocarbons—three lines at about 14 ppm (methyl groups), 23 ppm (methylene groups in the two-position) and 32 ppm (methylene groups in three-position). In addition, signals in the region representative for aromatic hydrocarbons—at about 128 ppm (aromatic ring carbons with hydrogen connected) and at 142 ppm (aromatic ring carbons without hydrogen connected)—were observed for the used catalysts.
3.2.8 IR-spectroscopy
The IR-pyridine results are in line with the above results from the NH3-TPD study concerning the evolution of the acidity of the samples during deactivation. Unexpectedly, the areas under the IR bands of the deactivated catalyst do not seem to diminish compared to the MOR/Pt(11) fresh sample. In fact, the areas seem even a little bit larger than for the fresh catalyst MOR/Pt(11). This is not completely in line with the above NH3-TPD results, however, the differences are very small.
4 Discussion
The aim of this work was to obtain several catalyst samples at different stages of deactivation. With the different procedures used (activation, deactivation), some samples were produced: fresh catalyst (MOR/Pt(11), activated catalyst (TRMOR/Pt(11)), slightly deactivated catalyst (TDLTMOR/Pt(11)) and strongly deactivated catalyst (TDMOR/Pt(11)). Consequently, they could be characterized in order to get information about the deactivation causes and mechanism. The blanks (MOR/B(11) and TD*MOR/B(11)) were also used to check and confirm some observations made about the deactivation of the catalyst samples.
4.1 Catalytic performances of the fresh catalysts: comparison between MOR/Pt(11) and MOR/B(11)
The weak conversion in pentane observed for MOR/B(11) compared to MOR/Pt(11) (25% against 74% at 280 °C) is explained by a rapid deactivation of MOR/B(11) at the beginning of the reaction. This rapid deactivation is due to the absence of platinum on the surface of the blank sample. Molecular recombination reactions and coke formation are favored because there is no platinum to hydrogenate the carbon residue formed on the surface of the zeolite. The quick coke formation blocks the pore openings and inhibits the acid sites of the mordenite, explaining the loss in activity. However, there is no formation of a new crystalline phase during the reaction (checked by XRD). Some modifications of the crystalline planes of the mordenite cannot be excluded, but this must be verified in more detail. Generally, in the literature, it is suggested that the strength and the density of the acid sites, the amount of octahedrally co-ordinated aluminum (which are related to the Si/Al ratio), the platinum efficiency and loading, and the textural properties of the zeolite (presence of a mesoporous network, pore diameter, porous volume…) are important parameters controlling the performance of the catalyst.
4.2 Deactivation of the catalysts
One consequence of catalyst deactivation is loss of acidity. This loss is correlated with the formation of coke at the acid sites. Deactivation could be accelerated by a high density and the strength of acid sites or a low micro-pore diameter. However, we cannot exclude that a lower amount of octahedrally co-ordinated aluminum could also be at the origin of deactivation. In fact, zeolites with a Si/Al atomic ratio equal to 5, contain a small amount of octahedrally co-ordinated aluminum and are more deactivated (13). The presence of these sites is probably important for the high activity. Changes in the C/(Si + Al) XPS atomic ratio support the coke deposition. The C1s peak (XPS) increases from 5.61% (for TRMOR/Pt(11)) to 12.01% (increase of 114%) for TDMOR/PT(11). It could also be argued that a high micro-pore diameter allows a lower coke deposition in this kind of catalyst. Part of this coke is probably deposited in the deepest place of the pores.
Platinum dispersion decreases during deactivation, by 50% for TDMOR/Pt(11). A decrease in the dispersion leads to a loss in the co-operation between the acid and metallic sites (hydrogenation and dehydrogenation sites) of the catalysts. From our results, we cannot clarify definitively whether the loss of dispersion is due to sintering of Pt or coverage of Pt by coke (the XPS signal of Pt is too weak to be quantified accurately). But there is a clue that could confirm that the loss of efficiency is due to a coverage of the noble metal by carbon residue: a deactivated catalyst treated with an oxygen flow (1 h at 100 °C and 2 h at 400 °C) has the same platinum dispersion as a fresh catalyst (i.e. 38%). The fact that the XPS Si/Al atomic ratio increases after deactivation could be an indication that some coke is formed on alumina (TDLTMOR/Pt(11) and TDMOR/Pt(11)).
The XRD diffractograms showed that the peaks corresponding to the (150) plane increase during deactivation (observation confirmed by the blank samples). It could be argued that this plane is less active. This change is not high enough to explain the deactivation by itself. However, this observation indicates that the zeolite is not stable with respect to the structure during the reaction. When the temperature is increased (300 °C) the deactivation is accelerated. These changes are more significant. The other deactivation factors (as discussed above) seem to explain more correctly this acceleration.
4.3 Regeneration of deactivated catalysts
The TDMOR/Pt(11) catalyst recovers some activity after regeneration because this procedure liberates the acid sites on MOR/Pt(11) and probably the platinum particles (required for the hydroisomerization reaction) covered by carbon residues. XPS indicates that the surface Si/Al atomic ratio presents the same value in the fresh catalyst and the catalyst after regeneration. The fact that the regeneration process eliminates the coke at the surface of a deactivated catalyst is confirmed by a 36% loss in C1s signal intensity for TREGMOR/Pt(11) compared with the TDMOR/Pt(11) deactivated catalyst. It is well known that if the acid densities of the sites are high, it could be admitted that the intermediates (carbocations and olefins) are submitted to recombination reactions, which avoid the structuring or arrangements of molecules (or intermediates) to more stables oligomers for coke formation. This could indicate that the coke formed is less structured and is formed by short and less branched molecules, which are less stable and more easily burned off during the regeneration procedures. The C/(Si + Al) atomic ratios seem to be easily recovered for TREGMOR/Pt(11) (for the fresh catalysts the XPS C/(Si + Al) atomic ratio is 0.22; 0.42 after deactivation and 0.25 after regeneration). It is important to note that the XPS analyses of the carbon peak do not show any differences. For each kind of catalysts (activated, deactivated and regenerated), only peaks corresponding to C–(C, H) (284.8 eV), C–O (286.5 eV) and O=CO–(H, R) (289.5 eV) and in the aliphatic region at 13.5 ppm (methyl group), 22.5 ppm (methylene group in two-position) and at 34.5 ppm (methylene group in three-position), aromatic ring carbons with hydrogen connected (128 ppm), and aromatic ring carbons without hydrogen connected (142 ppm) were observed (XPS and NMR analysis, respectively). This strongly suggests that the nature of coke is similar during all the activation, deactivation and regeneration processes.
Results confirm the fact that the catalysts containing different Si/Al atomic ratios (11 in the present work), and 5 and 18 in a previous work [13] are deactivated by coke showing the same nature. In order to explain the difficulties to regenerate catalysts that have been deactivated during deactivation processes, literature defines a “soft” and a “hard” coke formation, hard coke being more difficult to burn.
The fact that, in our case, the reaction operating conditions are different could explain the difference with literature [14,15]. We work with a light raw feedstock (C5), which is different from the other charges (formed by heavy and/or more ramified hydrocarbons, easier to be cracked). In this last case, a recombination of fragments is favored, probably to form what is called « hard » coke. In our case, the only fragments to be formed are C4, C3 (and C2) which have less chances to be recombined. The nature of the coke will be the same in all parts of the samples (on the surface or inside the zeolites). In addition we work under atmospheric pressure, contrary to other processes working at higher pressure (10–30 bar). This high pressure could also favor cracking and recombination of molecules. As discussed previously [13], our results show that coke is probably always the same in nature, and the difficulties in eliminating coke formed in commercial conditions or working with high hydrocarbons, could be due, at least, to the fact that under these conditions, coke is formed in the deepest location of the micropores and is thus more difficult to eliminate.
The change in the relative intensity of the (150) plane when zeolite deactivates is clearly observed experimentally. This observation has been verified several times. During deactivation, the intensity of the (150) plane increases. Regeneration decreases the intensity of this peak. This could be interpreted as a reversibility of the zeolite during the deactivation–regeneration processes. One hypothesis could be that some part of the zeolite can be deformed under certain constraints (like, for example, coke formation) leading to a more important intensity of the (150) plane. Elimination of coke could re-establish the initial structure of the zeolite.
5 Conclusions
- • Rapid deactivation of pure mordenite (Si/Al = 11) is due to the absence of platinum on the surface of the blank sample. Coke deposition inhibits the acid sites of the mordenite. A modification of the crystalline planes of the mordenite cannot be excluded during deactivation.
- • Catalyst deactivation is correlated with the formation of coke at the acid sites. It is suggested that high micro-pore diameter in mordenite containing Si/Al = 11, allows a lower coke deposition.
- • Platinum dispersion decreases during deactivation. This could be due to coverage of Pt by coke.
- • Mordenite could be unstable with respect to the structure during the reaction. Plane (150) of the mordenite increases during deactivation.
- • Catalyst recovers activity after regeneration. Regeneration process eliminates the coke on acid sites of mordenite and on the platinum particles. Coke is probably low structured and is formed by short and less branched molecules, which are easily burned off during the regeneration procedures.
- • It is suggested that in commercial deactivated catalysts, the coke is principally formed in the micropores (parallel to the catalyst surface), where it is more difficult to perform coke elimination.
Acknowledgements
The authors gratefully acknowledge the “Fonds National de la Recherche Scientifique (FNRS)” of Belgium for their financial support for the acquisition of the XPS and XRD equipments.
1 In memory of Professor Paul Grange.