

1 Introduction
Thermoelectric solids are promising materials in the scope of energy saving such as recovering heat for electricity production, or vice-versa for advanced refrigeration devices avoiding the use of the classical carbon halides [1]. The optimised conditions to get good thermoelectric materials have been discussed by Slack, leading to the concept of PGEC materials (phonon-glass and electrical crystal) [2], i.e. materials with a high electronic conductivity and a poor thermal conductivity. For that purpose, Slack suggests to select solids with structures having large and weakly bounded ions that can ‘rattle’ inside oversized cages of the host network independently of its own phonon modes. Clathrate-like materials of silicon, germanium or tin, discovered 40 years ago [3], appeared as suitable candidates [4].
For thermoelectric devices, one needs n and p-type conductors in order to make a p–n junction. N-type clathrates, in which electron carriers are supplied by the alkali or alkaline-earth atoms inside the cages are the main members of this family. Recently, new type-I clathrate compounds containing non-metal electron-acceptor atoms in the cages (tellurium and iodine) have been synthesized under high-pressure conditions [5,6].
Another possibility for controlling the electron counting in these materials can be obtained by adjusting the concentration of the electron donor – as the large barium atoms within the cages _ with that of the electron acceptor atoms in substitution for silicon in the framework.
In this scope, Cordier and Woll [7] have shown that some transition metal atoms like Ni, Cu, Pd, Ag, Pt or Au can partially substitute for Si ones in compounds Ba8AxSi46–x, having a type-I clathrate structure (Pmn), with x ranging from 1.8 for Ni to 6 for Au. Concerning the gold-doped clathrate, the results were obtained by X-ray diffraction refinements on single crystals, but no data have been given concerning the existence of a possible homogeneity range for these phases. More recently, Hermann et al. [8] have confirmed the composition Ba8Au6Si40 and the metallic character of the samples.
Using the classical Zintl–Klemm rules, one can expect an exact electron compensation for x = 5.33, in the case of atoms such as Au, with 5d10 6s1 configuration and three missing electrons to achieve that of the fourteenth group of Si. In the present work, we report on the preparation and the structural and physical characterizations of n and p-type samples of composition Ba8AuxSi46–x, with x = 5.4 and 5.9.
2 Experimental
2.1 Synthesis
High-purity elemental Ba, Si and Au, taken in the stoichiometric atomic ratio 8/40/5.33 are quickly melted (30s) in a water-cooled copper crucible placed under purified argon in a high-frequency furnace, and finally rapidly quenched. Three successive operations lead to homogeneous ingots, containing small single crystals of size appropriated to X-ray diffraction measurements. The ingots were cut into two parts, one being annealed at 900 °C during 120 h in a silica tube sealed under vacuum. In the following, this part will be called A sample (annealed) and the first one AG sample (as grown).
2.2 X-ray characterizations
Powder X-ray patterns of the samples were obtained using a Philips 1730/PW/1820 and a Philips X'Pert MPD diffractometer, with a Bragg–Brentano geometry and a Cu target tube (λ (Kα1,2) = 1.5418 Å). Single crystal measurements were collected on a Nonius Kappa CCD diffractometer with a graphite monochromator (λ (Kα1,2) = 0.71073 Å). The raw data for single crystals were processed using DENZO-SMN program suite and empirical absorption correction was carried out using Scalepack [9].
Refinements have been carried out in the space group Pmn, using as starting atomic positions those of Na8Si46 and those of ref. [7]. The experimental data are summarized in Table 1.
Crystal data, data collection and refinement methods for AG and A samples
| Crystal data | AG sample | A sample |
| Chemical formula | Ba8Au5.43Si4057 | Ba8Au5.89Si40.11 |
| Formula weight (g mol–1) | 3307.7 | 3385.3 |
| Crystal system | Cubic | Cubic |
| Space group | (Pmn) | (Pmn) |
| Unit cell dimension (Å) | a = b = c = 10.414(1) | a = b = c = 10.419(1) |
| Unit cell volume (Å3) | 1129.4(3) | 1131.0(3) |
| Z | 1 | 1 |
| Calculated density (Dx) | 4.86 | 4.97 |
| Crystal shape | Platelet | Prism |
| Crystal dimensions (μm) | 20 × 50 × 50 | 15 × 20 × 70 |
| Data collection | ||
| Diffractometer | Nonius Kappa CCD | Nonius Kappa CCD |
| Data collection method | ϕ/Ω scans | ϕ/Ω scans |
| Temperature (K) | 293 | 293 |
| Radiation | Mo (Kα1,2): λ = 0.71073 Å | Mo (Kα1,2): λ = 0.71073 Å |
| Monochromator | Graphite | Graphite |
| Absorption coefficient (mm–1) | 27.32 | 27.28 |
| θ range (°) | 3.5 to 29.94 | 3.5 to 34.94 |
| h, k l, range | –14 < h, k, l < 14 | –16 < h, k, l < 16 |
| Collected reflections (I > 2 σ(I)) | 9203 | 15 183 |
| Independent reflections (Rint) | 313 (0.041) | 463 (0.034) |
| Refinement | ||
| Absorption correction | Empirical, using Scalepack software | Empirical, using Scalepack software |
| Refinement method | Full matrix least-squares on F2 | Full matrix least-squares on F2 |
| Refined parameters | 18 | 18 |
| Extinction coefficient | 0.00042(8) | 0.00116(7) |
| Goodness-of-fit on F2 | 1.48 | 1.30 |
| Final R indices* | R1 = 0.033; wR2 = 0.049 | R1 = 0.025; wR2 = 0.041 |
| Largest difference peak and hole (eÅ–3) | 1.7 (near Au3) and –1.0 | 1.4 (near Au3) and –1.3 |
2.3 29Si MAS NMR
The data have been collected on a Bruker Advance 300 Spectrometer at 59.7 MHz , using solid-state Magic Angle Spinning (MAS) at a frequency of 10 kHz, with synchronized Hahn echo (90° pulse of 3 μs). The repetition time (2s) was checked to lead to total observation of the signals.
2.4 Electrical measurements
Electrical conductivity and Seebeck voltage measurements have been carried out between 4.2 and 300 K on both samples, in previously described home-made devices [10,11].
3 Results and discussion
AG and A samples consisted of dark grey ingots with metallic lustre. Their X-ray diffraction patterns appeared quite similar and corresponded to a phase of cubic symmetry with a ~ 10.42 Å, (Fig. 1). However, a careful observation of the A pattern shows very weak additional lines attributed to the BaSiO3 impurity phase, a result which implies that the Ba and Si content in A sample has been decreased, and the Au concentration consequently increased.

X-ray powder diffraction pattern of A sample, showing in inset the very weak lines of BaSiO3.
This point was confirmed by our single crystal data, listed in Tables 2 and 3 for both the AG and A crystals, and compared with those of ref. [7]. Refinement cycles involving 6 Au atoms in the 6c site gave unsatisfying results, the Fourier difference map showing some electron excess on the 24k site and some deficit on the 6c one. By placing a few Au atoms in the 24k (0.29 for AG and 0.33 for A crystal), and conversely a few Si atoms on the 6c (0.86 for AG and 0.44 for A crystal), a significant improvement of the final R indices was obtained (R1 = 0.033, wR2 = 0.049 for AG and R1 = 0.025; wR2 = 0.041 for A). In the refinement process, the Au-Si distribution within the 6c, 16i and 24k sites, as well as the corresponding thermal parameters, were refined together, assuming a total occupancy of the three sites. The final compositions were the following: Ba8Au5.4Si40.6 for the AG sample, and Ba8Au5.9Si40.1 for the A one. It can be observed that the composition of the AG sample is very close to that corresponding to the Zintl-phase limit, Ba8Au5.33Si40.67.
Site occupancy, atomic coordinates, isotropic and anisotropic displacement parameters (Å2) for the AG and A samples. The data reported in previous work are given for comparison
| AG sample | A sample | Cordier and Woll [7] | |
| Composition | Ba8Au5.43Si40.57 | Ba8Au5.89Si40.11 | Ba8Au6Si40 |
| 2 Ba1 in 2a site (0,0,0); U11 = U22 = U33; U23 = U13 = U12 = 0 | |||
| Ueq | 0.0089(2) | 0.0083(2) | 0.014(1) |
| U11 | 0.0089(2) | 0.0083(2) | 0.014(1) |
| 6 Ba2 in 6d site (1/4,1/2,0); U22 = U33; U23 = U13 = U12 = 0 | |||
| Ueq | 0.0221(2) | 0.0179(2) | 0.028(1) |
| U11 | 0.0163(4) | 0.0130(2) | 0.022(2) |
| U22 | 0.0250(3) | 0.0204(2) | 0.030(1) |
| (6 – m) Au1 and m Si1in 6c site (1/4,0,1/2) | |||
| U22 = U33; U23 = U13 = U12 = 0 | |||
| m | 0.86(2) | 0.44(2) | 0 |
| Ueq | 0.0095(2) | 0.00847(9) | 0.0170(7) |
| U11 | 0.0111(3) | 0.0099(1) | 0.019(1) |
| U22 | 0.0087(2) | 0.0078(1) | 0.0160(7) |
| 16 Si2 in 16i site (x, x, x) | |||
| U11 = U22 = U33; U23 = U13 = U12 | |||
| x | 0.1840(1) | 0.1839(1) | 0.1832(5) |
| Ueq | 0.0089(4) | 0.0084(2) | 0.006(1) |
| U11 | 0.0089(4) | 0.0084(2) | 0.014(2) |
| U23 | –0.0008(4) | –0.0007(2) | –0.002(2) |
| (24 – n) Si3 and n Au3 in 24k site (0, y, z); U13 = U12 = 0 | |||
| n | 0.29(3) | 0.33(3) | 0 |
| y | 0.3066(1) | 0.3071(1) | 0.3059(7) |
| z | 0.1176(2) | 0.1171(1) | 0.1187(7) |
| Ueq | 0.0098(3) | 0.0103(3) | 0.009(3) |
| U11 | 0.0087(7) | 0.0085(5) | 0.009(3) |
| U22 | 0.0111(7) | 0.0137(5) | 0.012(3) |
| U33 | 0.0097(7) | 0.0088(5) | 0.006(3) |
| U23 | –0.0012(5) | –0.0014(3) | –0.001(3) |
Selected inter-atomic distances for Ba8Au5.43Si40.57 (AG sample) and Ba8Au5.89Si40.11 (A sample). The data reported in previous work are given for comparison
| Distance (Å) | AG sample | A sample | Cordier and Woll [7] | |
| Ba8Au5.43Si40.57 | Ba8Au5.89Si40.11 | Ba8Au6Si40 | ||
| Ba1(2a) | 8 × Si2 | 3.319(2) | 3.319(1) | 3.306(9) |
| 12 × Si3, Au3 | 3.420(2) | 3.424(1) | 3.420(7) | |
| Ba2(6d) | 8 × Si3, Au3 | 3.512(1) | 3.509(1) | 3.523(5) |
| 4 × Si1, Au1 | 3.682(1) | 3.684(1) | 3.685(0) | |
| 8 × Si2 | 3.870(1) | 3.872(1) | 3.877(3) | |
| 4 × Si3, Au3 | 4.026(1) | 4.034(1) | 4.016(7) | |
| Au1 (and Si1) (6c) | 4 × Si3, Au3 | 2.441(2) | 2.441(1) | 2.442(7) |
| 4 × Ba2 | 3.682(1) | 3.684(1) | 3.685(0) | |
| Si2(16i) | 1 × Si2 | 2.381(4) | 2.385(2) | 2.413(2) |
| 3 × Si3, Au3 | 2.404(1) | 2.409(1) | 2.394(5) | |
| 1 × Ba1 | 3.319(2) | 3.319(1) | 3.306(9) | |
| Si3 (and Au3) (24k) | 2 × Si2 | 2.404(1) | 2.409(1) | 2.394(5) |
| 1 × Si1, Au1 | 2.441(2) | 2.441(1) | 2.442(7) | |
| 1 × Si3 Au3 | 2.449(3) | 2.439(2) | 2.474(1) | |
| 1 × Ba1 | 3.420(2) | 3.424(1) | 3.420(7) | |
| 2 × Ba2 | 3.512(1) | 3.509(1) | 3.523(5) |
The thermal evolution of the Seebeck voltage and the electrical resistivity is depicted in Figs. 2 and 3 for both the AG and A samples, respectively. Obviously they behave very differently. The AG sample is an n-type semi-conductor – or a poor metal (R4.2 K/R300 K ~ 3) – with negative and low values of α (–7 μV K–1 at 300 K) and a classical linear evolution with T. The A sample is a p-type metal, with positive values of α and a room-temperature conductivity increased by one order of magnitude compared to AG. The slope of the α(T) evolution is unexpectedly greater for the most conducting sample, but one has to keep in mind that in such kind of materials, very different types of atomic state could be present at the Fermi level: 3s and 3p silicon orbitals of course, but also the 6s/Au orbital for the valence band and the 6s/Ba one for the conduction band.
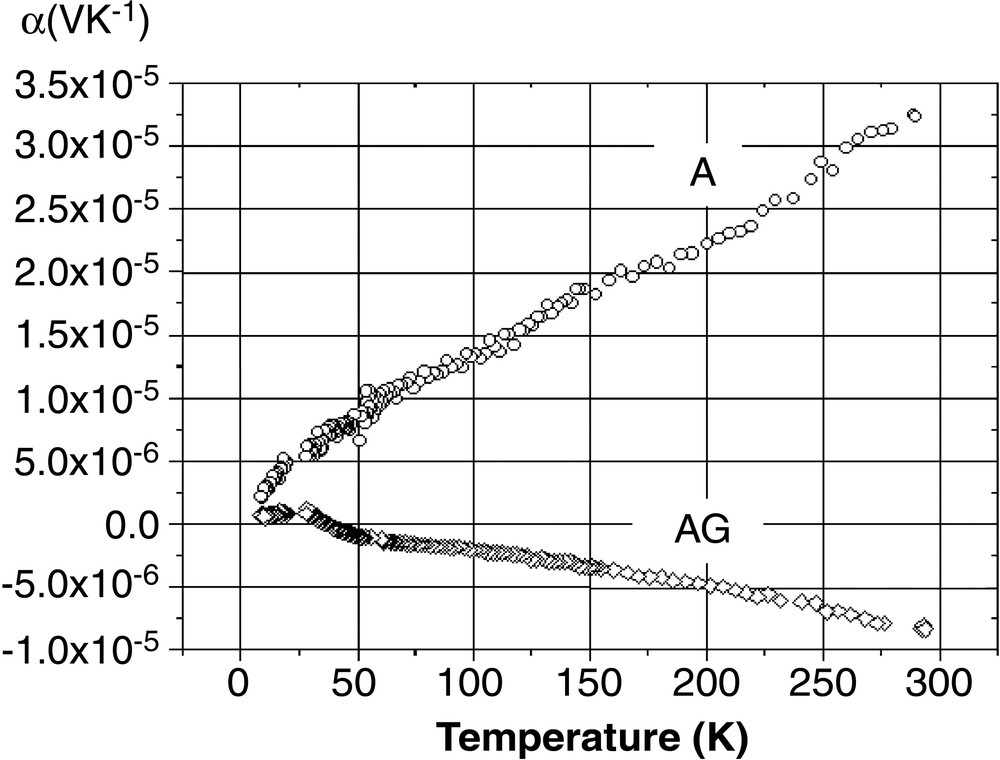
Thermal variation of the Seebeck voltage for the AG and A samples.
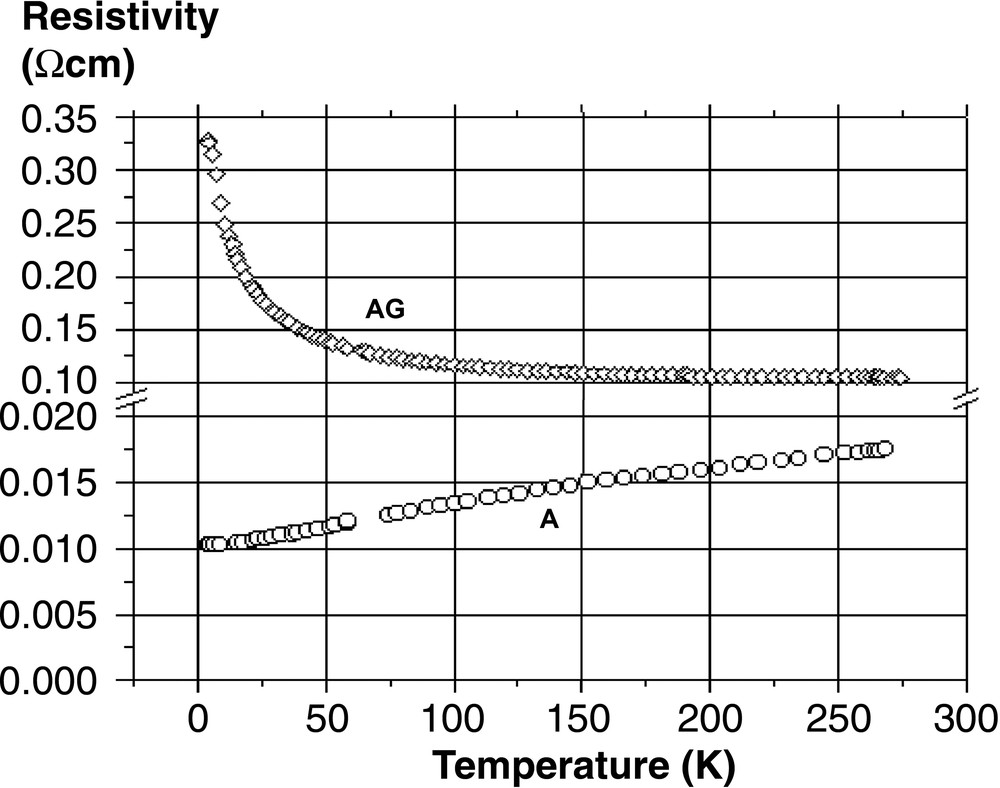
Thermal evolution of the resistivity of the AG and A samples, as measured by the four-contact probe method.
The 29Si MAS NMR spectra of both samples given in Fig. 4 present also some differences. The AG sample is characterized by a broad line centred at approximately 200 ppm, and the A one by two signals:
- – a broad line with a shift of approximately 600 ppm;
- – a very broad band spread over 1000 ppm.
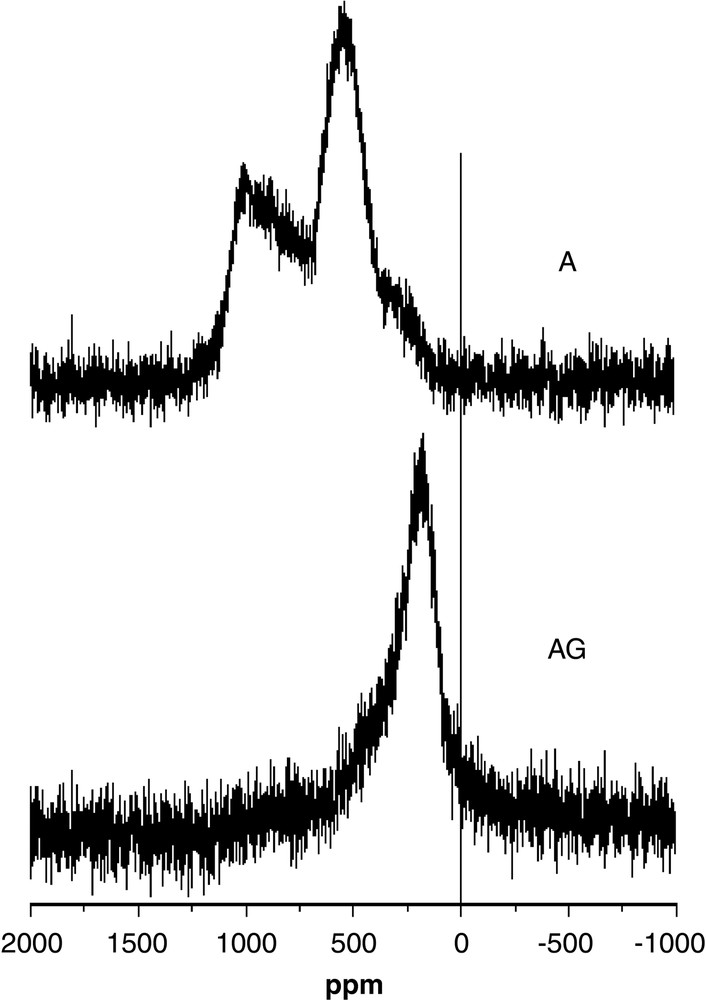
29Si MAS NMR spectra of AG and A samples at 293 K.
These shift values lie in the range of the Knight shifts observed for other metallic type-I or type-II clathrates such as Na8Si46, K8Si46, NaxBaySi46 or Rb8Na16Si136 [12–14], and are thus in agreement with the good conductivity of the AG and A samples. The magnitude of the Knight shift is given by the relationship: Ks = (8π/3) χS <Ψ(RN)2>EF, where χS is the Pauli spin susceptibility and <Ψ(RN)2>EF the 3s electron amplitude of the wave function at the nucleus, averaged over the Fermi surface. The values observed therefore imply various contributions of the 3s orbital of Si to the band at the Fermi level.
In addition to their shape, the spectra for samples AG and A also strongly differ in their magnitude, as integration of the spectrum of the AG sample leads to a value approximately half that for the A sample, when corrected for the amount of sample. Quantitativity can of course not be fully guaranteed for Hahn echo NMR experiments such as those reported here, but they are the only way for observing such broad signals. We have run the same NMR experiment for the parent K8Si46 sample, which leads to a very similar integral value per Si atom as for the A sample, although with narrower signals [15]. This suggests that these NMR spectra are close to quantitative, at least when compared to each other. It therefore appears that approximately half the Si nuclei in the AG sample are not observed by NMR in Fig. 4, whereas all are observed for the A sample.
It is reasonable to assume that, together with the change in stoichiometry, annealing leads to a better ordering of the Au/Si distribution within the 6c and 24k sites. For the AG sample, which is the less conducting one due to some Anderson-type localization, disorder may widely differentiate the various Si atoms of a given site, and therefore their contribution to the Fermi level, so that the corresponding Knight-shifted NMR signal is not resolved. The silicon atoms in the different sites of the unit cell are differently affected by disorder: the Si (24k) atoms, which are the only ones neighbouring with the strongly perturbed 6c sites should indeed be the most affected (Table 3). The contribution of the other kind of Si atoms (16i) to the Fermi level appears better defined, since the corresponding NMR signal is observed, although with considerable broadening. For the A sample, partial ordering on the 6c site might decrease this disorder effect, so that both types of Si atoms are observed by NMR, even though one of the lines exhibits a broad distribution over 1000 ppm.
It is thus clear that the Knight shift for the resolved Si atoms (which we consider to be the16i ones) is larger for the A sample (ca 600 ppm) than for the AG one (ca 200 ppm). We now discuss this result on the basis of band schemes.
Fig. 5 depicts the band scheme for this type of materials. In the I or II clathrate-type silicon host lattice, the valence band (VB) is usually separated from the conduction band (CB) by a gap of approximately 2 eV (Fig. 5a) [16,17]. It is expected that, due to a strong s–p hybridisation, the top of the VB is usually concerned by bonding p–p states and the bottom of the CB by antibonding s-s ones at the border of the Brillouin zone (π/a for a 1D system) (Fig. 5a).
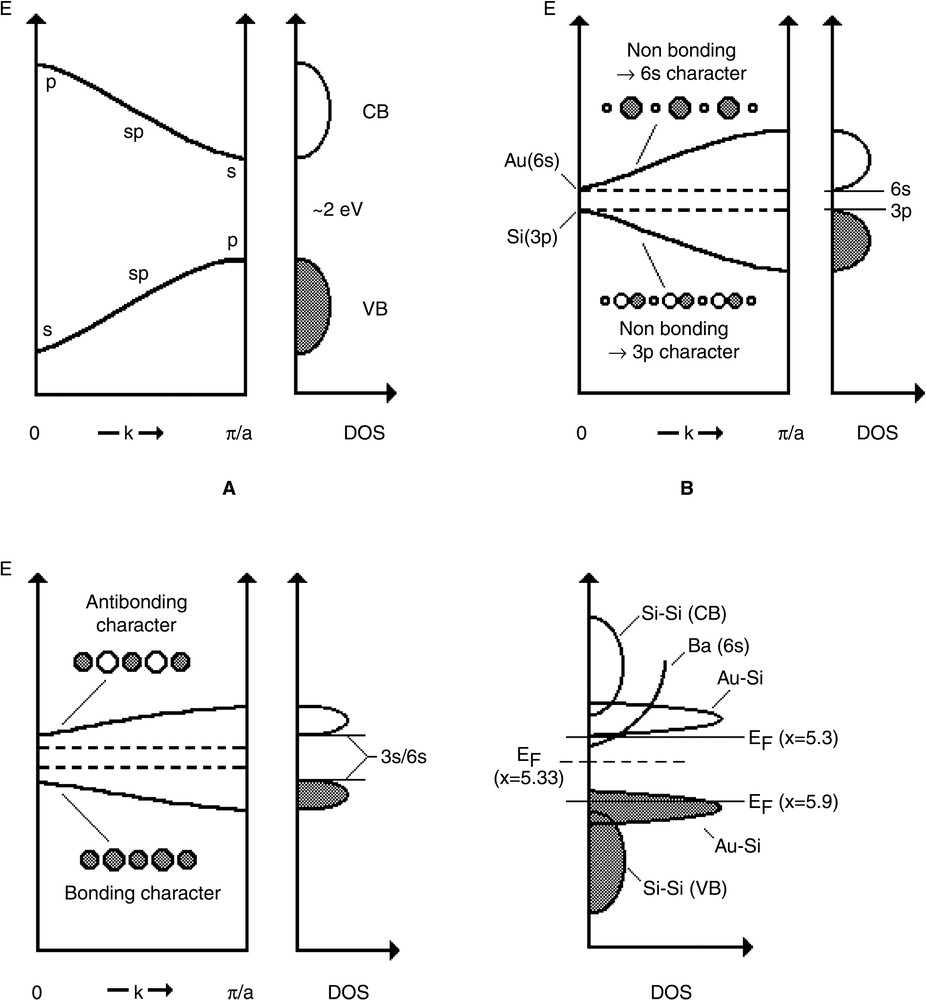
Schematic view of (a) Si–Si interactions, (b) Si–Au interactions without hybridisation, (c) Si-Au interactions with hybridisation and (d) the total density of state for Ba8AuxSi46–x, with x = 5.3 and 5.9. A 1D model is assumed for these schemes.
The bonding Au–Si states contributing to the VB, (VB(Au–Si)), should be located near the top of this band. The proximity of the Coulomb integrals <Hii> of Si(3p) (–7.6 eV) and Au(6s) (–7 eV) leads to a large mixing of these orbitals. Owing to their different symmetry, the gap should be in the centre of the Brillouin zone (k = 0). Using a Tight Binding band model, one can separate non bonding Si(3p) states (VB) from non bonding Au(6s) states (CB) by a small gap of a few tenth of eV (Fig. 5b).
For the A sample, with the highest gold content (x = 5.9), the 16 electrons of the eight Ba atoms cannot fill completely this VB, for which 5.9×3 = 17.7 e– should be necessary, leading to a p-type metal. A contribution of the Au(6s) orbital, with large radial expansion of its wave function, could explain the high conductivity of A. However, the high positive value of Ks should also imply a large contribution of the silicon 3s orbitals, in contradiction with the band scheme of Fig. 5b.
For the AG sample, with the lowest gold concentration (x = 5.4), we have to assume that, in fact, this value could be slightly smaller (~5.3) in order to explain the n-type behaviour. The low value of Ks (~200 ppm) involves a small but significant contribution of 3s at EF, at the bottom of the CB, which is again not in agreement with the band scheme of Fig. 5b.
However, hybridisation of the Si(3p) orbitals with the Si(3s) should also be considered in the Au–Si band scheme. At k = 0, this contribution is maximum, since it makes now bonding and anti-bonding these previously non-bonding states (Fig. 5c). This hybridisation contributes of course to increase the gap. It has a stabilizing effect as long as the conduction band is nearly empty and the valence band nearly full (Fig. 5d). In addition, the bottom of the conduction band should contain a large amount of the Ba(6s) states (Hii = –4.3 eV), as demonstrated for the NaxBaySi46 superconducting materials, which dilutes the contribution of the Si(3s), leading to the band scheme of Fig. 5d. Thus the contribution of the Si(3s) orbital to the Fermi level for the A sample appears higher than that of the AG sample, which is now consistent with the higher Knight shift observed by NMR for the A sample (~600 ppm) than for the AG sample (~200 ppm).
4 Conclusion
We have obtained single crystals of the Ba8AuxSi46–x compound, with x ranging from 5.4 to 5.9. The results of the structure analysis are very close to those given by previous authors for Ba8Au6Si40. However, we found a lower gold content within the 6c sites, as well as a very weak substitution rate of Au for Si within the 24k sites. This variation in composition allows very different behaviours: a n-type semi-conductor close to a metal, for the sample having the lowest gold content, and a p-type metal for the other. 29Si MAS NMR spectra are in agreement with the high conductivity of the samples, which implies a strong contribution of the Si(3s) orbitals at the Fermi level for x = 5.9 and a moderate one for x = 5.4.
However, we observed low values of α for both the n- and p-type compositions of this clathrate-I compound, precluding the use of this material as a high-efficiency thermoelectric device.
Supplementary material
The supplementary material has been sent to the Fachinformationcentrum Karlsruhe , Abt. PROKA, 76344 Eggenstein-Leopoldshafen, Germany as supplementary material Nos. CSD-414465 and CSD-414466 for the annealed and as grown sample, respectively) and can be obtained by contacting the CCDC/FIZ (quoting the article details and the corresponding CSD numbers).