

1 Introduction
In the field of fluorescence studies, metal–ligand complex (MLC) is the term used to indicate the transition-metal complexes containing different ligands [1]. A large number of papers dealing with this topic has been reported in the literature during that last 20 years. Because of the peculiar photo-physical properties displayed by such complexes [1], MLC's were originally studied for solar-energy conversion [2–4], but now they find wide applications in biophysics. Since they possess long lifetime fluorescence [1,5], they can be employed for gated-detection, thus suppressing the interference of short lifetime bio-macromolecule autofluorescence [6]. Besides, MLC's show intrinsic light emission anisotropy, which allows to obtain further information on macromolecular dynamics and makes them suitable for the investigation of DNA dynamics and for the study of domain-to-domain motions in proteins and membranes [1].
Even if the ruthenium-based complexes are more common, many osmium (and rhenium) complexes have shown to be successful for several applications. In particular, osmium MLC's are characterized by high chemical and photochemical stability with respect to ruthenium ones, but at the same time by a lower efficiency in the fluorescence emission. Such differences are, of course, associated with electronic factors, as extensively described in the literature [7].
However, it is worth noting that osmium MLC's involve mainly ‘classical’ σ-donating ligands and only few contain ligands with π-acceptor properties [8].
In a previous paper [9] we reported the first two x-ray structures containing a carbon monoxide ligand in the coordination sphere of an osmium-based MLC and in this work we also investigated the effect of the counterion balancing the positive charge of the [Os(bpy)2(CO)Cl]+ (bpy = 2,2′-bipyridine) cation, by comparing the Otf– (Otf– = triflate, CF3SO3–) anion in the [Os(bpy)2(CO)Cl]+Otf– complex (1), with the PF6– anion in the [Os(bpy)2(CO)Cl]+PF6– complex (2), described in [9]. The crystal structure of 1 was established by single crystal X-ray diffraction analysis, while the structure in solution was investigated by NMR techniques. Finally some theoretical gas-phase calculations were carried out to obtain a reliable model for the disorder of the Cl and CO ligands and of the triflate anion found in the solid state and for the estimate of the geometric and energetic features of the complex in apolar solution.
2 Experimental
2.1 Synthesis
[Os(bpy)2(CO)Cl]+Otf– (1) (where Otf– = CF3SO3–) was synthesized from [Os(bpy)2(CO)(Otf)]+(Otf)- by stirring 20 mg of the complex in CH2Cl2 for 4 h with an excess of DMAP (up to 1:10) [10] while [Os(bpy)2(CO)Cl]+PF6– (2) was prepared as previously reported [11].
2.2 Crystal structure determination
Single crystal diffraction data were collected at RT on a Bruker SMART CCD area detector diffractometer, using graphite monochromatized Mo Kα (λ = 0.71073 Å) radiation. Absorption correction was performed using SADABS [12]. The structure was solved by direct methods [13] and refined by full-matrix least-squares [14]. All the hydrogen atoms were located in the electron density map, and then refined with geometric constraints. The disordered Cl and CO ligands were treated as three independent atoms with 0.5 population, while constraining the C=O distance to 1.210 Å. The superposing SO3 and CF3 moieties were treated as one site with equal population of S and C and three sites with equal population of O and F.
The Crystallographic Information File (CIF) has been deposited by the Cambridge Crystallographic Data Center, with deposition number CCDC 245454.
2.3 Computational details and graphical manipulations
Ab initio molecular orbital calculations were performed employing the DFT method based on Becke's [15] three parameter hybrid functional and Lee et al. [16] gradient-corrected correlation functional (B3LYP), using the 6-31G(d,p) basis sets [17], as implemented in the Jaguar software [18]. Graphical manipulations and conformational searches were performed employing the XP [19], MOLDRAW [20] and MAESTRO [21] softwares.
2.4 NMR spectroscopy
The NMR spectra were recorded in deuterated dichloromethane on a JEOL EX 400 (B0 = 9.4 T, 1H operating frequency: 399.78 MHz). Chemical shifts were internally referenced relative to the residual protons in the employed deuterated solvents.
2.4.1 [Os(bpy)2(CO)Cl]+Otf–
1H spectrum in CD2Cl2 (ppm): 9.82 (d, 1H), 9.35 (d, 1H), 8.57 (d, 1H), 8.43 (d, 1H), 8.39 (d, 1H), 8.36 (d, 1H), 8.29 (t, 1H), 8.03 (m, 3H), 7.90 (d, 1H), 7.80 (t, 1H), 7.64 (t, 1H), 7.41 (t, 1H), 7.30 (t, 1H), 7.22 (d, 1H).
2.4.2 [Os(bpy)2(CO)Cl]+PF6–
1H spectrum in CD2Cl2 (ppm): 9.84 (d, 1H), 9.35 (d, 1H), 8.44 (d, 1H), 8.37 (d, 1H), 8.32 (d, 2H), 8.28 (t, 1H), 8.04 (t, 1H), 8.00 (t, 1H), 7.99 (t, 1H), 7.90 (d, 1H), 7.81 (t, 1H), 7.64 (t, 1H), 7.41 (t, 1H), 7.29 (t, 1H), 7.20 (d, 1H) (data from [9]).
3 Results and discussion
3.1 The crystal structure of compound 1
The X-ray structure of compound 1 was solved by single crystal X-ray diffraction analysis (Figs. 1 and 2). Crystallographic data and details of data collection and refinement are given in Table 1 1. The crystal structure of 1 is characterized by a static disorder of the Cl– and CO groups, since, as already observed for the related compound 2 [9], the Os atom sits on a twofold axis and the two symmetry related ligand moieties with 1/2 occupancy superpose (Fig. 1a). Therefore, the asymmetric unit, shown in Fig. 1a, contains half molecule 1, while Fig. 1b shows one of the possible reconstructions of the complete complex. The two crystal structures of 1 and 2 belong to the same space group and their crystal packing features are almost identical. The presence in 1 of the Otf– ion instead of PF6– in 2 causes only small changes in the lattice parameters (see Table 1, where in parentheses relevant crystal data of compound 2 from [9] are reported), with just a little increase in the cell volume, due to the different shape of the two anions. In both structures the anions sit on an inversion center, but, while the centrosymmetric PF6– anion is ordered in 2, the non-centrosymmetric Otf– anion in 1 must be disordered with a perfect 0.5:0.5 ratio between the two CF3 and SO3 moieties. It is worth noting that among the Otf– containing structures retrieved from the CSD [22] a large number is characterized by disorder of different nature, suggesting that the entropy gain from the disorder competes with the energy cost of the mutual rearrangement of the two moieties.
3.2 The theoretical calculations
We tried to analyze the geometric and energetic features of the disorder found in the crystal structure of 1 by molecular orbital calculations on the cluster models formed by the pair of ionic moieties (Fig. 3).

The four possible dispositions of the Cl– and CO moieties in the Os cation and of the Otf– anion as derived from the interpretation of the disorder in the crystal structure of 1.
The disorder of the crystal structure of 1 can be interpreted in terms of the four different mutual orientations of the Otf– anion and of the Cl and CO ligands in the Os complex, depicted in Fig. 3. Since both moieties in 1 sit on a crystallographic symmetry element (Otf– on an inversion center and the Os-cation on a twofold rotation axis) the different disordered positions have 0.5:0.5 occupation in the crystal structure. Therefore the four orientations in Fig. 3 must be energetically equivalent in a periodic model. Some theoretical calculations were carried out to understand if the four orientations are equivalent also in a short-range model, i.e. taking into account only a couple of molecules in cluster calculations, using the models depicted in Fig. 3. The geometry optimizations were carried out at first constraining the two moieties to retain the mutual position and orientation observed in the crystal structure (Constr-OPT) and then without any constraints (Full-OPT). The relative stability of the four Full-OPT (see Table 2) structures is rather different from that of the Constr-OPT ones, confirming that the crystal packing forces play a major role in determining the geometric and energetic features of the Otf–Os ion pair, as expected in a crystal structure dominated by ionic interactions. The constrained geometry optimizations suggest that the four orientations have different energies (see Table 2), indicating that, from a local point of view, the presence of four different orientations (Fig. 3) with equal population is not the more stable situation and the periodicity and the crystal packing, together with the entropy gain, must be invoked to explain the observed disorder, which allows the crystal structure to assume a higher symmetry. The graphical inspection of the four models M1 ÷ M4 after the full geometry optimization indicated that the relative orientations of the Otf– group and the Os cation are rather different with respect to those obtained from the constrained geometry optimization. This suggests that in solution the Otf–Os ion pair may assume a variety of mutual orientations in which the C–H·····X (X = F, O) interactions are strengthened. An analysis of these interactions shows that in the four Full-OPT structures the H·····O distances can become as short as 2.15 Å (in the most stable M4 disposition) and are shorter then the H·····F distances, as expected in view of the high proton affinity of the SO3 group in the triflate anion. The corresponding H·····F distances in the crystal structure of 2 are much longer (2.58 ÷ 2.93 Å), while, because of the disorder, the H·····X (X = F, O) distances in the crystal structure of 1Have intermediate values ranging from 2.39 to 2.78 Å.
Energetic features and shortest C–H····X contacts (with X = F, O) of the models of complex 1 shown in Fig. 3, after geometry optimization with (Constr-OPT) and without (Full-OPT) constraints on the mutual position and orientation of Otf– and of the Os cation
| Model | ΔE with respect to M1 (kJ mol–1) | Short C–H····X (X = O, F) contacts (H····X distance) | ||||
| Const-OPT | Full-OPT | Const-OPT | Full-OPT | |||
| Contact | Distance (Å) | Contact | Distance (Å) | |||
| M1 | 0.0 | 0.0 | C2–H····O1 | 2.68 | C3–H····O2 | 2.25 |
| C3–H····O2 | 2.72 | C2–H····O1 | 2.45 | |||
| C2–H····F3 | 2.88 | C8–H····F2 | 2.55 | |||
| C5–H····F2 | 2.97 | |||||
| M2 | 6.6 | 16.8 | C2–H····O3 | 2.88 | C2–H····O3 | 2.42 |
| C2–H····F1 | 2.68 | C11–H····O3 | 2.42 | |||
| C3–H····F2 | 2.72 | C3–H····O2 | 2.43 | |||
| C2–H····O2 | 2.51 | |||||
| C11–H····F1 | 2.40 | |||||
| C10–H····F2 | 2.45 | |||||
| M3 | 9.2 | –4.5 | C2–H····O1 | 2.68 | C3–H····O2 | 2.13 |
| C3–H····O2 | 2.72 | C2–H····O1 | 2.34 | |||
| C2–H····F3 (As M1) | 2.88 (As M1) | C5–H····F2 | 2.56 | |||
| M4 | 32.6 | –12.6 | C2–H····O3 | 2.88 | C2–H····O3 | 2.15 |
| C2–H····F1 | 2.68 | C5–H····O2 | 2.15 | |||
| C3–H····F2 (As M2) | 2.72 (As M2) | C8–H····O2 | 2.28 | |||
| C3–H····F2 | 2.83 |
3.3 The NMR data
Comparing the 1H NMR spectrum of [Os(bpy)2(CO)Cl]+Otf– (1) and [Os(bpy)2(CO)Cl]+PF6– (2) in CD2Cl2 a clear effect of the counterion nature can be detected. In fact, as depicted in Fig. 4, the signal pattern of 1 and 2 in the spectral range between 8.32 and 8.57 ppm is different. In the previously reported study [9] on [Os(bpy)2(CO)Cl]+PF6– the signals in this region of the spectrum were assigned to the bpy protons bonded to C5 and C8 (see Fig. 1a). This behavior is in agreement with the shorter C–H····O contacts with respect to the C–H····F contacts indicated by the Full-OPT theoretical calculations on the model clusters of 1 (see previous section), but one must take in account that in several cases ion pair structures may be different in solution and in the solid state. An interesting example is represented by the iridium complexes of formula [Ir(bpy)H2(PRPh2)2]+A– (A– = PF6–, BF4–, CF3SO3–, BPh4–, R = Me, Ph), investigated by Macchioni et al. [23], where it was possible, by NOE measurements, to demonstrate significant differences in the counteranion position between solution and solid state structures. Of course, charge delocalization on the bpy ligand and solvent effects may also be invoked. In effect the strength of the ion pair is also regulated by the choice of the solvent, and solvents of low dielectric constant (such as CH2Cl2) will favor the formation of more intimate ion pairs [24].

1H NMR spectrum in CD2Cl2 of [Os(bpy)2(CO)Cl]+Otf– (1) and [Os(bpy)2(CO)Cl]+PF6– from [9] (2).
4 Conclusions
The crystal structure of compound 1, together with the NMR data and the theoretical calculations allowed a geometric and energetic characterization of the Otf–Os ion pair in the solid state and in solution. The comparison between compounds 1 and 2, differing only for the anion (Otf– in 1 vs. PF6– in 2) was also investigated.
The anion effect is negligible in the solid state and the two complexes are isostructural. The presence in 1 of the Otf– ion instead of PF6– causes only a little increase in the cell volume, due to the different shape of the two anions, and the space group C2/c remains the same for both crystals. Besides in both complexes 1 and 2 the Os atom sits on a twofold axis and the -CO and –Cl moieties are disordered with a 0.5:0.5 ratio, while the two anions sit on an inversion center. The main difference is the necessary disorder in the Otf– anion in 1. Indeed, contrary to PF6–, the Otf– moiety is non-centrosymmetric and only by being disordered can sit on an inversion center. Theoretical molecular orbital calculations, with the cluster approach, confirmed that the crystal packing forces play a major role in the geometric and energetic features of the Otf–Os ion pair and suggested that the relative orientations have different stability and may substantially change passing from the solid to the solution state. Nevertheless the four orientations in Fig. 3 must be energetically equivalent in a periodic model, as already observed by some of us in crystal structures containing disordered fluorine [25]. To verify these conclusions we intend to carry out some periodic ab initio calculations. The NMR data indicated that the anion (Otf– in 1 vs. PF6– in 2) can influence the C5 and C8 bpy proton chemical shifts, probably because of the different C–H·····X (X = F, O) interactions observed in the M1 ÷ M4 models after full geometry optimization. It is worth noting that the solvent effect, not taken into account in the theoretical calculations, should also play an important role, as suggested by the NMR data in the literature. The 1D- and 2D-NOE methodologies [26] may be employed to investigate in detail ion pair contacts, which can play a role in the reactivity of the complexes and in their catalytic activity [27–29].
1 Supplementary information (atomic coordinates also of H atoms, anisotropic displacement parameters for non-H stoms, bond distances and angles) has been deposited by the Cambridge Crystallographic Data Centre, with deposition numbers CCDC-245454.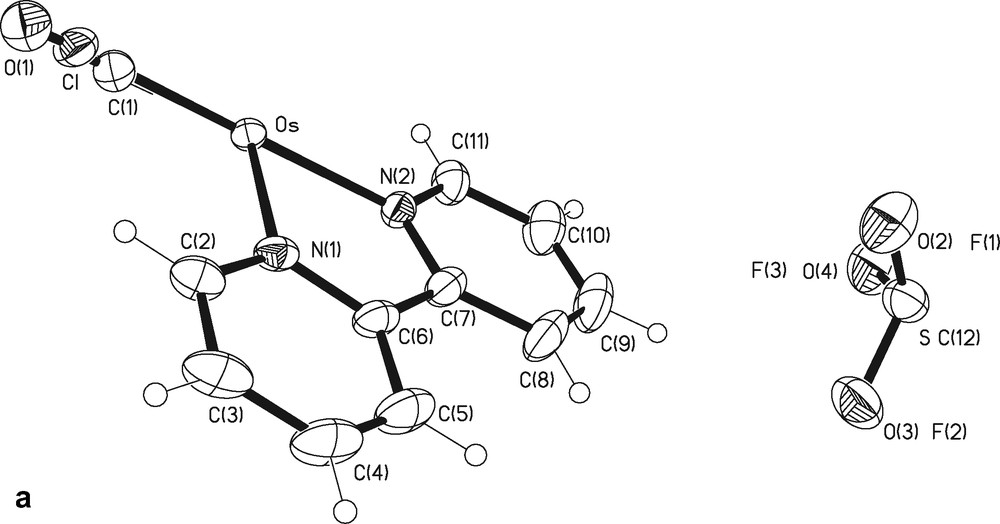


| Compound | 1 [2] |
| Empirical formula |
|
| Formula weight | 715.10 |
| Temperature | 293(2) K |
| Wavelength | 0.71069 Å |
| Crystal system | C2/c [C2/c] |
| Space group | Monoclinic [monoclinic] |
| Unit cell dimensions (Å and °) | a = 15.09(1) [15.518(3)] |
| b = 14.30(2) [13.419(3)] | |
| c = 12.52(1) [12.663(3)] | |
| β = 110.10(5) [111.07(3)] | |
| Volume (A3) | 2535(2) [2460.6(9)] |
| Z | 4 |
| Density (calculated) | 1.874 Mg m–3 [1.919 Mg m–3] |
| Absorption coefficient | 5.28 [5.42] mm−1 |
| F(000) | 1376 |
| Crystal size | 0.28 × 0.03 × 0.02 mm3 |
| Theta range for data collection | 5.10–23.25°. |
| Index ranges | –16 ⩽ h ⩽ 16 |
| –15 ⩽ k ⩽ 15 | |
| –13 ⩽ l ⩽ 13 | |
| Reflections collected | 14277 |
| Independent reflections | 1708 [R(int) = 0.0293] |
| Completeness to theta = 23.25° | 93.6% |
| Refinement method | Full-matrix least-squares on F2 |
| Data/restraints/parameters | 1708/1/167 |
| Goodness-of-fit on F2 | 1.148 |
| Final R indices [I > 2sigma(I)] | R1 = 0.0276, wR2 = 0.0633 |
| R indices (all data) | R1 = 0.0295, wR2 = 0.0641 |
| Largest differences in peak and hole | 0.934 and –1.424 e Å−3 |