

1 Introduction
Nitrogen is the fourth most abundant element in living organisms, and its metabolism plays a fundamental role in every cell. Most nitrogen taken up by man and higher animals through their food is in organic forms that have originally been formed in plants. Plants have the ability to use part of their photosynthetic energy to reduce soil inorganic nitrogen, mostly nitrate or ammonium, to organic forms, especially amino acids. So, primary nitrogen metabolism in plants from nitrate to different amino acids is subject of considerable interest.
Many studies on nitrogen metabolism are carried out by stable isotope feeding experiments with 15N, especially since no widely usable radioactive isotope exists. The resulting samples, mostly cell extracts, are often analysed and quantified by mass spectroscopy techniques, but NMR has an important role to play, too [1]. 15N NMR spectroscopy [2], however, is hampered by a relatively low sensitivity due a gyromagnetic factor γ(15N) = –2.7112 × 10⁻⁷ Hz T−1 compared to γ(1H) = 26.752 × 10⁻⁷ Hz T−1. Sensitivity can be improved by the resulting large maximal nuclear Overhauser enhancement (nOe) factor ηmax = –4.93, but its negative value can also lead to signal cancellation if η is not maximal. In many situations, longitudinal relaxation times T1 are long, too, and the signal-to-noise ratio S/N can then be improved from rapid pulsing not waiting for complete relaxation. However, for quantification, T1 and η have to be known or their effect must be avoided, often at the expense of a lower S/N. For many metabolites of interest, this task is complicated by the presence of exchangeable protons on the nitrogen which make the relaxation properties highly pH dependent either because of exchange-modulated scalar 1H–15N couplings, as proposed by [3] and dismissed by [4], or because of changes in 1H–15N dipolar interaction [4]. A subsequent study suggested that these pH-dependent effects were mainly due to interaction with paramagnetic ions [5]. However, paramagnetic ions cannot be removed to the required level when preparing cell extracts, and therefore, independently of their origin, pH dependent relaxation effects have to be taken into account when analysing cell extracts by 15N NMR. This study, therefore, examines the effects of physico-chemical conditions (pH, ionic charge, viscosity) on relaxation and spectral properties of some commonly encountered 15N signals in cell extracts, namely nitrate, ammonium, urea, glutamate, alanine and glycine.
The present work has been carried out within studies trying to elucidate regulatory aspects of nitrate reductase in rapeseed (Brassica napus L.) seedlings [6]. The method mostly involves in vivo 15N NMR to follow the assimilation of either K15NO3 or 15NH4Cl, but the relative timecourses obtained from in vivo spectroscopy have to be quantified from extracts, and supplementary feeding experiments without the constraints of in vivo NMR (e.g., absence of light, densely packed excised tissue, etc.) are also performed creating a need for reliable quantitative analysis of 15N in cell extracts. Though the context of this work is on primary nitrogen metabolism in plants, most of its conclusions are valid for the study of any cell extract independently of the biological source material.
2 Material and methods
To avoid the long acquisition times, often 10–20 h, necessary for getting a sufficient signal-to-noise ratio from extracts of 15N-labelled plant tissues, we rather used an unlabelled perchloric acid extract prepared from 0.79 g of excised rapeseed seedling shoots, and spiked it with K15NO3, 15NH4Cl, [15N2]-urea, [15N]-glutamate, [15N]-alanine and [15N]-glycine at 200 mM each in a final volume of 1.5 ml. For comparison, a standard solution was made from the same labelled compounds in distilled water. The pH of the samples was adjusted with 12.5 M NaOH or 10 M HCl to minimise the resulting dilution. For investigating the effects of ionic charge, increasing amounts of NaCl were added to the standard solution.
15N NMR spectra were recorded at 30.42 MHz on a Bruker Avance 300 WB spectrometer using an 8-mm direct detection broad-band (BBO) probehead. Reference spectra were acquired with a 90° pulse, a relatively short interpulse delay of 4.0 s, power-gated WALTZ16 1H broadband decoupling and 2048 scans. For determining the nOe factor η, a power-gated (pg) and an inverse-gated (ig) spectrum were recorded with a 90° excitation pulse, an interpulse delay of 16.0 s and 1024 scans each. From the integrals, η = Ipg/Iig – 1 was calculated. T1 measurements were carried out with a fast inversion–recovery sequence [7] using a 10-s interpulse delay D between the 90° detection pulse and the next scan's 90°x240°y90°x composite inversion pulse [8], and 13 recovery delays τ (0.01, 0.2, 0.4, 0.7, 1.1, 1.6, 2.4, 3.6, 5.6, 9.0, 14.0, 22.0 and 35.0 s). Low-power 1H decoupling was maintained throughout, and 80 scans were acquired per increment. T1 was determined by curve-fitting the peak integrals I obtained to I(τ) = I0 (1 – (1 + α (1 – exp(–D/T1))) exp(–τ/T1)). The parameter α takes into account imperfect inversion due to offset and inhomogeneity effects.
3 Results
Fig. 1 shows a series of spectra from the spiked extract with increasing pH taken with power-gated broadband decoupling to get the nOe and with a relatively short interpulse delay that does not allow for complete relaxation thus highlighting differences in T1. The first point to note is that the spectra at acid pH contain all six expected peaks, whereas the amino and ammonium resonances broaden at more alkaline pH leading to their disappearance. This can be attributed to base catalysed proton exchange and suggests that any useful NMR analysis has to be done at acid pH values. Strong variations in signal intensity and even peak inversions can also be seen. These are the combined effect of variations in the nOe factor η and the relaxation time T1.
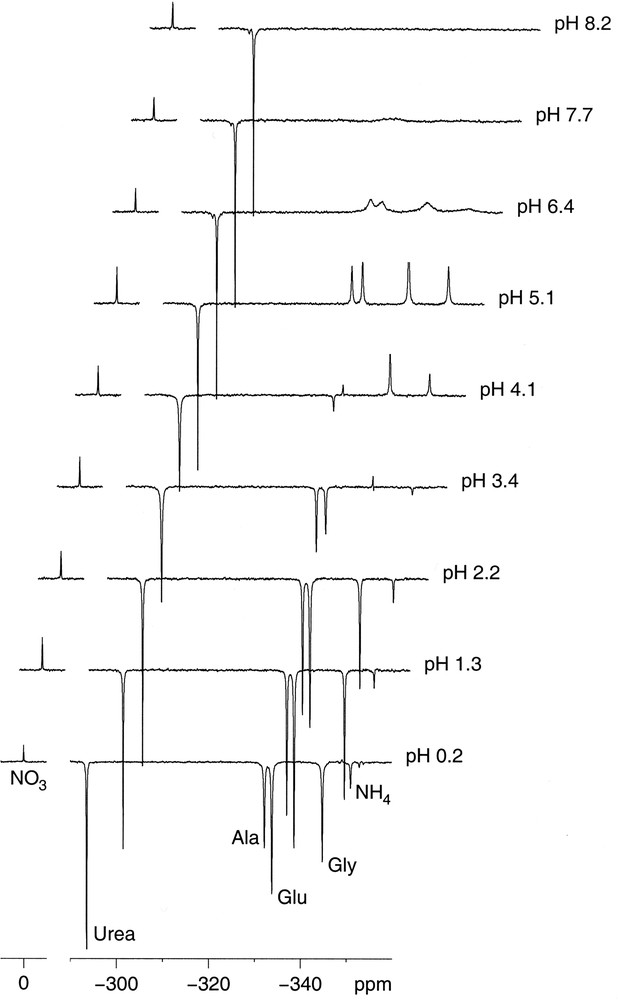
15N NMR spectra of a spiked rapeseed seedling shoot extract at different pH values. NMR conditions: ν = 30.42 MHz, power-gated 1H decoupling, 90° pulse, 4.0 s interpulse delay, 2048 scans.
A back-titration from pH 8 down (data not shown) showed that the recovery of narrow signals occurred at lower pH than the broadening did. The main difference between the forward and back-titration is the amount of NaCl created by the subsequent addition of NaOH and HCl. We, therefore, recorded a series of spectra with the standard solution at pH 7 and increasing NaCl concentration (Fig. 2). Without NaCl, the peaks were still reasonably narrow but on addition of NaCl the peaks rapidly broadened in much the same fashion as when increasing the pH.
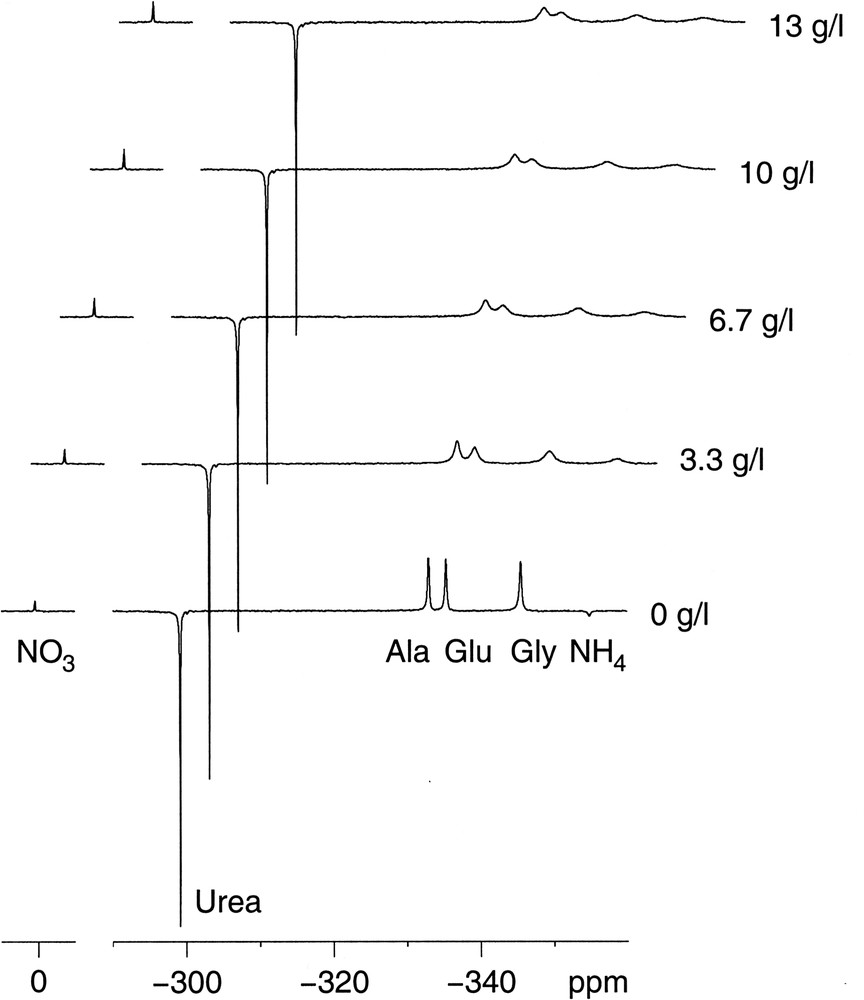
15N NMR spectra of a model solution with increasing amounts of NaCl. NMR conditions as in Fig. 1.
Fig. 3 shows the changes in the nOe factor η versus pH that were qualitatively apparent from Fig. 1. Values for amino acids and ammonium at pH 7 and 8 could not reasonably be extracted given the peak broadening. These compounds change peak sign between pH 3 and 5, corresponding to η comprised between –1 and 0. An increase in absolute intensity, i.e. η < –2, is only obtained at pH < 2. Nitrate has nearly no nOe, which was expected given that the molecule contains no hydrogen, and urea is the only compound tested with a gain in absolute signal throughout. Its η decreases with pH though it does not reach the theoretical maximum (numerically a minimum) ηmax = –4.93.
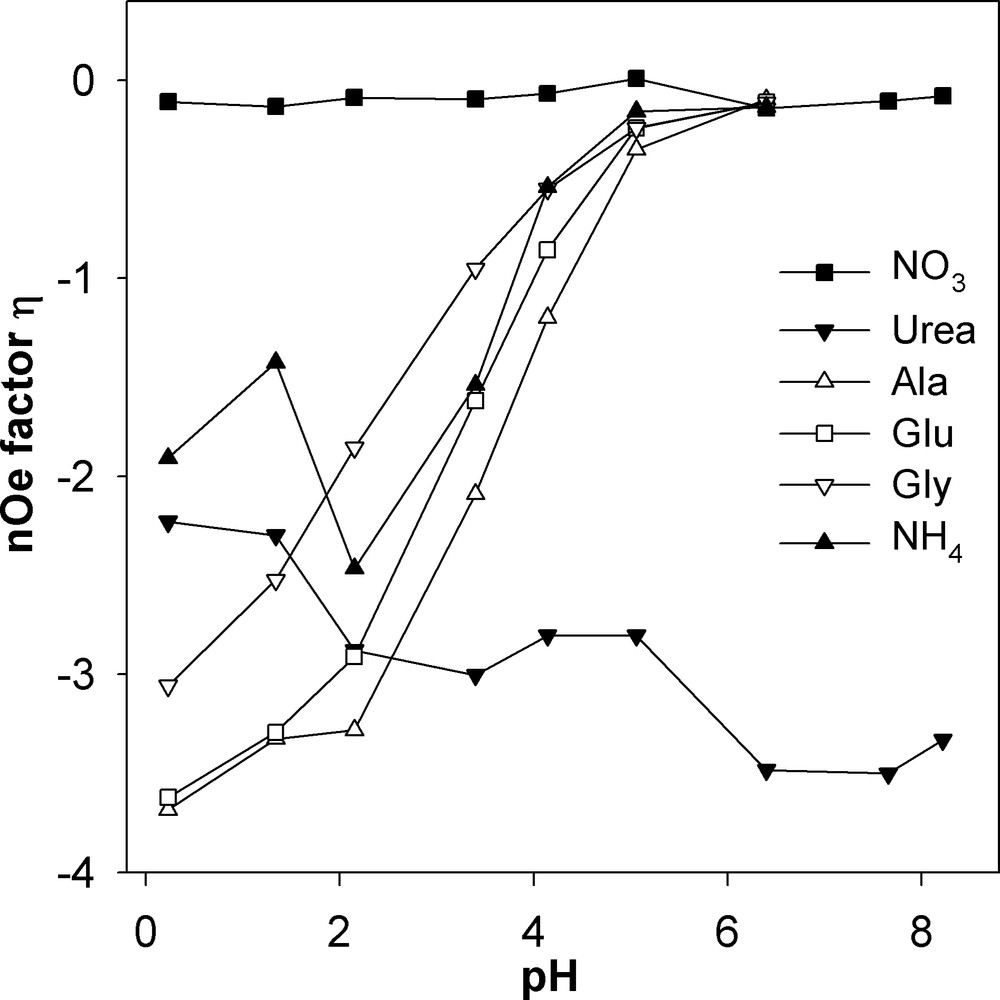
The pH dependency of the nOe factor η = Ipg/Iig – 1.
T1 values for ammonium (Fig. 4A) and the amino acids (Fig. 4B) decrease with increasing pH attaining surprisingly low values when the line broadening sets in. The concomitant loss in nOe suggests that the relaxation mechanism that becomes efficient with increasing pH is another than dipolar relaxation by the attached 1H. The relaxation mechanism in question could either be exchange modulation of the scalar coupling [3] as base catalysed proton exchange increases with pH or for the amino acids enhanced interaction of paramagnetic ions (e.g., Cu2+, Mn2+) [5] with the prevalent zwitterionic form at pH above the pKs which are around 2.3, 2.2 and 2.3 for Ala, Glu and Gly, respectively. The pH dependence of the T1 of urea (Fig. 4A) is the contrary of the amino groups, like its nOe, meaning that a non-dipolar mechanism becomes less efficient with increasing pH. It should be noted that urea does not change its protonation state in the pH range considered. The T1 of nitrate (Fig. 4A) is as expected the longest with the absence of a directly attached 1H. More surprising is that it shows some pH dependency nearly doubling at pH 4 compared to acid and neutral pH. However, it should be noted that the measurements carry relatively large error bars since the longest recovery delay was 35 s, slightly shorter than the maximum T1 itself, and that a big change in T1 does not seem to be supported by the rapid pulsing spectra in Fig. 1.
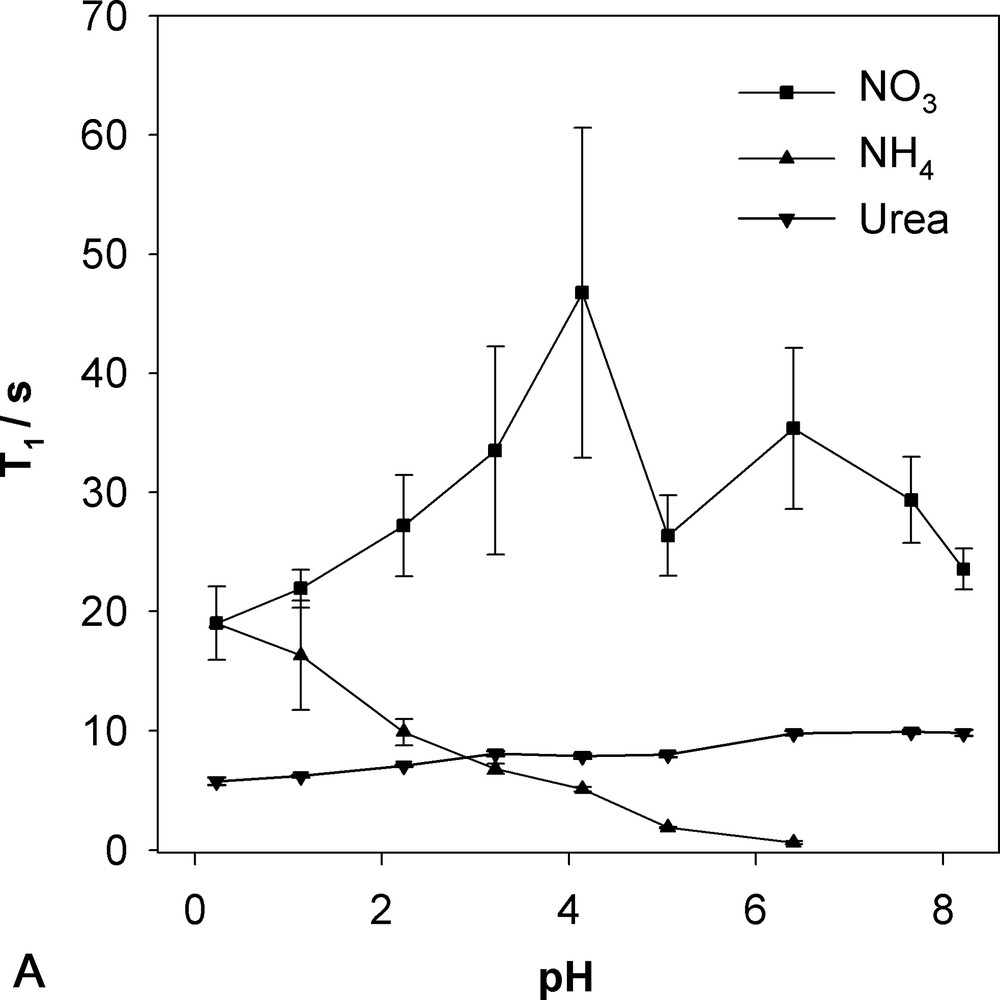
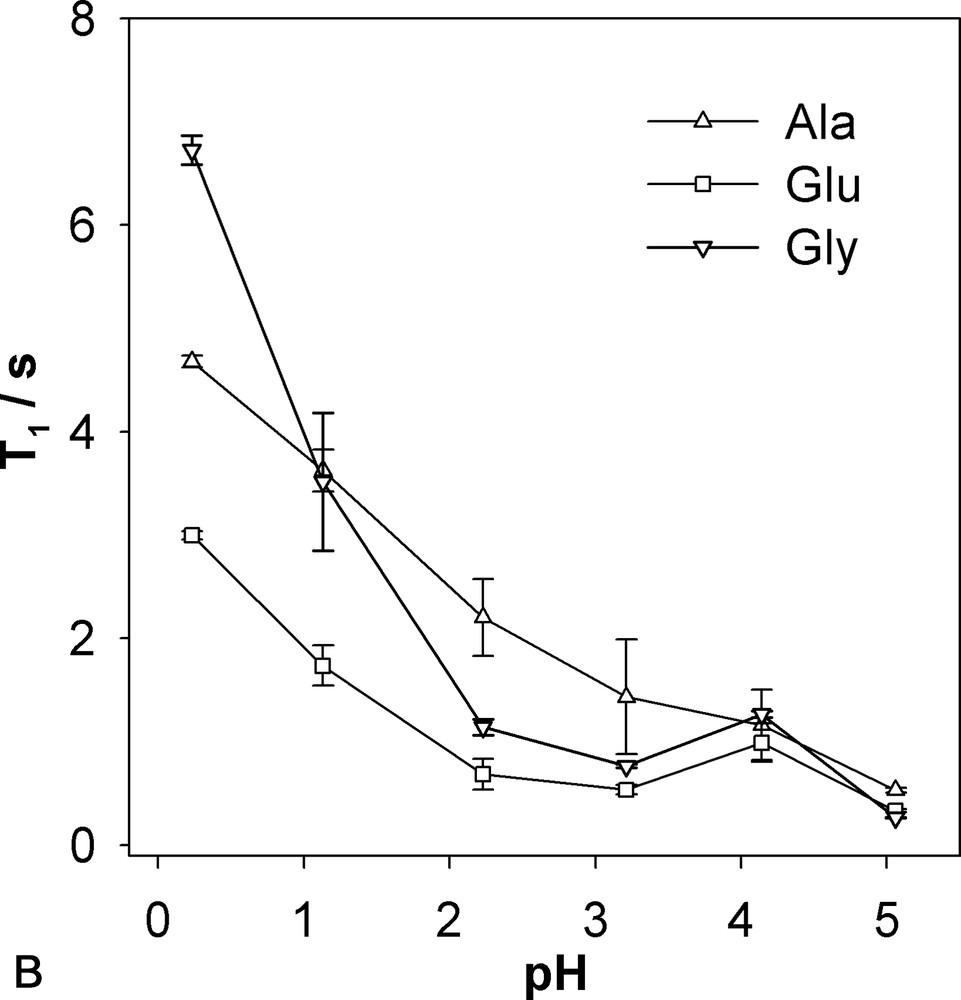
The pH dependency of longitudinal relaxation time T1 determined by fast inversion–recovery. Error bars correspond to the curve-fitting error. A: Nitrate, ammonium, urea; B: alanine, glutamate, glycine.
Finally we compared the T1 values for nitrate and urea at pH 7 between the spiked cell extract (T1(NO3) = 29.4 ± 3.6 s and T1(urea) = 9.9 ± 0.2 s) with those obtained with the standard solution after addition of 13.3 g l–1 of NaCl (T1(NO3) = 64 ± 11 s and T1(urea) = 17.1 ± 0.4 s). The approximate doubling of relaxation times suggests another role of the sample matrix. Possibly the much higher viscosity of the cell extract leads to slower molecular movements which would favour relaxation when ω τc < 1 which is certainly the case for the small molecules and the low NMR frequency under consideration.
4 Discussion
Relaxation measurements of 15N in small biomolecules found some interest in the early days of 15N NMR [2] and have then only reappeared occasionally to help interpret in vivo NMR spectra [9–11]. Though the different physico-chemical conditions preclude a quantitative comparison of absolute values (and incidentally, η beyond ηmax have been reported by Scharff et al. [11]), the tendency in pH dependence can be compared. For the amino groups, the stronger nOe for more acid pH values is confirmed, but for ammonium we found a similar behaviour whereas Scharff et al. [11]) found a rather stable value. The difference could be explained by earlier observations [10] that the nOe for ammonium changes drastically between a neat solution and solution containing cell debris. In the extracts, an intermediate situation is found since large cell debris is eliminated by centrifugation but all soluble cell constituents are retained. The strong dependence of nOe effects on difficult-to-control parameters in extracts like ionic charge, viscosity, cell constituents thus suggests that quantitative 15N analysis should only be performed without nOe, and our results indicate that in many situations η > –2 thus rather reducing signals than enhancing them.
Still, conditions have to be chosen with respect to T1. Here the pH zone around pH 3–4 looks the most promising with peaks that are still reasonably narrow and rather short T1s under 2 s for the amino resonances. This would allow to obtain fully relaxed spectra in reasonable experimental time and thus be quantitative. Under such conditions, other signals like nitrate or urea would not be sufficiently relaxed, and for quantification it is necessary to record a second spectrum with a longer interpulse delay. Since 15N-nitrate occurs essentially in nitrate-incubated samples, and there in rather high concentrations, this second spectrum could be recorded with less scans.
Thus the quantitative analysis of cell extracts by 15N NMR seems feasible when experimental conditions are carefully chosen. Nevertheless an alternative avoiding many of these problems might be found by using 1H NMR for indirect detection of 15N as has been demonstrated on rice coleoptile extracts [12] though quantification is not easy as transfer efficiencies have to be evaluated and again problems due to proton exchange have to be avoided by selecting an appropriate pH where the exchange rates are much lower than the scalar couplings.
Acknowledgements
N.H. wishes to thank the GERM committee for a grant towards her participation at the 19th annual GERM meeting, as well as the Algerian ‘Ministère de l'Éducation nationale’ for a Ph.D. studentship.