

1 Introduction
Reactive processing covers many areas of polymer technology, ranging from the modification of the interface in polymer blends to the autoclave processing of aerospace composite materials. The common feature is chemical change as a thermoplastic or thermosetting polymer is heated in the presence of a co-reactant, resulting in a continuous change in the viscosity of the system either due to the formation of a network or the functionalisation or controlled degradation of the polymer [1,2]. For example, on processing of thermoplastics at an elevated temperature in an oxidizing environment, processing antioxidants may be exhausted, so that ether, alcohol, ketone and acid groups are formed on chain scission. In the presence of monomer there may be grafting and/or functionalisation often initiated by an organic peroxide.
In reactive extrusion (REX) the measurement of the concentration profiles of these reactants as a function of time and position in the extruder is crucial for linking the chemical and rheological changes of the polymer during processing. In this way a high level of control of the process and reproducibility of the product is possible. In REX and other reactive processing, polymerisation is occurring either in the barrel of the extruder; or in a mould (compression moulding; Reaction Injection Moulding—RIM), in an autoclave (fibre reinforced composite curing from prepreg) or in the part itself (REX free forming) so that measurement of the chemorheological changes by conventional techniques is impossible. To follow the chemical changes, spectral methods with fibre-optic probes have been researched to yield the kinetics of the reactions in real-time. In the monitoring of reactive processing a distinction is drawn between on-line monitoring, in which the process stream may be diverted into an analytical region, and in-line monitoring, in which the probes are placed in the reaction stream. In the latter case, the probes have to tolerate the high temperatures and pressures during processing while in on-line monitoring the sample of the process stream may be analysed under conditions more conducive to quantitative spectroscopy and may even be removed for more detailed inspection. This is no longer real-time monitoring and obviously cannot be used for any feedback process.
A particular reactive process that has been researched in many laboratories is the free forming of epoxy resins [3]. This is illustrated in Fig. 1 and it is based on a moving heated sample stage above which is suspended a syringe pump that delivers the pre-mixed epoxy resin with the formulation shown. The solvent and a silica thixotrope are chosen to achieve the appropriate initial viscosity and the air pressure is varied through the computer interface to control the flow of the uncured resin/hardener mix. This gives extreme flexibility in the formation of a prototype and is analogous to stereolithography as used in the prototyping of components for regenerative surgery, for example. Of importance in this application is the determination of the extent of reaction (i.e. Chemical conversion such as consumption of epoxide or amine) in the component during cure.

Schematic of system for the reactive free-forming of epoxy resins (after Calvert et al. [3]).
The usual approach is to develop a spectroscopic analytical method in the laboratory and then assess the possibility of transferring this to the processing environment by using fibre optics or other energy transfer system with the lowest energy loss at the spectral frequency. In the following, some examples of using Near Infrared (NIR) transmission spectroscopy and Mid-IR (MIR) spectroscopy in absorption and emission modes, will be discussed. Raman spectroscopy is another vibrational spectroscopic tool that provides complementary information, but is not considered here. As the technique is affected by the technology available for remote monitoring, this will be considered first and then the particular issues surrounding the spectral region will be considered when applications are considered.
2 Remote spectroscopy
The spectroscopic techniques used in reaction monitoring have all been developed for application in an analytical laboratory and traditionally require polymer samples to be taken to the spectrometer. Vibrational spectroscopy, in both absorption and emission, lends itself to remote sampling by coupling with fibre-optics. The use of remote sensors for process control has been researched for the past 30 years and the reduced cost of low-loss fibre-optic cable has provided an impetus for research in this area [4,5]. The fundamental requirement of all radiation transfer techniques in remote spectroscopy is that the radiation be transferred from the spectrometer to the sample, probe the reactions or transformations of interest and then return the modified beam of radiation to the spectrometer for the measurement of intensity at each wavelength in the spectral region of interest; all without any contributions from the transfer medium and with little loss in energy. While fibre-optic probes meet these requirements under favourable circumstances, there are a number potential artefacts and limitations which may be understood from the principles of operation.
2.1 Fibre optics
The key principle in the operation of fibre-optics is total internal reflection between media of refractive indices n1 and n2. Thus if the light is launched into a fibre at angles less than sin−1(n2/n1), then there is propagation along the length of the fibre and the attenuation of the energy depends on:
- ● the intrinsic absorption properties of the fibre material at the wavelength, λ, of the radiation;
- ● the numerical aperture (NA) of the fibre. The NA depends on the materials of construction of the fibre and the larger the difference between the refractive indices of the cladding and the fibre core, the greater the range of angles for rays which may propagate along the fibre. This is relevant for matching the NA of spectroscopic and other optical components for analysis of the beam to optimise S/N;
- ● the absorption of the evanescent wave. The evanescent wave is the component of the totally internally reflected wave that penetrates into the lower refractive index medium (i.e. the cladding) for a distance which depends on the incident angle. For typical refractive indices of fibre core and sample of 2.5 and 1.5, respectively, and an angle of incidence of 60°, the depth of penetration of the evanescent wave is around 0.1λ. The result is that the spectrum of the cladding is also obtained;
- ● negative bands may arise due to a mismatch between the sample and reference pathlengths. Bending of the fibre may contribute, as this will change the angle at the interface and thus the penetration depth into the cladding. The effect of these spurious bands on quantitative fibre-optic spectroscopy can be severe (e.g. with epoxy resins) and significant interference of analytical bands for the monitoring of the reactive processing has been reported [6].
3 Remote NIR
There has been most attention paid to applications of absorption and reflection spectroscopy in the NIR region for industrial process control [7]. This arises from the robust nature of the optical components and the availability of commercial systems that are based on gratings as well as interferometers. Transmission and reflectance probes that are designed to interface with extruders, and in particular reactive extruders, are commercially available and their performance has been quantitatively assessed [8]. The limitation of performance in the NIR due to the materials of construction of the fibre has been noted [7] and the small residual –OH functionality in most commercial fibres will absorb energy and result in an upper spectral range of 2250 nm. It has been shown that a total optical fibre length of 2 km may be used with a transmission cell for the real-time analysis of a process stream in the 1–2 μm spectral range by using a pair of multimode silica fibres which have very low –OH absorption [9].
In low temperature and pressure application such as the free-forming REX, shown in Fig. 1, above, it is possible to just bathe the sample in NIR radiation (e.g., from a tungsten lamp) and use a single optical fibre embedded in the part on the platen to collect the spectra from the section of polymer lying between the fibre and the edge of the free-formed resin surface [3]. This should typically be from 2 to 5 mm, depending on the bands to be studied. This requires the collection of a spectrum of the lamp alone through the fibre as a reference. This embedded fibre may also be used for monitoring of the subsequent performance of the component for example in following the uptake of moisture by the resin using the characteristic absorption band at 5200 cm−1.
3.1 NIR analysis of reactive processing
Overtone and combination bands of many high energy molecular vibrations (e.g. stretching modes) will lie in the NIR region of the spectrum from 4000 to 14,000 cm−1. This is a region which is spectrally accessible by either FT-IR or grating spectrophotometers and has the added attraction of being a region where glass and quartz are transmitting and atmospheric interferences are minimal. The molar absorptivities of the overtones and fundamentals are lower by one to two orders of magnitude compared to the fundamental vibrations, so pathlengths of mm are typically used, again simplifying sample handling. Consequently, this spectral region has been the most heavily studied for process control, often involving the use of fibre-optics.
The majority of studies involving the use of NIR to monitor the polymerisation process have been focussed on monitoring the reactant profiles as a function of time [10] but there are many applications where NIR can detect changes in the polymer structure, moisture content or changes to reaction conditions which may affect the final product [11]. The use of the NIR for quantitative analysis is illustrated by the determination of the absolute rate constants for propagation and termination in the free radical polymerisation of cyclohexyl acrylate [12]. An obvious advantage of the NIR region is seen in enabling aqueous polymerisation systems to be analysed, such as the emulsion polymerisation of styrene [13]. One of the major limitations identified by them in NIR studies of an emulsion system was light scattering, which could be minimised by using second derivative spectra. In an extension of this, it has been shown that NIR can detect the onset of monomer droplet formation, which is important in avoiding thermal runaway or specification drift of the product [14].
Bulk polymerisation of methyl methacrylate within a mould was monitored by using a diode array spectrometer and a sampling design that allowed the light beam to traverse the sampling thickness twice and so minimise optical artefacts [15]. In polyurethane synthesis [16] it was shown that, from an understanding of the peak assignments for reactants and products and calibration against isocyanate standards, it was possible to monitor the reaction profile for both isocyanate consumption and polyurethane formation by using second derivative NIR spectra. This enabled process optimisation since the completion of the reaction occurred at a much shorter time than previously determined by intermittent analysis. The optimum time for the addition of a polyol chain extender was also determined.
Monitoring of the cure reactions of thermosets have been facilitated by the use of NIR spectroscopy as thicker samples (typically 1–5 mm) are analysed and are thus more representative of the bulk curing reactions. This is of particular importance in the use of NIR for monitoring the curing process during the free-form REX (Fig. 1) and also in the simple single fibre probe method shown in Fig. 2. The quantitative features of NIR spectral analysis were recognised with one of the earliest analyses of the epoxide and hydroxyl group content of a commercial DGEBA epoxy resin before and during cure [17]. The use of NIR for monitoring the reactive processing of high-temperature curing, high performance resins such as TGDDM (e.g. the Ciba resin MY721) cured with DDS, was first reported in an application which used fibre-optics to couple the sample to the spectrometer [6,18]. In Fig. 3 is shown a NIR spectrum for a sample of TGDDM (MY721) containing 27% DDS as used in the reactive free forming. The assignment of the bands in the spectrum to combination and overtone bands of the fundamental vibrations assigned to both TGDDM and DDS are marked and assigned in Table 1 for both the resin and amine.

Simple single fibre-optic method with non-collimated illumination for monitoring extent of cure during free-form extrusion (as shown in Fig. 1).

Changes in the NIR absorption spectrum of an MY721/DDS system as used in reactive free forming (Note that absorbance scale is arbitrary as spectra are offset). Courtesy of N. St. John.
NIR band assignments for TGDDM + DDS before reaction
| Wavenumber (cm−1) | Band assignment |
| 4519 | Epoxy combination(C–H stretch + ring breathing mode(s)) |
| 4557 | p-amine combination (N–H symmetric stretch + C–N stretch) |
| 4804 | p-amine combination(N–H symmetric stretch + deformation) |
| 5072 | p-amine combination (N–H asymmetric stretch + deformation) |
| 5645, 5774 | Methylene 1st overtones (C–H stretch) |
| 5887, 5987 | Aromatic 1st overtones (C–H stretch) |
| 5873, 6057 | Terminal epoxy 1st overtones (C–H stretch) |
| 6575 | p-amine 1st overtone (N–H symmetric stretch) |
| 6684 | p-amine 1st overtone (N–H asymmetric stretch) |
| 7000 | hydroxyl 1st overtone (O–H stretch) |
| 8627, 8837 | Terminal epoxy 2nd overtones (C–H stretch) |
| 9801 | p-amine 2nd overtone (N–H asymmetric stretch) |
| 10,191 | Hydroxyl 2nd overtone (O–H stretch) |
Compared to the MIR, there are many fewer bands in the NIR, they are broader and overlapping of bands is common. In some instances, Fourier Self Deconvolution is required in order to assign bands, but the original bands should be used where possible for quantitative analysis since Beer's Law is generally obeyed and quantitation is straightforward. The spectral changes that occur when the sample was heated at 160 °C for the cure reaction to occur are shown in Fig. 3. The bands that have become negative correspond to consumption of the amine and epoxide and it is the detailed analysis of these bands which permits a quantitative analysis of the cure kinetics which may then be applied to real-time monitoring of reactive processing. Scheme 1 shows the simple sequence of reactions that are expected to occur and these may be related to the spectral changes seen in Fig. 3 through Table 1. Thus the first reaction, primary amine addition to epoxide, results in the disappearance of the band at 5072 cm−1. This produces secondary amine that may subsequently react (but more slowly) with another mole of epoxide, to produce a tertiary amine. This results in the growth and disappearance of bands in the region of approximately 6500–7000 cm−1 that requires spectral deconvolution for precise analysis. The third possible reaction shown in Scheme 1, etherification, is competitive with the amine reactions but is more important at higher temperatures due to its higher activation energy. From an analysis of the NIR spectrum it is possible to obtain the instantaneous rate of these and other reactions as the network forms. This gives more comprehensive information than is possible by methods such as DSC, which give only the overall rate of reaction and cannot be adapted to real-time monitoring [19].
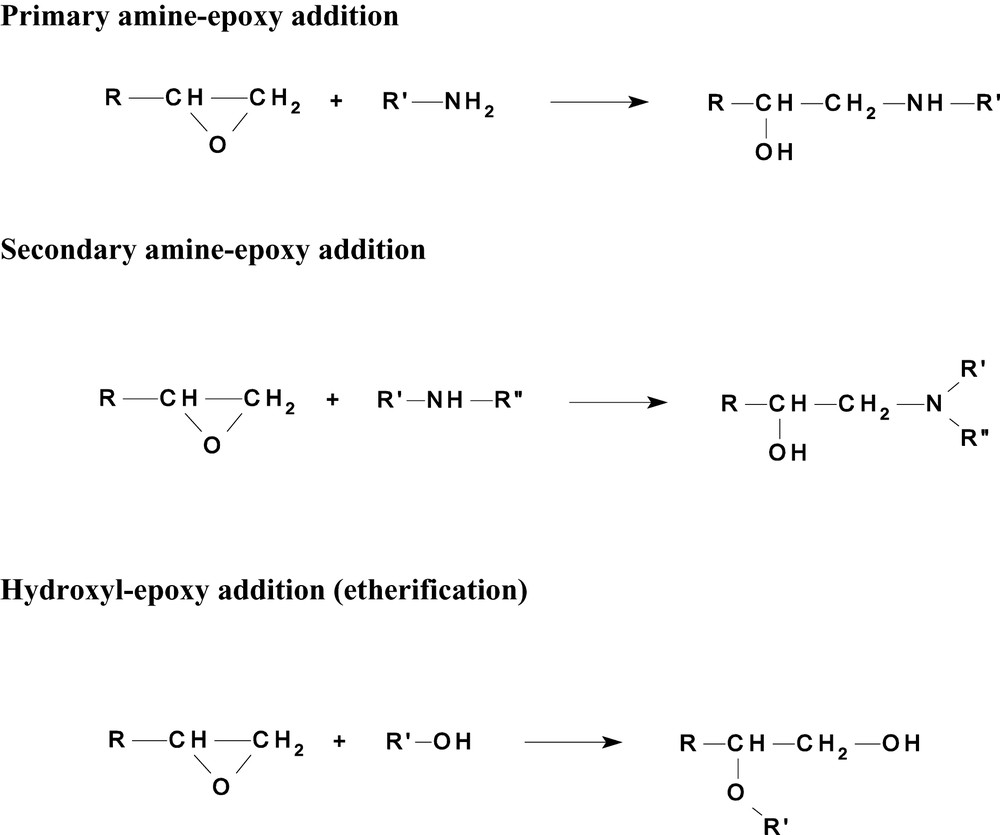
Reactions occurring during the curing of epoxy (e.g., TGDDM) with amine (e.g. DDS).
In an extension of this work to a more detailed analysis of the reaction kinetics of this and related systems using NIR spectroscopy [19], it has been shown that the secondary amine-epoxy reaction is sensitive to the rheology of the network and is thus potentially able to form a spectroscopic monitor of rheological changes. This reaction is subject to steric hindrance following the faster (unhindered) reaction of the primary amine with epoxide. The rationale for this may seen from Scheme 2, where it is recognised that the inter-molecular reaction is sensitive to the large scale motions in the system in contrast to the intra-molecular cyclisation reaction which is sensitive only to local motions. Thus it has been found that the rate constant for the intermolecular reaction decreases rapidly at gelation while that for the intramolecular reaction only decreases at vitrification. Measuring just the overall reaction (by DSC) or the primary amine-epoxy kinetics shows no effect of the development of the network until the glass transition. This opens up the possibility for the NIR to be used as a non-invasive real-time monitor of the rheological changes occurring in the resin during cure [19] provided the data analysis can unravel the kinetic data from the spectral information in a time comparable to the rate of cure.
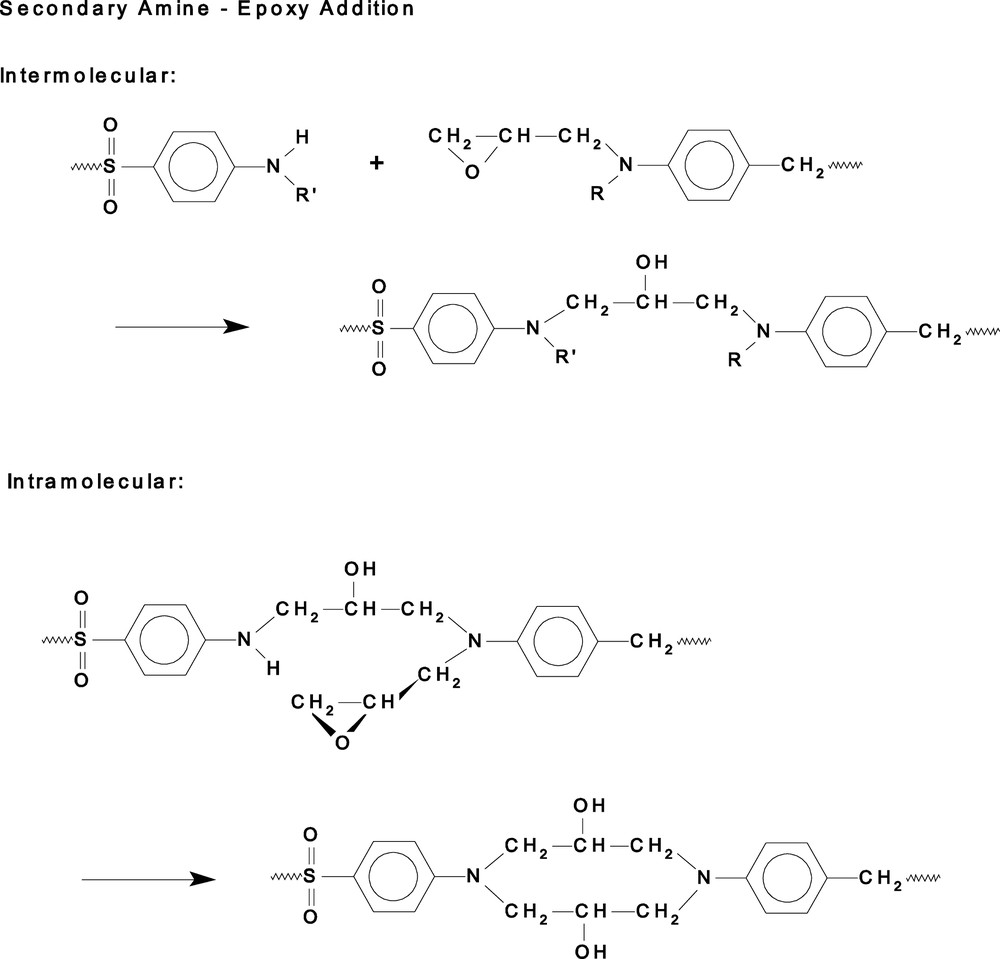
Detail of reaction of epoxide group in TGDDM with secondary amine from DDS. Note the difference between the reactions of secondary amine with epoxide on different molecules of TGDDM (intermolecular) and the same molecule of TGDDM (intramolecular) leading to cyclisation.
4 Remote MIR
Remote MIR spectroscopy is limited by the lack of inexpensive fibre-optics operating in the wavelength range where the fundamental vibrational modes of molecules participating in the chemorheological changes are observed. This has not prevented several fibre-optic systems being made available that are fabricated from chalcogenide glasses (e.g., arsenic germanium selenide) [20] and silver halide crystals [21]. Polycrystalline silver halide fibres of composition AgBr1–xClx with a refractive index of 2.2 have a much wider spectral range (4000–750 cm−1) than chalcogenide glasses and are available with optical losses of less than 0.1 dB m–1 at 1000 cm−1 [21]. The fibres do have a limited continuous operating temperature and are moisture sensitive after prolonged exposure, so cannot be used for high-temperature process monitoring without special precautions to protect the fibres.
4.1 Mid-IR transmission analysis of reactive processing
Vinyl polymerisation reactions may be studied by transmission FT-IR, but because of the short path length (e.g., 50 μm) required in the MIR and the need for uniform heating of the monomer in the absence of air, alternative approaches such as attenuated total reflectance (ATR) are employed. Photopolymerisation of acrylic monomers and related systems represents a challenging area for the application of real-time MIR spectroscopy since the reactions are often completed within seconds requiring excellent S/N in the spectra if reliable kinetic data are to be generated. In a study by Scherzer, the time-resolution of the FT-IR spectrometer at a resolution of 16 cm−1 was 11 ms, so 100 spectra could be gathered in the time frame of the fastest reaction. By using a diamond ATR element of area 4 mm2 that could also be heated to 200 °C, uniform irradiation was possible and the cure reactions of films ranging from 1 to 20 μm could be followed [22].
An industrial system based on transmission has been reported which is able to analyse molten polymer from a reactor stream by using a variable path length cell and a heated transfer line [23]. The system is designed to tolerate pressures up to 300 bar and temperatures up to 400 °C and this requires optical components in the sample area of diamond or ZnSe. The application reported involved the determination of vinyl acetate concentration in polyethylene and good quantitation was obtained by using the overtone of the ester band and thus a longer path length, so avoiding the high back-pressure from the narrow path length necessary to obtain quantitation of an intense band such as the ester. As discussed above, the use of overtone and combination bands and longer path lengths is a feature of NIR spectroscopy, which is the technique of choice for applications such as REX [24].
4.2 MIR emission analysis of reactive processing
The problem of reliably analysing the epoxy resin component of thermosets has also been addressed by using FT-IR emission spectroscopy (FTIES) [25]. This is of particular value in studying thin films on metals substrates as occurs in coatings or in the Quality Assurance of prepregs. A small amount of resin was transferred to the miniature platinum hotplate of the emission oven (Fig. 4) and the spectra collected as the thin film of epoxy resin and curing agent was heated through its cure cycle.
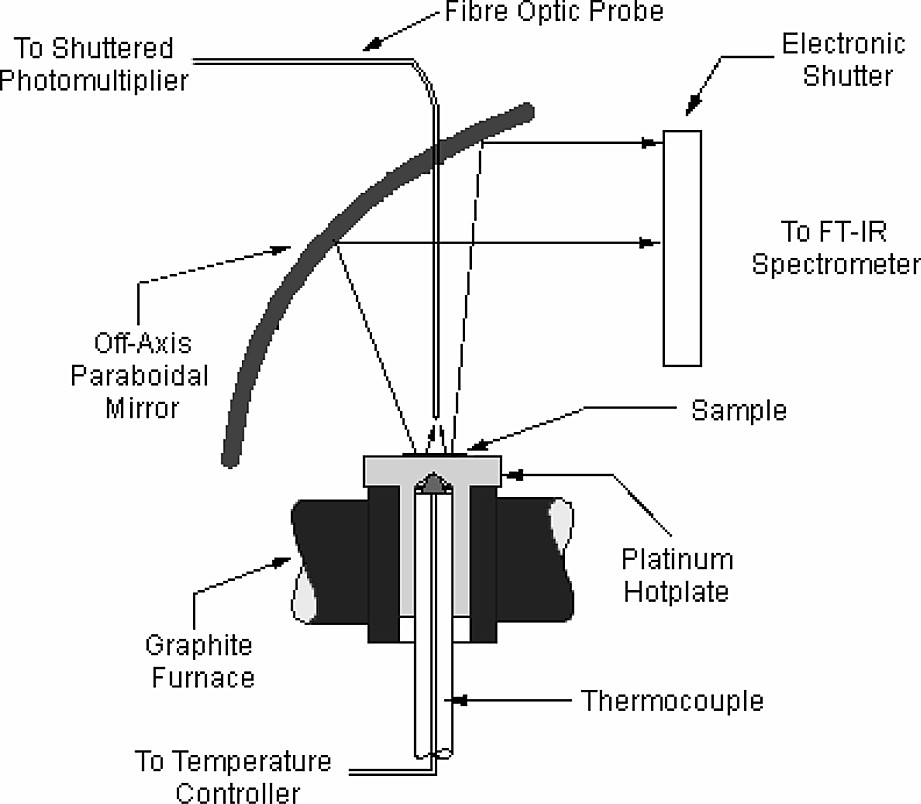
Schematic of sample area in FT-IR emission system.
High-quality spectra were generated and the amine and epoxy bands identified in MIR transmission were also identified in FTIES and found to change quantitatively as cure proceeded (Fig. 5). The bands that change with time of cure are the fundamental bands of those seen to change in the NIR region above. The quality of the spectra may be seen in Fig. 6 which shows a detail of Fig. 5 (marked with *) and the presence of the isobestic point demonstrates that Beer's law is obeyed so that quantitative analysis may be undertaken. It also shows the smooth conversion between reactants and products [25]. The experiment was thus able to generate the cure kinetics of the resin as well as identify the components. FTIES was found to be able to follow the ageing of the prepreg and so provide a rapid quality assurance technique.

Emission FT-IR from a thin film of MY721/DDS during cure.
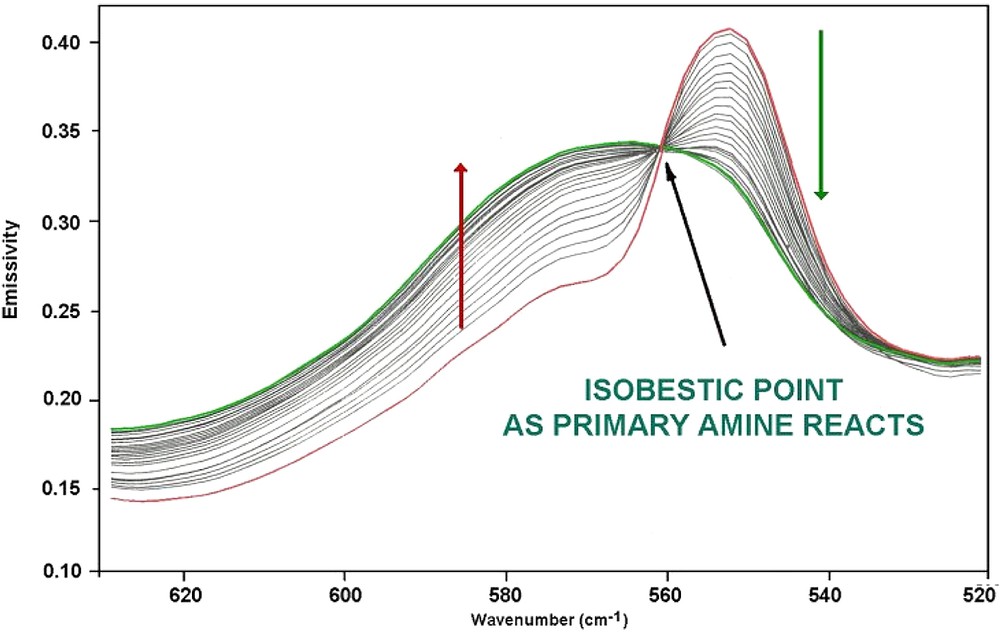
Detail of changes in FT-IR emission spectra (indicated by * in Fig. 5) from MY721/DDS during cure.
This technique has also been applied to the thermal cure kinetics of photocatalysed dicyanate esters and directly compared to MIR transmission spectra [26]. It has been shown to be reliable to high extents of conversion for quantitative analysis by determining absorbance from emissivity for each wavelength from the separate emission spectra. This offers the prospect of being able to monitor the reactive processing of thin films of thermosetting resins on metallic substrates [27].
5 Oxidation studies by transient IR transmission spectroscopy (TIRTS)
The high temperatures and shear rates during extrusion of polyolefins result in chain scission and in the presence of oxygen the formation of peroxy radicals. The free radical reactions that result are complex and specific to the polymer being extruded [1]. For example in the controlled degradation of polypropylene, the optimisation of scission is achieved by selection of the temperature and screw configuration as well as the use of oxygen and trace metals, such as by the use of metallic inserts. Transition metals catalyse the decomposition of polymer hydroperoxides and thus enhance chain scission arising from the β-scission of the alkoxy radicals. These radicals are formed by hydroperoxide homolysis. This reaction results in a decrease in melt viscosity as well as an increase in the polarity of the polymer which may assist compatibilisation in reactive blending. The functional groups that result from the oxidation of polypropylene and other polyolefins include ketones, aldehydes, esters, lactones and carboxylic acids and it is these groups that are routinely monitored by Mid-IR spectroscopy and oxidation profiles followed. The high molar absorptivity in the Mid-IR results in very short pathlengths being required that limits transmission spectroscopy as a monitoring tool for polymer melts.
Laboratory studies of FT-IR emission [28,29] have demonstrated that it may provide real-time oxidation profiles. This should be adaptable to on-line analysis by using the transient IR emission methodology developed by Jones et al. [30,31] for other applications. In this a hot gas jet is used to transiently heat a thin layer of the sample so that reabsorption effects from thick samples are avoided. By having a moving stream of sample, only a thin layer of emitting polymer is seen by the spectrometer, so that a continuous monitor of composition is obtained during reactive processing.
In a variation of this approach, the hot polymer melt acts as the IR emission source and the spectrum of this ‘grey’ body is measured through an IR transmitting window. A jet of helium impinging against the window is then applied to chill a thin film and the resulting IR radiation is attenuated by the absorption of the film (Fig. 7). The ratio of the two spectra then gives an absorption spectrum which is characteristic of the polymer melt at the point of freezing. By switching off the cooling, the polymer film is then melted and swept away. The spectrum collected is thus a transient infrared transmission spectrum (TIRTS) that may then be analysed to determine the extent of reaction. This is shown in the Fig. 8 for the process of oxidation of HDPE at 190 °C. It may be seen that there is the growth of the characteristic carbonyl bands between 1700 and 1800 cm−1. The quantification of this band may be seen in Fig. 9 where the extent of oxidation in the melt is plotted as a function of oxidation time. Also of interest in the figure above is the change in the unsaturation that is seen between 900 and 1000 cm−1. This is expanded in Fig. 8 in order to see the relative changes in the vinyl, trans-vinylene and vinylidene.
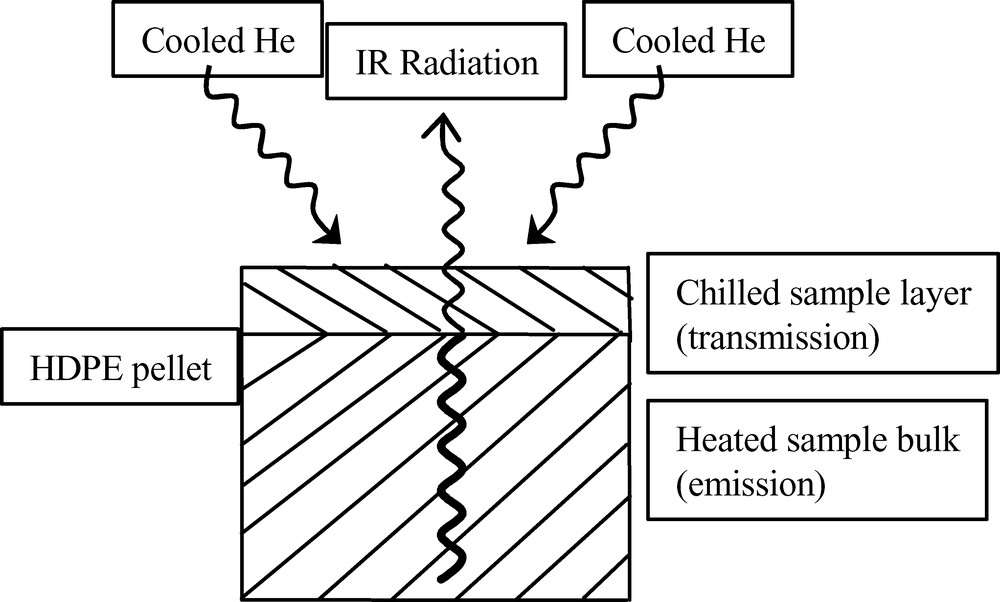
The principle of operation of TIRTS. The molten bulk sample is the IR radiation source and the absorption of this radiation by the thin chilled film of polymer is measured to give a transmission spectrum.

TIRTS spectra obtained from a HDPE melt at 190 °C showing growth in oxidation band and (inset) the changes in unsaturation on prolonged heating in the melt.

Growth in carbonyl band from TIRTS spectra during HDPE oxidation in the melt at 190 °C illustrating the ability of TIRTS to generate quantitative data for real-time monitoring of reactive processing.
The challenge in this technique is to use fibre optics to couple the TIRTS system to the reactive extruder and maintain sufficient S/N to generate quality spectra for quantification and real-time monitoring. The low emission intensities require long spectral acquisition times because of the high losses encountered with currently available components.
6 Chemometrics
The description of the various spectral techniques to obtain information regarding the chemical changes occurring in the reacting polymer during processing has focussed on the methods for obtaining compositional information by analysis of the absorption or emission spectra of the polymer. Particular attention has been paid to the transfer of radiation to and from the reacting system by fibre optics, so that spectra with maximum S/N are obtained. The level of analysis employed has been to use Beer's law or an analogous calibration to determine the concentration of reacting species from the changes in the spectral absorbance. It is assumed that the bands to be analysed are well resolved (or may be deconvoluted) from the remainder of the spectrum and a particular wavelength of absorption may be associated with the species of interest. This is a univariate method since only a single absorption band is used.
When spectra are collected from complex systems containing many components or the changes in spectra may not be readily discerned, then statistical analysis of the spectral data will often be required. The starting point for statistical analysis of spectral data is to have a digitised set of spectral parameters for the process being studied. This may be a set of absorbance spectra which consist of an ordered set of N pairs of values of the independent variable, wavenumber (cm−1) and the dependent variable Absorbance. This is then related to the variable of interest to be determined, viz. concentration through a linear relation such as Beer's law involving the molar absorptivity, or a non-linear relation which must be independently determined through a calibration routine. FT-IR and other spectrometers that are computerised, provide digitised data that are immediately available for analysis so that chemometric routines may be applied either during or after acquisition [32].
The questions that may be asked in analysing the data measured by, say, a fibre-optic-NIR system as described above are:
- ● how many components are present in the system and which of these are responsible for the spectral changes observed?
- ● What are the changes in concentration or other property of the polymer and reactants that are leading to the change?
- ● What is the relation of these to the reactive processing operation and can these changes be linked to the chemorheological properties of the system?
- ● Can a reliable calibration routine be established to enable on-line monitoring of the process variables?
Each of these questions can be answered provided the data are collected with the appropriate level of precision and good S/N [32]. The future development of the real-time monitoring of complex systems and, in particular, the determination of possible relationships between chemorheological changes and the NIR or other spectral data, may rely on these approaches rather than the univariate methods described above.
7 Conclusion
The greatest limitation in MIR monitoring of reaction processing using novel approaches such as FT-IR emission or TIRTS is in the adaptation of the technique to on-line analysis because of the limited energy transmission and thermal resistance of IR transmitting optical fibres as well as the requirement for thin samples due to the high molar absorptivities. The NIR region offers many experimental advantages for in-line monitoring of reactive processing and, in particular, the cross-linking reactions of thermosets, but there are severe restrictions to the functional groups which may be analysed at the levels encountered in chemorheological applications, particularly those involving controlled oxidation. In many applications for real-time monitoring that are less well characterised than the systems described here, the problems of precise spectral resolution and identification of a band to be used quantitatively may be solved by using a Chemometrics or other statistical approach that enables the extraction of significant components that are changing during processing.