

1 Introduction
The separation of trivalent actinides (An(III)), namely Am(III) and Cm(III), from lanthanides (Ln(III)) is a key step in the partitioning and transmutation (P&T) strategy. P&T aims at reducing the long-term radiotoxicity of high-level nuclear wastes through separation of long-lived actinides from spent nuclear fuels and transmuting them by irradiation with neutrons into short-lived isotopes. An(III)/Ln(III) separation is the decisive step in the partitioning process as some Ln nuclides have a high neutron absorption, which if not removed would reduce actinide transmutation efficiency [1]. The chemical properties and the ionic radii of An(III) and Ln(III) are comparable, rendering high demands on the selectivity of the extraction ligand. As already shown some 20 years ago [2], ligands containing soft donor atoms (such as S or N) exhibit this selectivity. The use of organic N-donor ligands has an application advantage that they can be incinerated to gaseous products, thereby reducing the volume of active waste to be disposed of [3].
Ligands containing aromatic N atoms as donor atoms are reported to complex An(III) more strongly than Ln(III), due to a greater covalent character of the An(III)–N bond [4,5]. A number of such aromatic N-donor ligands as candidates for partitioning have been reported (see, e.g., Refs. [6–8], Fig. 1). Tripodal oligoamines such as tris[(2-pyrazinyl)methyl]amine (TPZA) exhibit high selectivity for Am(III) in An(III)/Ln(III) extraction [4,9] Alkylated 2,6-di(1,2,4-triazin-3-yl)pyridines (BTP) are among the most effective extractants for the separation of Am(III) and Cm(III) from Ln(III) [10]. In liquid–liquid extractions these extractants are able to extract An(III) selectively in preference of Ln(III) from nitric acid solutions into the organic phase. This is of technological importance, as these elements are present in a nitric acid solution following dissolution of spent nuclear fuel and subsequent partitioning in the PUREX and DIAMEX processes [1,6].

Chemical structure of tris[(2-pyrazinyl)methyl]amine (TPZA) and 2,6-di(5,6-dipropyl-1,2,4-triazin-3-yl)pyridines (BTP).
Recently there has been a surge of activity in attempts to understand the underlying reason for the partitioning ligand selectivity. This understanding can potentially be used to optimize partitioning ligand design and, hence, extraction performance. The selectivity may be due to an enhanced covalence in An(III)–N bonds compared to those of their Ln(III) counterparts. This enhanced bond covalence can be expressed by a contraction in bond length and/or a higher thermodynamic stability. Our previous investigation [11] on Cm(III) and Eu(III) complexed with BTP in non-aqueous organic solution by extended X-ray absorption spectroscopy (EXAFS) and quantum chemical calculations shows the solution structure to be the 1:3 complex with a structure comparable to crystal structures of solid Ln–BTP3 [12]. The complex is comprised of three ligands directly bonded to the metal ion, with BTP acting as a tridentate ligand via binding of the central pyridine nitrogen (Npy) and two triazine nitrogens (Ntz) of the neighboring rings to the metal cation. In our EXAFS analysis we find no significant differences in the coordination numbers and bond distances of Cm–BTP3 and Eu–BTP3 [11]. We conclude, the observed selectivity of BTP for Cm(III) over Eu(III) is not structural in origin. This result is apparent contrast to the observation that in crystalline U(III) and Ce(III) BTP complexes have U(III)–N bonds observed to be 0.06–0.09 Å shorter than Ce(III)–N bonds while the difference in their ionic radii is only 0.015 Å [13,14]. Other X-ray diffraction investigations show U(III), however, to generally exhibit structurally different complexes with N-donor partitioning agents compared to their Ln(III) counterparts. For example, U(III)–N bond lengths are shorter than Ln(III)–N bond lengths in their TPZA crystalline complexes [4,5]. This observed bond shortening is interpreted as indicative of a stronger bond covalence for An(III) over Ln(III).
In this investigation we study the solution coordination chemistry of Am(III) and U(III) complexed with BTP and compare this with that for the trivalent lanthanides Gd(III) and Lu(III). Using EXAFS we also study the coordination structure of U(III) and Sm(III) complexed with TPZA in non-aqueous organic THF solution containing coordinated iodide counterions (THF is not a counterion). The EXAFS investigations are aimed at detecting if the solution complexes have coordination structures similar to solid state ones, with indications of any higher covalence in the An(III)–N bonds. In addition, fluorescence lifetimes of Cm(III) and Eu(III) (both exhibiting fluorescence emission) in the presence of varying amounts of BTP ligand (i.e., varying ligand-to-metal cation ratios, [L]/[M]) are determined by means of time-resolved laser fluorescence spectroscopy (TRLFS). These results are used to determine if significant differences in the stoichiometry and thermodynamic stability of the Cm(III) complex versus Eu(III) complex exists.
2 Experimental
n-C3H7–BTP (designated in the following simply as BTP) and TPZA are synthesized as described in Refs. [10] and [9]. The experiments are performed using stock solutions of 6.05 × 10⁻⁶ M Cm (89.68% 248Cm, 0.07% 247Cm, 9.38% 246Cm, 0.14% 245Cm, 0.30% 244Cm, and 0.43% 243Cm) and 5.0 × 10⁻⁴ M Eu in 0.1 M HClO4. The organic diluent used is a TPH/n-octan-1-ol (7:3 v/v; TPH is a kerosene from Prochrom, France) solution. Europium nitrate used for preparing the Eu-stock solution is of reagent grade with >99% purity. The Cm stock solution (30 μL) is evaporated to dryness and dissolved in 1500 μL of the organic diluent. Seven hundred and fifty microliters of 1.51 × 10⁻⁴ M BTP in organic diluent is added in portions ranging from 10 to 375 μL to the Cm stock solution resulting in a [L]/[Cm] ratio of 8.3–624, and the decrease of fluorescence intensity as a function of delay time is recorded after each addition. The Eu(III) experiment is performed in a similar manner beginning with 36 μL of a 5.0 × 10⁻⁴ M Eu-stock solution, adding portions of a 1.51 × 10⁻² M BTP in organic diluent ([L]/[Eu] ratios 8.4–629), and recording lifetimes after each BTP solution addition.
BTP complex EXAFS samples are prepared by extracting the trivalent metal cation in acidic aqueous solution (243Am(III), Gd(III), or Lu(III) in 0.01 M HNO3 + 2 M NaNO3) into a solution of 0.04 M BTP in the organic diluent. Following phase separation, the organic phase is transferred into sealed polyethylene vials for measurement. Previous test results of the sample preparation method with Am(III) and Eu(III) (for a description of the method see Ref. [15]) are used to scale the extraction to yield a distribution ratio of at least 10 or better and a metal concentration in the organic phase of approximately 1 × 10⁻³ M for all samples.
The metal solvates UI3(THF)4 and SmI3(THF)4 are prepared according to Refs. [16] and [17].
The U(III)–BTP complex is prepared by mixing 1 mL of a 3.3 × 10⁻² M solution of BTP and 1 mL of 1.0 × 10⁻² M solution of UI3(THF)4 in pyridine yielding a 5 × 10⁻³ M solution of [U(BTP)3]3+.
The solid samples of SmI3(TPZA)(THF) and UI3(TPZA)(THF) are prepared as described in Ref. [4].
The TPZA complexes are prepared by mixing 1 mL of a 1.1 × 10⁻² M THF solution of TPZA and 1 mL of a 1.0 × 10⁻² M THF solution of SmI3(THF)3.5 or UI3(THF)4 yielding a 5 × 10⁻³ M solution of [M(TPZA)]3+. As the Sm(III) sample is sensitive to hydrolysis in organic neutral media and the U(III) is sensitive to oxidation, utmost care is taken to prevent contact of the samples with moisture and air. All samples are prepared in an inert gas glovebox with less than 1 ppm O2 and H2O. Ln(III) samples are transferred for EXAFS measurement into capped vials and heat-sealed within Ar-filled polyethylene (PE) foil (“pillow” technique) while still within the glovebox. Samples are transported to the beamline in an Ar-filled desiccator and kept there until use. The U(III) samples are also placed into capped vials. These are placed inside of individual PE bottles, which are equipped with air-tight inlet and outlet tubing. Three bottles are connected to each other in a daisy-chain fashion (i.e., the outlet of the first bottle is connected to the inlet of the second bottle, the outlet of this bottle to the inlet of the last bottle) and flooded with Ar. The inlet of the first bottle and the outlet of the last bottle are equipped with valves which are closed before removal from the glovebox and transport to the INE-Beamline. The transport from the INE controlled laboratories to the INE-Beamline, where the bottles are then continuously flushed with argon for measurement, takes less than 30 min. No measurable shifts in the U L3 white line energy in the XANES of the U(III) samples at 17.172 keV is observed and the dark blue color of the samples is preserved over 5 h showing that this setup is sufficient for keeping the samples stable.
TRLFS measurements are performed as described in Ref. [11]. For measuring the lifetime of the fluorescence emission, the delay time between excitation pulse and detection is shifted in 25 μs steps within a 1.2–1400 μs time interval for Cm(III) and in 50 μs steps within a 1.2–11 000 μs time interval for Eu(III).
Am L3 and U L3 EXAFS measurements are performed at the INE-Beamline for actinide research [18] at ANKA, Forschungszentrum Karlsruhe, Germany, using a Ge(422) crystal pair (2d = 2.3094 Å) in the double crystal monochromator (DCM). Sm, Gd, and Lu L3 EXAFS spectra are recorded at the ANKA-XAS Beamline using a Si(111) pair. Both stations have a fixed exit DCM geometry and an encoder on their theta angle positioning motors. Higher harmonic radiation in the incident beam is suppressed by detuning the parallel alignment of the DCM crystals to 60–70% of photon flux peak intensity. The actinide L3-edge spectra are calibrated against the first derivative X-ray absorption near edge structure (XANES) spectrum of a Zr or Y foil (17 998 or 17 080 eV, respectively), and the Ln L3-edge spectra using a Fe foil (7112 eV). EXAFS spectra are recorded in fluorescence detection mode using a 5-pixel energy dispersive solid state Ge detector (Canberra LEGe). Incident beam intensity, I0, is measured using N2 (for Ln L3 spectra) or Ar (An L3 spectra) filled ionization chambers. Up to five scans are collected and averaged for each sample.
The EXAFS oscillations are extracted according to standard procedures using the Athena program [19] or WinXAS [20]. The threshold energy of L3-edges (E0) is set to the white line position. Conventional analysis of EXAFS data is made by performing theoretical least squares fits of the EXAFS spectra to the EXAFS equation in R-space using the feffit software [21]. Metric parameters describing the coordination structure are obtained: coordination numbers (N), interatomic distances (R), mean square radial displacements or EXAFS Debye–Waller factors (σ2), and relative shifts in threshold energy (ΔE0). The amplitude reduction factor S02 is held constant at unity during fits. Theoretical single scattering phase shift and backscattering amplitude functions calculated with the ab initio multiple-scattering code feff8 [22] are used in the fits. For the TPZA complexes a 31-atom cluster (1 central metal ion, 3 I ions, 22 C and N atoms from the TPZA ligand, and 5 O/C atoms from THF; H atoms are neglected) having Cartesian coordinates calculated from XRD results [4] is used for the feff8 calculations. For BTP a 55-atom cluster (1 central metal ion and 54 C and N atoms from three BTP ligands, excluding rest groups on the triazine rings) having Cartesian coordinates for the Ce-complex reported in Ref. [13] is used. In this case, the EXCHANGE 3 2 1 control card in feff8 is specified.
The BTP sample data are modelled in the fits in a manner analogous to that of our previous investigation using four coordination shells in the R-range 1.2–4.9 Å [11]. These shells are 9 nearest Npy and Ntz atoms directly bound to the metal cations, the second and third shells of 18 C/N atoms each (designated C/N and C′/N′, respectively), and a fourth, most distant shell of 9 C atoms, corresponding to the C atom located para to the ligating N atoms. Three significant three-legged multiple-scattering paths (An/Ln → N → C/N → An/Ln, An/Ln → C/N → C′/N′ → An/Ln, and An/Ln → N → C′/N′ → An/Ln paths) are included in the fits with their effective path lengths correlated to single scattering distances involved. A global ΔE0 and also σ2 values are varied. EXAFS are Fourier transformed in the k-range 2.8–10 Å−1, except for Gd data (2.8–11.3 Å−1), using symmetric square windows with Δk = 0.1 Å−1 ‘Hanning sills’.
The solid Sm–TPZA_Ts sample (Sm(TPZA)I3(THF)) spectrum is initially modelled with a single N shell and an I shell. Subsequently, the data is fit with three shells: O, N, and I in order to include the coordinated THF into the fit model. The results for this fit had high statistical errors, especially for parameters associated with EXAFS amplitude, as these parameters are found to be highly correlated. For this reason, input parameters for N are held constant at the next nearest integer obtained in those fits (1, 4 and 3, respectively), which are also the expected values from XRD results. The Sm solution sample Sm–TPZA_Tl spectrum is fit using the same model as the solid sample. The quality of the U L3 EXAFS for the solid U–TPZA_Ts (U(TPZA)I3(THF)) sample is not high enough to fit a model beyond an initial two-shell (a single N shell and an I shell) fit. The two shells fit to the solution U–TPZA_Tl sample yields coordination numbers for the N and I shells of 5.2 and 2.6, respectively. The data are then fit with three (O, N, and I) shells in a manner analogous to the Sm data.
Sm L3 EXAFS are Fourier transformed in the k-range 2.4–10.5 Å−1 and fits performed in the R-range 0.6–3.2 Å. U L3 are Fourier transformed in the k-range 1.6–9.9 Å−1 and fits performed in the R-range 1.1–3.2 Å. As for fits to the BTP samples, ΔE0 is treated as a global parameter throughout.
3 Results and discussion
3.1 EXAFS of the trivalent metal cation solution BTP complexes
The k2-weighted EXAFS of the BTP complexes are shown in Fig. 2. Upon inspection of the spectra we observe that the amplitude of the U L3 spectrum is dampened in comparison to the other spectra. The higher amplitude of the Ln L3 EXAFS is due to the better backscattering ability of the light N/C atoms at the lower Ln L3 energies. All spectra exhibit a similar beat pattern with the most prominent features being a small intensity maximum between 5 and 6 Å−1, followed by the most intense maximum at about 6.5 Å−1, and a split oscillation centered at 9 Å−1.
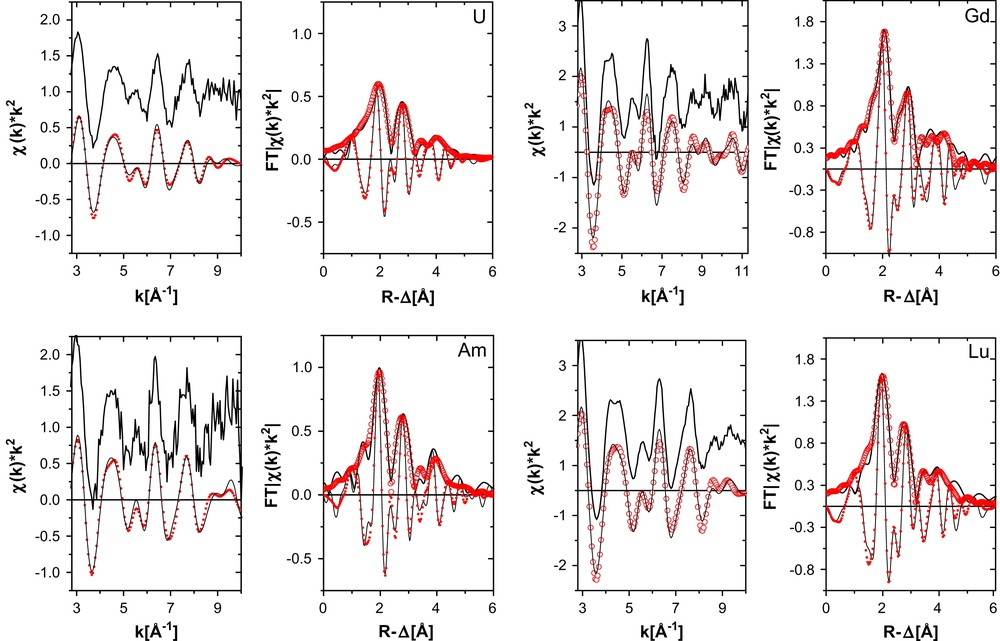
k2-Weighted L3-edge EXAFS (experimental data at top, shifted along the y-axis for clarity, and Fourier filtered data at bottom) and their corresponding Fourier transform (FT) data for U–BTP3 and Am–BTP3 (left) and Gd–BTP3 and Lu–BTP3 (right). Experimental data are shown as lines and fit curves as open circles. Imaginary part of the fit curve FT is denoted as small filled circles.
The fit results to the spectra are listed in Table 1. We see from the results that the low amplitude of the U oscillations is expressed in a higher σ2 value. We do not think that is an indication of partial oxidation of U(III). Great efforts are made to keep the sample under inert gas atmosphere during transport and measurement. The white line maximum remained within 1/10 eV throughout the measurements indicating no change in the oxidation state (no oxidation to U(IV)) and the first derivative of the XANES region (not shown) showed no shoulder corresponding to the “yl” multiple-scattering resonance expected for U(VI). In systematic EXAFS studies of Np(IV)/Np(V) mixtures, the neptunyl presence is reported to be easily identified from the observation of the short bonds associated with the axial oxygen atoms [23]. We find no evidence for the axial oxygen atoms in our U L3 EXAFS data.
Metric parameters from fits of R-space data in Fig. 2
| Sample | Shell | Na | R [Å] | σ2 [Å2] | ΔE0 [eV] | r-Factorb |
| Am–BTP3 | N | 9 | 2.562(5) | 0.004(1) | −0.75(f) | 0.037 |
| C/N | 18 | 3.423(7) | 0.004(2) | |||
| C′/N′ | 18 | 4.77(6) | 0.002(24) | |||
| C | 9 | 5.25(7) | 0.001(6) | |||
| U–BTP3 | N | 9 | 2.57(2) | 0.012(2) | 2(2) | 0.031 |
| C/N | 18 | 3.44(2) | 0.007(2) | |||
| C′/N′ | 18 | 4.85(8) | 0.004(3) | |||
| C | 9 | 5.34(9) | 0.005(18) | |||
| Lu–BTP3 | N | 9 | 2.52(1) | 0.004(1) | 4(1) | 0.030 |
| C/N | 18 | 3.35(2) | 0.006(2) | |||
| C′/N′ | 18 | 4.77(3) | 0.005(2) | |||
| C | 9 | 5.26(3) | 0.0004(12) | |||
| Gd–BTP3 | N | 9 | 2.554(5) | 0.004(1) | 4.2(f) | 0.030 |
| C/N | 18 | 3.41(3) | 0.005(2) | |||
| C′/N′ | 18 | 4.80(3) | 0.001(5) | |||
| C | 9 | 5.29(4) | 0.0005(12) |
a Held constant in the fit model.
b Parameter describing goodness of fit = weighted sum of squares of residuals divided by the degrees of freedom.
The trend observed comparing R-values between An(III) samples and between Ln(III) samples follows that expected for ionic radii contraction across the 5f and 4f series; the Am–N bond is shorter than the U–N bond length (although the difference in Am–N and U–N distances is not significant; similar results have recently been reported in a quantum chemical study [24]) and the Lu–N shorter than R(Gd–N). The observed trends, however, lie outside the range expected judging from tabulated ionic radii (U3+ 1.01 Å, Am3+ 0.96 Å, Gd3+ 0.94 Å, Lu3+ 0.85 Å). The difference between the metal–N distance and the metal cation radius is smallest for U(III) (1.56 Å) and greatest for Lu (1.67 Å). If we consider this difference between bond distance and ionic radius to be a measure for the bond strength or covalence (i.e., deviation from an ionic bond), then we conclude that the covalence of the metal cation–N bond is the greatest for U(III) and the ionic character of the metal cation–N bond is the greatest for Lu(III). This difference between Am(III) and Gd(III) is only 0.01 Å (1.60 Å versus 1.61 Å, respectively) and lies inside the error of determination (approximately 0.02 Å). Previously reported coordination structures of the Eu–BTP3 and Cm–BTP3 [11] also yield comparable differences between bond distance and trivalent metal ionic radius, being 1.61 (Eu) and 1.62 (Cm). If any difference in covalent character of the binding between Am(III) or Cm(III) cations and the BTP ligand compared to that of complexes of Ln(III) in the middle of the 4f series exists, then this character is not large enough to be expressed in bond contractions larger than 0.02 Å.
The values for the third and fourth shell distances for Am(III) appear too short for the 2.56 Å Am–N distance. The quality of the fit to this spectrum is also worse than the other spectra. This may indicate that the BTP ligands are not simply oriented in a planar fashion but are tilted or twisted. This would cause a bend or variation in the relative Am–N–C/N angles and, hence, a decrease in the distances between Am(III) and the next shells. In comparison, the BTP ligands in the solid structure of [Ce(BTP)3]3+ are also non-planar [13].
3.2 Fluorescence lifetime measurements of Cm(III) and Eu(III) with BTP at varying [L]/[M] ratios
Fluorescence lifetimes for Cm(III) and Eu(III) with varying [L]/[M] ratios are determined by measuring the decrease in fluorescence intensity as a function of delay time. The plots of these measurements are depicted in Fig. 3. Fig. 3a shows the lifetime measurements for Cm(III) and Fig. 3b those for Eu(III). The lifetime of Cm(III) in the organic diluent alone is 394 μs. Formation of BTP complex leads to a decrease of the fluorescence lifetime. The decay of the fluorescence intensity of Cm(III) in the presence of BTP follows a monoexponential law and the lifetime is invariant of [L]/[Cm]. We conclude that a single species forms, which we know from EXAFS investigation [11] to be the 1:3 Cm–BTP3 complex. We find the average lifetime for Cm–BTP3 to be 313 ± 8 μs at [L]/[M] values between 16.7 and 624.2. This 313 μs lifetime is significantly shorter than the calculated radiative lifetime of 1.3 ms [25] expected for Cm(III) with 9-fold coordination by three tridentate ligands, replacing all nine coordinating water molecules in aqueous solution. The observed shorter fluorescence lifetime results from a quenching process via intramolecular energy transfer from the Cm(III) excited state to a low lying triplet state of the organic ligand. Quenching via organic impurities of the organic solvent can be excluded, as measurements performed in organic solvents other than TPH/n-octan-1-ol also exhibit the same lifetime to within the error bars. Similar quenching processes are observed for Cm(III)–(ClPh)2PSSH-synergist complexes. The lifetimes (221 μs for Cm–(ClPh)2PSSH–TBP, 267 μs for Cm–(ClPh)2PSSH–TOPO, and 318 μs for Cm–(ClPh)2PSSH–T2EHP [26]) are also significantly shorter than the theoretical lifetime of 1250 ± 80 μs [25].
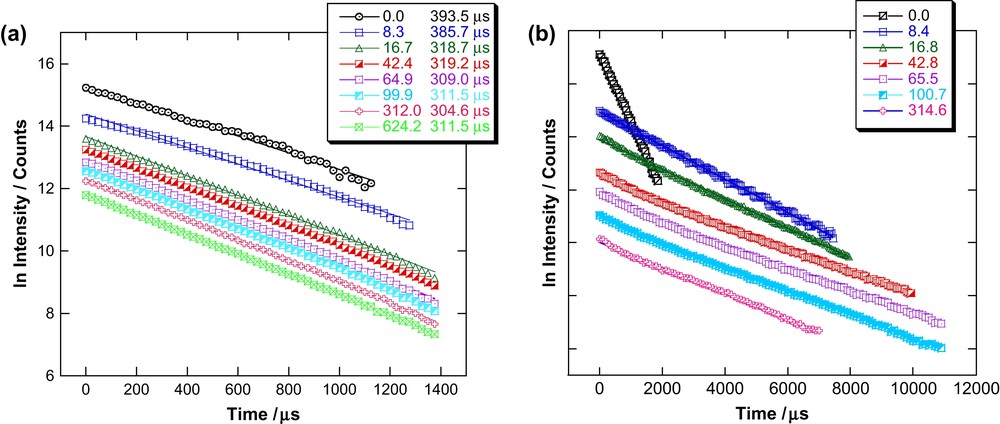
Lifetime measurements for Cm(III) (a) and Eu(III) (b) in TPH/n-octan-1-ol with varying [L]/[M].
The fluorescence lifetime of Eu(III) in the organic diluent used is 382 μs. In contrast to Cm(III), Eu(III) in the presence of increasing amounts of BTP shows a biexponential fluorescence intensity decay with a short-lived (species I) 524 ± 5 μs lifetime and a long-lived (species II) 2437 ± 22 μs lifetime component. We can extract the emission spectra of both species through deconvolution of emission spectra over the entire [L]/[M] range studied (Fig. 4). As for Cm(III), we can associate the 1:3 Eu–BTP3 complex deduced by EXAFS analysis [11] with the 2437 ± 22 μs lifetime. The lifetime increase is associated with increasing number of coordinating ligands (see Section 3.3). The observed increase allows us to safely assume that quenching via the organic ligand for Eu(III) is negligible.
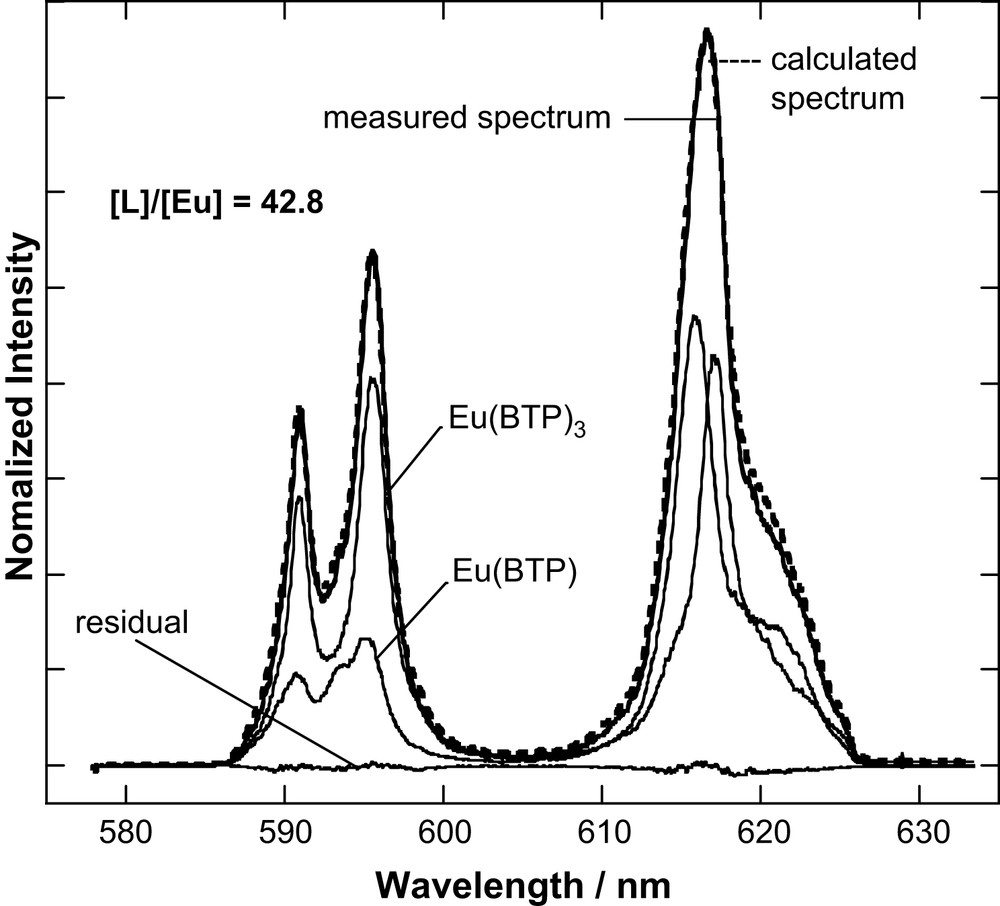
Peak deconvolution result for the emission spectrum recorded for [L]/[Eu] = 42.8.
3.3 Identification of species I (Eu–(n-C3H7–BTP)x; x = 1 or 2)
The fluorescence lifetime is determined by radiative and non-radiative decay processes of the excited state. In aqueous solution non-radiative decay is predominantly caused by energy transfer from the metal ion excited state to ligand vibrational states, e.g., OH-vibrations of coordinated H2O molecules. Replacement of water molecules in the inner coordination sphere with complexing ligands reduces the non-radiative decay and, hence, leads to an increase in fluorescence lifetime. Kimura and Choppin [27] empirically determined a linear equation relating the number of water molecules coordinating Eu(III) and the fluorescence decay rate Kobs (the reciprocal of the excited state lifetime τ):
| (1) |
We apply a similar method for determining the number of BTP molecules coordinating Eu(III). We make a linear plot of Kobs versus number of coordinating BTP molecules using the 2437 ± 22 μs lifetime for Eu–BTP3 and the lifetime for Eu(III) in the organic diluent alone (382 μs), defined as “zero” coordination with BTP (Fig. 5a). We derive a linear correlation between the number of BTP molecules coordinating Eu(III) and Kobs similar to Eq. (1) for coordinating water molecules:
| (2) |
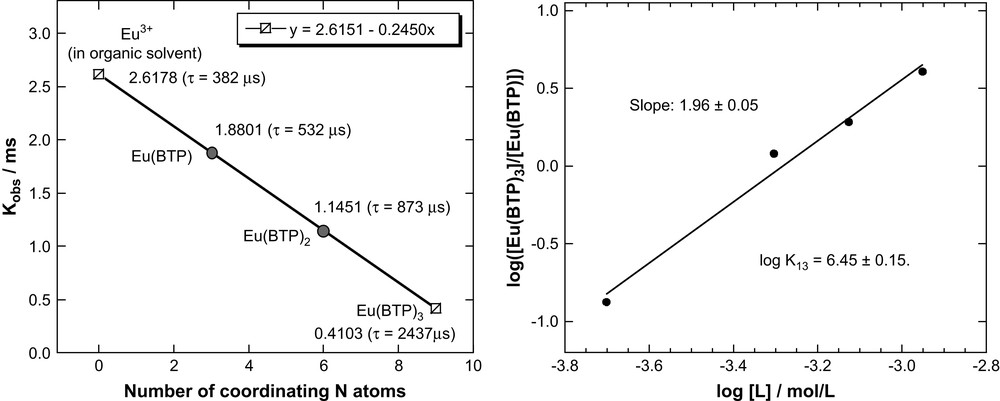
Plot of the number of coordinating BTP molecules and the decay constant Kobs (calculated fluorescence lifetimes in parentheses) (a) and double-logarithmic plot of the [Eu–BTP3]/[Eu–BTP] concentration ratio versus BTP concentration (b).
Using Eq. (2) or Fig. 5a we can estimate expected Kobs (τ) values for the 1:1 Eu–BTP and 1:2 Eu–BTP2 complexes to be 1.8801 ms−1 (532 μs) and 1.1451 ms−1 (873 μs), respectively. Comparison of these values with the experimental value for the fluorescence lifetime of species I (524 μs) allows us to identify species I as the 1:1 Eu–BTP complex.
Further proof for the formation of the 1:1 Eu–BTP and 1:3 Eu–BTP3 complexes is obtained by slope analysis. We assume that Eu–BTP reacts with two BTP molecules to form the 1:3 complex:
| Eu–BTP + 2BTP ↔ Eu–BTP3 | (3) |
According to Eq. (3), the conditional stability constant K13 for the 1:3 Eu–BTP3 complex is defined by
| (4) |
It follows:
| (5) |
According to Eq. (5) there is a linear correlation between the logarithm of the [Eu–BTP3]/[Eu–BTP] concentration ratio and the logarithm of the [BTP] concentration with a slope of 2. Fig. 5b shows a double-logarithmic plot of [Eu–BTP3]/[Eu–BTP] verus [BTP]. The concentration ratios are determined by deconvolution of emission spectra. The plot in Fig. 5b is linear with a slope of 1.96 ± 0.05. This corroborates the postulated complexes Eu–BTP3 and Eu–BTP and their formation according to Eq. (3). If the 1:2 Eu–BTP2 species forms at all, it is a transient species or forms in negligible amounts. From the y-intercept of Fig. 5b (linear regression results of the plot and Eq. (5)) we estimate log K13 to be 6.45 ± 0.15.
3.4 EXAFS of the trivalent metal cation TPZA complexes
The U and Sm L3 k2-weighted EXAFS and fit curves for the SmI3 and UI3 TPZA complexes in THF both in the solid state (Sm–TPZA_Ts and U–TPZA_Ts) and as solution complexes (Sm–TPZA_Tl and U–TPZA_Tl) are shown in Fig. 6. The results from fits to the data are listed in Table 2. For comparison, interatomic distances from reported XRD studies for the La and U complexes are also listed in the table. We have scaled the XRD values for the Sm samples to be 0.08 Å shorter than the La counterpart to account for the difference in their ionic radii. Upon comparing the results for Sm–TPZA_Ts with those for Sm–TPZA_Tl we find the only significant difference in the Sm–I distances. In solution this distance increases over that obtained in the fit to the crystalline solid sample data to a value comparable to the XRD average Sm–I distance. The O and N distances obtained in the EXAFS analysis for the two solid samples are all 0.04–0.05 Å shorter than those calculated from refined XRD data; the cation–I distances are 0.07 Å shorter for the Sm–TPZA_Ts and 0.1 Å for the U–TPZA_Ts sample. We do not know the source of this discrepancy.
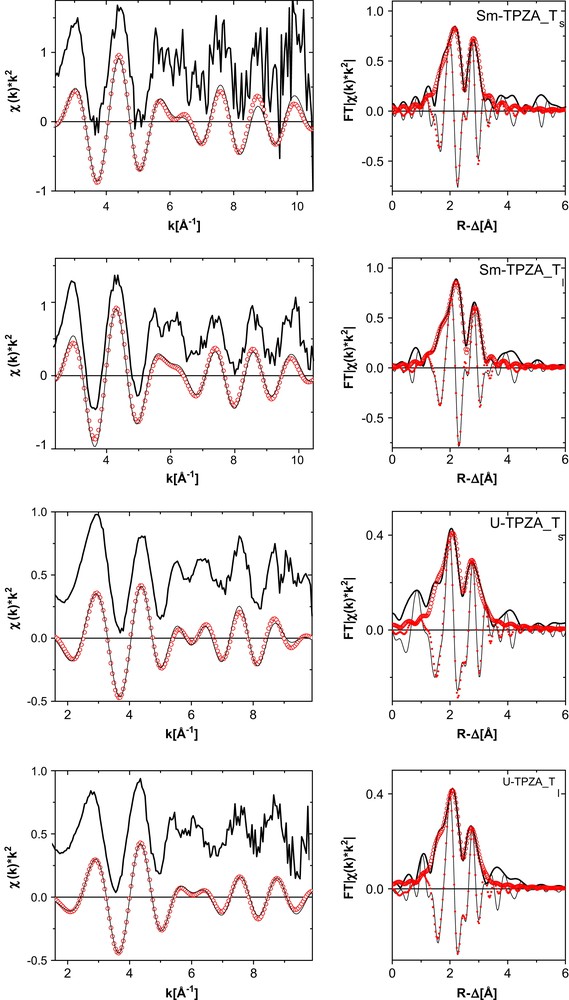
k2-Weighted L3-edge EXAFS (experimental data at top, shifted along the y-axis for clarity, and Fourier filtered data at bottom) and their corresponding Fourier transform (FT) data for SmI3 and UI3 TPZA complexes in THF both in the solid state (Sm–TPZA_Ts and U–TPZA_Ts) and as solution complexes (Sm–TPZA_Tl and U–TPZA_Tl). Experimental data are shown as lines and fit curves as open circles. Imaginary part of the fit curve FT is denoted as small filled circles.
Metric parameters obtained from fits of R-space data for the TPZA samples indicated (spectra shown in Fig. 6)
| Sample | Shell | N | R [Å] | σ2 [Å2] | ΔE0 [eV] | r-Valuea |
| Sm–TPZA_Ts | ||||||
| Two-shell fit | N | 5(1) | 2.56(2) | 0.009(4) | −2.4(1.2) | 0.036 |
| 2.62 ± 0.05 | ||||||
| I | 2.7(9) | 3.06(1) | 0.005(3) | |||
| 3.13 ± 0.03 | ||||||
| Three-shell fit | O | 1(f) | 2.45(6) | 0.001(6) | −2(f) | 0.031 |
| 2.49 | ||||||
| N | 4(f) | 2.61(2) | 0.007(6) | |||
| 2.66 ± 0.05 | ||||||
| I | 3(f) | 3.060(9) | 0.006(1) | |||
| 3.13 ± 0.03 | ||||||
| Sm–TPZA_Tl | O | 1(f) | 2.43(3) | 0.0001(49) | −2.5(f) | 0.024 |
| N | 4(f) | 2.63(1) | 0.001(2) | |||
| I | 3(f) | 3.12(1) | 0.008(2) | |||
| U–TPZA_Ts | N | 6(1) | 2.61(3) | 0.0020(6) | −5.4(f) | 0.030 |
| 2.66 ± 0.05 | ||||||
| I | 3.0(8) | 3.14(1) | 0.008(3) | |||
| 3.24 ± 0.06 | ||||||
| U–TPZA_Tl | O | 1(f) | 2.42(7) | 0.011(11) | −6(1) | 0.020 |
| N | 4(f) | 2.64(2) | 0.009(4) | |||
| I | 3(f) | 3.12(2) | 0.011(2) |
a Parameter describing goodness of fit = weighted sum of squares of residuals divided by the degrees of freedom.
Comparison of the interatomic distances obtained from fits to the Sm–TPZA_Tl EXFAS data with those for U–TPZA_Tl reveals that they are the same to within experimental error. Similar to our observations for the results of trivalent metal cation–BTP3 complexes, this is not what we expect based on their tabulated ionic radii (U3+ 1.01 Å, Sm3+ 0.96 Å). The difference between the metal–O (metal–N) distance and the metal cation radius is in this case 1.41 Å (1.63 Å) for U(III) and 1.47 Å (1.67 Å) for Sm. In other words, the distances in the two solution complexes are the same although the ionic radius of U(III) is 0.05 Å longer compared to Sm(III). In solution, the U–O(N) bond distance is about 0.06(0.04) Å shorter than expected for a pure ionic bond. This difference we consider to be a measure for the bond covalence and conclude that U–TPZA_Tl has a greater covalent character of its binding to the ligand than does Sm–TPZA_Tl, in accord with conclusions based on the solid crystalline structures [4].
4 Conclusion
Our overall scientific objective of these EXAFS investigations of the interaction between An(III) and Ln(III) cations and N-donor partitioning extractant ligands is to establish whether ligand selectivities manifest themselves in coordination structure differences. From our EXAFS studies of An(III) and Ln(III) complexed with BTP and with TPZA, we find no obvious link between structure and liquid–liquid extraction performance. We find that U(III) shows an apparent higher covalent character of its U–N binding, expressed by a decrease in the bond distance over that expected for pure ionic binding. This result shows that the structural differences observed in the solid state are significant and well representative of the solution structural differences. However, we observe no measurable differences for Am(III) and Cm(III) and the Ln(III) elements in the middle of the 4f series. It therefore remains questionable if U(III) can be used as a good model for Am(III) and Cm(III). However, studying the contrast in behavior between U(III) on one hand and Am(III) and Cm(III) on the other hand has, and will, help us to understand trends in the coordination structures. It remains to be established if the presence of a covalent contribution to U(III)–ligand bonding, reflected in structural differences, can help to predict the extraction efficiency of partitioning ligands. Work directed to elucidate this is in progress in our groups.
The TRLFS study scientific objective is to determine if differences in the stoichiometry and thermodynamic stability of the solution BTP complexes of An(III) over Ln(III) exist, using Eu(III) and Cm(III) because of their excellent fluorescence properties. Our TRLFS results show that Cm–BTP3 is formed at much lower [L]/[M] ratio than Eu–BTP3 confirming BTP's selectivity in liquid–liquid extraction [6,10]. We are able to determine a conditional stability constant K13 for the 1:3 Eu–BTP3 of 2.8(±1.4) × 106. If we assume the Cm–BTP3 to form in a similar manner as Eq. (3), we can predict K13 for the 1:3 Cm–BTP3 by comparison with the Eu results. The total BTP ligand concentration used for the Cm(III) experiments is two orders of magnitude lower than that used for Eu(III). This means that K13 for Cm–BTP3 is estimated to be more than three orders of magnitude higher than that of Eu–BTP3. This large difference in K13 can help explain the selective extraction behavior of BTP, expressed as separation factors (SF) for Am(III) or Cm(III) from Eu(III) (SF = distribution ratio DAm/DEu upon extraction) on the order of more than 100.
Future work is aimed at synthesis of new, softer donor ligands that promise to result in a higher covalent character of the An(III)–N binding, even for Am(III) and Cm(III). The An(III) and Ln(III) complexes of these new ligands will be investigated using X-ray crystallography in the solid state and solution complexes studied by means of EXAFS. Furthermore, we plan to study complexes prepared under conditions as close as possible to actual partitioning conditions. Both TRLFS and time-resolved EXAFS studies will be performed in order to evaluate the role of kinetic effects on the extraction performance.
Acknowledgements
This work was supported by the Commission of the European Community under contracts FIKW-CT2000-00087 and FI6W-CT-2003-508854, the European Network of Excellence for Actinide Sciences (ACTINET) and the “Commissariat à l'énergie atomique, direction de l'Énergie nucléaire” (France). We thank B. Brendebach, K. Dardenne, J. Rothe, and S. Mangold for assistance during experiments and ANKA for beamtime allotment.