

1 Introduction
For industrial, environmental and public health purposes, the actinide chemistry has been the subject of considerable efforts since the 1950s. Aqueous redox chemistry, ion selective recognition, uptake by specific biomolecules or compartments of the geosphere and transport are some of the major fields of investigation. Additional difficulty comes from the fact that fundamental understanding of actinide physical chemistry is still at the early stages of knowledge compared to d-transition metals. In this family of elements, the 5f and 6d frontier orbitals are at stake in the formation of the chemical bond between the actinide cation and its ligand. The “5f” orbital extension is rather large compared to the “4f” extension and consequently, their “5f” valence electrons are relatively available. This partially explains why actinide molecular chemistry is surprisingly rich compared to lanthanide chemistry. Therefore, actinides' oxidation states span from (III) to (VII), depending on the chemical conditions, compared to mainly (III) for the lanthanide elements. One of the most striking properties of the actinides is the propensity of some of them (U, Np, Pu, Am) to form AnO2n+ (n = 1, 2) transdioxo cations, so-called actinyls, with two strong An–O covalent bonds, at oxidation states (V) and (VI).
Thorium bears the formal configuration 5f0 at oxidation state (IV) which is therefore the only stable form in atmospheric conditions. It does not occur as an oxo cation in these conditions. Protactinium, as the first actinide with 5f-electrons involved in bonding (ground state electronic configuration 5f26d17s2), occupies a key position in the actinide series. At formal oxidation state (V) (its most stable oxidation state in solution as well as in the solid state) Pa(V) corresponds also to the formal 5f0 electronic configuration and has been reported to occur as a mono oxo Pa(V)O3+ cation [1]. The existence of the PaO2+ form in solution and in solid state has never been reported. U(VI) also corresponds to the formal oxidation state 5f0 and is most often encountered as the stable dioxo cationic form U(VI)O22+. Np(V)O2+ is the stable form of neptunium at formal oxidation state (V) under atmospheric conditions, with formal 5f2 electronic configuration. U(V) is highly unstable under atmospheric conditions and Pu(V)O2+ dismutates into Pu(IV) and Pu(VI) in the same conditions.
At other oxidation states than (V) and (VI), the actinide cation polyhedron is characterized by large, flexible coordination spheres with various stable and metastable metal oxidation states ranking from (III) to (VII). Coordination numbers for coordination states (V) and (VI) range from 4 + 2 to 6 + 2 in a bipyramidal type of polyhedra, and from 8 to 12 for oxidation states (III) and (IV) in prism, caped prism or dodecahedron polyhedra.
Several spectroscopic tools have been technically well adapted to actinide chemistry, as Infra-Red Spectroscopy and Spectrophotometry. X-ray Absorption Spectroscopy (XAS) is also an ideal structural and electronic probe of the cation coordination sphere merely independent of the physical state of the sample under study. In this field, the actinide L3 edge (corresponding to the dipolar 2p–6d transition) has been most frequently used because the energy range involved (from 16 to 19 keV) is consistent with the presence of radiological barriers around the sample. Although significant structural information on the coordination polyhedron can be obtained from these electronic transitions because of the importance of shape resonances [2,3], the very short core-hole lifetime broadens the edge signal (about 7 eV for U) resulting in very little extractable electronic information. In most studies, a systematic investigation of the relative L3 edge position and width results in a qualitative comparison of the metal environment and its influence on the cation effective charge as well as the influence of the ligands. At the other end of the spectral range, N3 (dipolar 4p–6d transition) and N4,5 (dipolar 4d–5f transition) as well as M4,5 (dipolar 3d–5f transition) edges are relatively insensitive to resonances, but they provide a much better resolution and a direct electronic probe of both 5f and 6d orbitals. Overall, from soft X-rays (1043 eV for uranium N3 edge) to hard X-rays (17166 eV for uranium L3 edge), the tunability of the photon probe allows to selectively investigate both structural and electronic properties of the actinide coordination sphere, taking advantage of the large number of electronic levels in these elements. Understanding and interpreting the edge features of actinides is still a methodological challenge. Within the absorber potential barrier, the electron is trapped above the energy threshold and both multiple scattering or molecular orbital pictures can be used, as they should reflect the same underlying phenomena when electronic correlations are negligible. It is well known for instance that pre-edge features of the transition metal K edges can be treated as transitions to bound states made of the hybridized unoccupied or partially occupied d and p states [4,5]. In the case of the L3 edges of the actinide elements, it has been suggested that the multiple scattering picture is more suitable to explain the edge features [6] as mixed bound-continuum states are believed to dominate the white line shape and intensity. In contrast, the L3 edges of the lanthanide ions exhibit a very sharp, intense and often featureless white line that may reflect the transition to the narrow 5d states of lanthanides compared to the more diffused 6d's of the actinides.
In order to extract quantitative features from edge data, such as electronic localization, numerical simulation is a non-routine, inescapable task. Input of electronic structures from quantum chemical calculations in the simulation codes may lead to a better description of the initial state. However, one of the main bottlenecks is still the accurate description of the final states and molecular potentials. In many cases, only relative data are expected while absolute values are still difficult to obtain. In addition, the structural environment around actinide ions in solution is often not well known and defined. As a prerequisite, refinement of the structure needs the use of techniques independent of spectroscopic probes, among them quantum and statistical mechanics have been proven quite useful [3,7]. Such quantitative approaches in the hard X-ray region have long been applied to spin state or local symmetry studies of transition or lanthanide metal series. On the other hand, a very limited number of studies have been devoted to actinide elements, most of which dealing with oxide, halide or intermetallic solid-state materials. At the molecular level, only few papers have been addressing the simulation of actinide XANES spectra.
In this paper, we review the interpretation and simulation of XANES spectra of various uranium compounds from L to M edges. We will see that the multi-edge approach provides a useful probe of both electronic and geometric structures in actinide compounds. Moreover, coupling XANES study with theoretical chemistry allows: (i) a better interpretation of experimental data, and (ii) to validate and improve the calculation models.
2 Methodological aspects
X-ray absorption spectra of a given element are commonly divided into two different regions, the pre-edge and edge regions called XANES and the post-edge region, called EXAFS, which correspond to significantly different processes. In the edge region, low energy excited states are considered and transitions to bound states or quasi-bound states are often observed. In a simple one-electron molecular orbital (MO) picture, the authorized LUMO or partially vacant valence orbitals are probed by the photoelectron according to the dipolar transition rule. Quadrupolar transition or phonon coupling can also contribute to the edge as observed for several transition metals. Within the one-electron picture, both absorption coefficient μ and l-projected density of states (DOS) ρ have smooth atomic backgrounds modulated by the oscillating function χ [8]. Transitions to bound or quasi-bound states resulting from mixing with continuum states occur below or around the vacuum level. Above the continuum threshold, in the EXAFS regime, the final one-electron state belongs to the continuum and the spectrum is dominated by constructive or destructive interferences contained in χ. XANES has long been used in a phenomenological approach as a fingerprint of the absorbing atom coordination geometry and electronic state. Because at low kinetic energy the photoelectron mean free path increases dramatically, the shape components of XANES, occurring mostly in L and M edges for actinides (K edges are located too high in energy to be measurable), can be viewed as an extension of the EXAFS energy region, given that high-order multiple scattering paths are dominant. Many codes have aimed at simulating and better understanding the information included in the edge features. Depending on the relative proportion of delocalization in the valence states or electronic correlation within the final state, so-called multiple scattering or multiplet approaches have been developed [9]. In all cases, calculations need a starting model for the structure and the electronic configuration of the compound studied. In our approach, we combine theoretical chemistry with XANES simulations in order to better reproduce and interpret experimental data.
For that purpose, we focus, in this paper, on a series of four U(VI) systems with different coordination polyhedra and electronic states. The four systems are schematically presented in Fig. 1. Two compounds of this series contain the linear transdioxo unit (UO22+): uranyl nitrate UO2(NO3)2·6H2O and uranyl diiodide complex UO2I2(py)3. The two other compounds do not contain the transdioxo unit: perovskite Ba2ZnUO6 and an organometallic compound [((ArO)3tacn)U(NSi(CH3)3)] ((ArO)3tacn = 1,4,7-tris(3,5-di-tert-butyl-2-hydroxybenzyl)-1,4,7-triazacyclononane) that is assumed to be isostructural with the U(V) equivalent.

Schematic representations of the following uranium(VI) systems: UO2(NO3)2·6H2O (top left), UO2I2(py)3 (top right), Ba2ZnUO6 (bottom left) and [((ArO)3tacn)U(V)(NSi(CH3)3)] (bottom right). Uranium atoms are in black and oxygen atoms in red.
2.1 Experimental details
Experimental details are fully described in the corresponding references and only guidelines are given in this section.
The uranium molecules discussed in the text are the following: (i) UO2(NO3)2·6H2O: in this molecular compound, the uranyl group (UO22+) is surrounded in the equatorial plane by a near-planar oxygen hexagon of four oxygen atoms from two non-equivalent bidentate nitrate groups and two equivalent water oxygens [10]. (ii) UO2I2(py)3 has been synthesized and characterized by X-ray diffraction by Berthet et al. [11]. The uranium atom is found in the classical pentagonal bipyramidal configuration with the linear UO2 fragment perpendicular to the equatorial plan defined by the three nitrogen atoms of the pyridine ligands and two non-adjacent iodide groups. (iii) Ba2ZnUO6 is the only solid-state compound of this work. The uranium atom sits in the centre of an oxygen octahedron, the space group being Fm3m [12]. For the preparation of the perovskite see also Ref. [13]. (iv) The organometallic compound studied in this work, [((ArO)3tacn)U(VI)(NSi(CH3)3)]+, has been synthesized by Castro-Rodriguez et al. [14]. Its crystal structure is still unknown, however, this molecule is the product of -oxidation of [((ArO)3tacn)U(V)(NSi(CH3)3)]. It is reasonable to assume that the uranium centre is only oxidized by one electron and that U(VI) should be isostructural to U(V). Then, the structure of the U(V) compound will be used for theoretical calculations.
Uranium L3 and M5 edges data were acquired at the D44 experimental station of DCI ring of the Laboratoire pour l'Utilisation du Rayonnement Electromagnétique (LURE, Orsay, France) for UO2(NO3)2·6H2O and Ba2ZnUO6 [13]; at BM20 of the European Synchrotron Radiation Facility (ESRF, Grenoble, France) for UO2I2(py)3; at BL11-2 at Stanford Synchrotron Radiation Laboratory (SSRL, Stanford, USA) for [((ArO)3tacn)U(VI)(NSi(CH3)3)]+ [3]. XANES spectra of oxygen K edge were recorded at the 11.0.2 beamline of the Advanced Light Source (ALS, Lawrence Berkeley National Laboratory, U.S.A), particularly relevant for radioactive materials and soft X-ray experiments [15].
2.2 XANES simulations
XANES calculations presented in this paper are based on the FEFF8.2 code using a self-consistent real-space Green's function formalism and FDMNES code using a full potential description of the cluster. Both codes are well described in the literature and the reader may report to corresponding articles [8,16]. For FDMNES code, some of the absorption spectra were simulated using the multiple scattering theory or the finite-difference method and relativistic calculations as noted in the text [16]. The two programs allow to calculate the signal for different polarizations, as well as the density of state (DOS) for each atom. After a first calculation, the spectra are convoluted with a Lorentzian in order to take into account the core-hole lifetime. However, some results are presented before convolution for a better understanding. In order to reproduce and interpret experimental data, important input parameters for XANES codes are the atomic positions and the electronic configuration of the system. They may be provided by other experimental techniques, such as X-ray or neutron diffraction, or theoretical chemistry such as molecular dynamics or quantum chemical calculations.
2.3 Molecular dynamics calculations
Molecular dynamics simulations have been performed with the AMBER 6.0 package [17,18], using the following representation of the potential energy:
UO22+ parameters have been previously adjusted to reproduce its hydration coordination sphere and ΔΔG differences relative to spherical +2 cations [19–23]. For the molecular dynamics simulations used in this study, the uranyl cation was immersed at the centre of a cubic (37 Å3) box containing around 1800 explicit TIP3P water molecules, with periodic boundary conditions. After a 1000-step geometry optimization, systems were equilibrated for 20 ps (picoseconds) and a 700 ps molecular dynamics simulation at 300 K was achieved for data acquisition. These simulations have been performed using a 0.001 ps time step, with a 15 Å cut-off and applying the Particle Mesh Ewald algorithm [24]. Two different structures have been used for the representation of UO22+ in aqueous solution. The first set of simulations describes UO22+ parameters without constrain, allowing all atoms to move. The second set uses the same parameters, with a frozen [UO2O5] cluster maintaining the cation and the five oxygen atoms of its first hydration sphere in the geometry determined in previous EXAFS study [3].
2.4 Electronic structure calculations
Electronic population calculations using quantum chemistry were performed on the molecular compounds in their ground state in order to (i) get a detailed electronic structure of the compounds and to help the interpretation of the XANES spectra; (ii) improve the XANES simulation with FDMNES code using calculated electronic population as an input in the simulation. As a first approximation, calculations were performed for the molecules in their electronic ground state, no core hole was taken into account. The perovskite system is periodic and cannot be handled with the same calculation methods as the ones which have been used for the molecular compounds and its electronic structure has not been determined through quantum chemistry calculations in the present study.
Electronic populations were obtained from a Mulliken population analysis derived from Density Functional Theory (DFT) calculations. DFT calculations were performed using the Amsterdam Density Functional (ADF) program package [25]. Relativistic effects were considered through the zeroth-order regular approximation (ZORA) [26]. Spin–orbit effects were not taken into account. Uncontracted triple-ζ Slater type orbitals valence orbitals with one set of polarization functions were used for all atoms. The frozen-core approximation was used where the core density was obtained from four-component Dirac–Slater calculations on all the atoms and kept frozen during molecular calculations. The density functional consists of a local density part using the parametrization of Vosko, Wilk, and Nusair and exchange-correlation gradient corrected parts of Becke (BP86). Additional DFT calculations were done using the Gaussian 03 [27] program package in order to perform a Natural Population Analysis (NPA) to compare with Mulliken Charges. Stuttgart relativistic effective core potentials were used to describe uranium and a 6-31+G∗ basis set was used for other atoms. The B3LYP functional was employed.
3 Understanding and simulating actinide XANES in molecular species
3.1 L3 edges
As mentioned in Section 1 of this article, L3 edges, formally assigned to the electronic transition 2p5 → 6dn+1 in the dipolar transition, are mostly sensitive to shape resonances and therefore to the geometry of the coordination polyhedron. In the following of this paragraph we discuss some examples of the structural sensitivity of the actinide L3 XANES spectra.
In order to discuss the influence of the uranium polyhedron on L3 edge XANES features a detailed comparison of the edge shape of the four structurally distinct U(VI) systems mentioned in Section 2.1 is presented. The four experimental spectra are shown in Fig. 2a and reflect considerable variations in width, relative amplitude and energy position of the white line peaks. XANES calculations have been performed with FDMNES code, using the multiple scattering theory. Cluster structures were provided by X-ray or neutron diffraction (see Table 1) and atoms of the cluster were not charged. The calculation only poorly reproduces the edge energy position. Therefore, the later have been ignored and all calculated spectra have been shifted in energy with respect to the absorption inflexion point of the experimental ones. Shapes of the four spectra are well reproduced by XANES simulations: intensities and positions of the features are quite satisfactory (Fig. 2a).
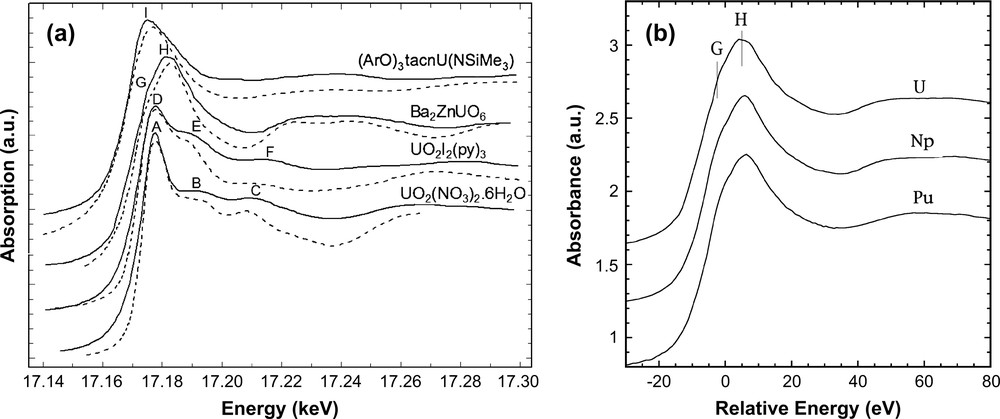
(a) U L3 edge normalized XANES spectra obtained from a series of U(VI) compounds. Experimental spectra: full line; calculated (FDMNES): dotted line. (b) U, Np and Pu L3 edge XANES in a relative energy scale of isostructural actinide(VI) perovskite compounds.
Selected bond distances in Å, obtained by X-ray or neutron diffraction, for uranium compounds under investigation in this paper
| UO2(NO3)2·6H2O neutron diff. [13] | UO2I2(py)3 X-ray diff. [11] | Ba2ZnUO6 neutron diff. [12] | ((ArO)3tacn)U(V)(NSi(CH3)3) X-ray diff. [14] |
| 2 UO at 1.75 | 2 UO at 1.75 | 6 U–O at 2.01 | 1 U–N at 1.99 |
| 2 U–O at 2.40 | 3 U–N at 2.54 | 3 U–O at 2.20 | |
| 4 U–O at 2.52 | 2 U–I at 3.10 | 3 U–N at 2.72 |
For the simulation of UO2I2(py)3, the uranium L3 edge XANES spectrum is obtained with the structural parameters given by X-ray diffraction and is shown in Table 1 exhibits a white line with two multiple scattering features too close to each other. Analyzing the EXAFS signal allows one to extract the following average distances: 1.80 Å for UO, 2.40 Å for U–N Å and 3.10 Å for U–I. XANES calculations performed with these corrected distances give a good simulation of the experimental spectrum (Fig. 2a). At this point of our study, we do not explain this discrepancy between X-ray diffraction and EXAFS distances. A slight modification of the structure upon X-ray-diffraction and EXAFS data collection might be possible, due to the high sensitivity of UO2I2(py)3 to the air.
UO2(NO3)2·6H2O and UO2I2(py)3 XANES spectra exhibit similar features: one intense white line (A/D), one feature (B/E) known to be due to resonant scattering along the linear transdioxo unit and another feature at higher energy (C/F). For uranyl nitrate, the theoretical spectrum polarized along OUO (Fig. 3) exhibits one peak at the energy of the white line and a feature at higher energy corresponding to shoulder (B), whereas the calculated spectrum polarized in the equatorial plan shows a contribution to the white line and to shoulder (C). Therefore, calculation of the polarized XANES signal demonstrates that feature (B) is assigned to the presence of the ‘yl’ oxygens whereas feature (C) originates from atoms in the equatorial plan. The same type of polarized calculations have been performed for UO2I2(py)3 and lead to the same conclusion. For this system, the XANES feature labelled (E) originates from the occurrence of the ‘yl’ oxygens and (F) is mainly due to the nitrogen atoms of the pyridine ring, located in the equatorial plan. Despite these similarities, some differences arise from the comparison between L3 edge XANES spectra of the two uranyl compounds. In the spectrum of UO2(NO3)2·6H2O, the second peak (B) and third peak (C) are found ≈15 eV and ≈32 eV above the white line, respectively. Instead, scattering peaks (E) and (F) are separated by ≈9 eV and ≈35 eV from the white line in UO2I2(py)3. To a first approximation, the energy difference between the threshold and a scattering resonance is proportional to the inverse of the interatomic distance. Therefore, a larger UO distance is expected in UO2I2(py)3 than in uranyl nitrate. This is confirmed by the EXAFS data analysis but contradicts the X-ray diffraction data. Further measurements on this compound are going to be performed.

Experimental and calculated (FDMNES) U L3 edge XANES spectra of UO2(NO3)2·6H2O (top). Calculations in polarized mode, before convolution by the core hole (bottom).
The absence of any feature similar to (B/E) in both experimental spectra of Ba2ZnUO6 and [((ArO)3tacn)U(VI)(NSi(CH3)3)]+ is consistent with the absence of any uranyl unit in these compounds. The XANES spectrum of Ba2ZnUO6 exhibits a broad white line (H) and a shoulder (G) at lower energy. The experimental XANES spectra of isostructural Ba2ZnNpO6 and Ba2ZnPuO6 all exhibit the same features (Fig. 2b). In a simple molecular orbital picture, the occurrence of (G) in the U L3 edge spectrum of Ba2ZnUO6 can be explained by the atomic orbital diagram of uranium 6d orbitals in the Oh symmetry. The perovskite having octahedral UO6 units, the shoulder and the white line can be attributed to the electron transitions from 2p3/2 states to split 6d states, i.e., t2g (dxy, dxz and dyz) and . This is confirmed by plotting the DOS of the 6d orbitals obtained with FDMNES code and is shown in Fig. 4.
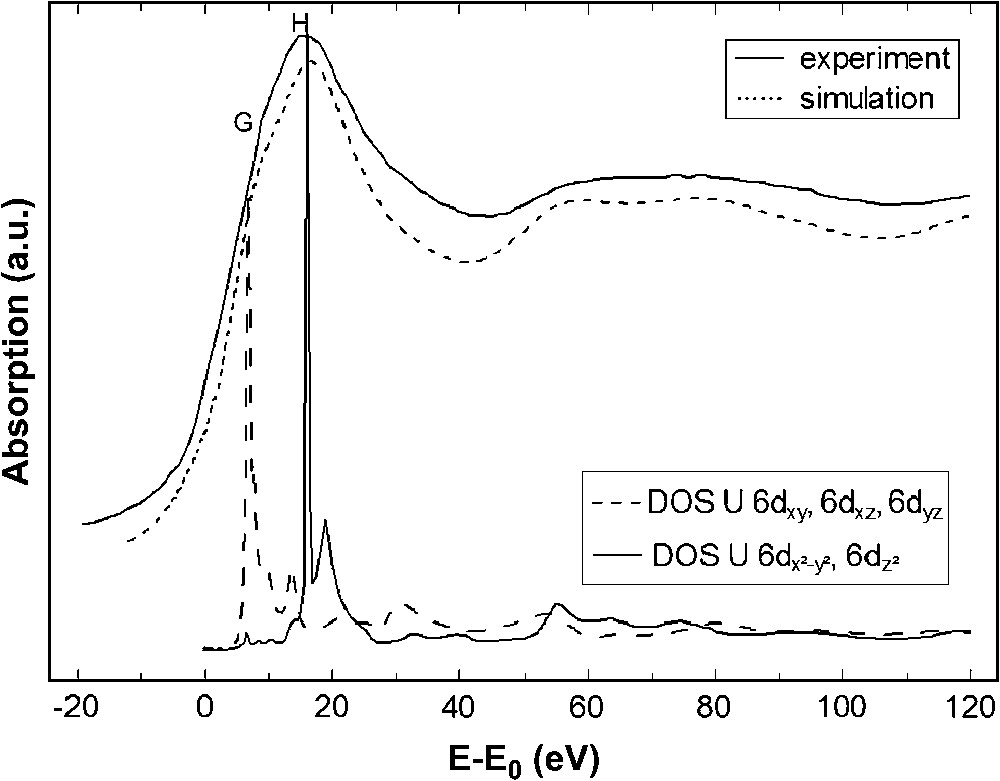
Experimental and calculated U L3 edge XANES spectra of Ba2ZnUO6 (top). Density of states for the uranium 6d orbitals (bottom).
For the above simulations, all XANES calculations have been performed using the default electronic configuration with neutral atoms, although we can safely assume that the atoms are partially charged, in all of the four compounds. Nonetheless, the theoretical XANES spectra obtained with neutral atoms reproduce quite well the experimental ones (Fig. 2a). XANES calculations with atomic charges obtained by quantum chemistry (Tables 2 and 3) have been performed but did not show significant changes on the edge shape or multiple scattering resonance energy. We can therefore conclude that in the case of actinide elements, the L3 edge shape, provides a useful fingerprint of the cation polyhedron but is very little sensitive to the electronic structure.
Mulliken populations for UO2(NO3)2·6H2O valence s, p, d, f shells
| Atom | Charge | s | p | d | f |
| U | +2.1 | 0.1 | 5.7 | 1.5 | 2.7 |
| Oyl | −0.6 | 2.0 | 4.6 | 0.0 | |
| OUN | −0.6 | 1.9 | 4.6 | 0.1 | |
| ON | −0.4 | 1.9 | 4.4 | 0.1 | |
| N | +1.0 | 1.0 | 2.7 | 0.3 | |
| −0.5 | 1.8 | 4.6 | 0.1 | ||
| H | +0.3 | 0.6 | 0.1 |
Mulliken populations for UO2I2(py)3 valence s, p, d, f shells
| Atom | Charge | s | p | d | f |
| U | +1.8 | 0.2 | 5.8 | 1.6 | 2.7 |
| O | −0.7 | 2.0 | 4.6 | 0.1 | |
| N | −0.5 | 1.6 | 3.8 | 0.1 | |
| I | −0.4 | 1.9 | 5.4 | 0.0 |
Despite the lack of sensitivity of the edge shape toward the electronic properties of the actinide central atom, the position in energy of the actinide L3 edges is sensitive to the formal oxidation state of the absorbing atom, more precisely its effective charge. Indeed, it is known that the edge energy position should increase with increasing absorber charge. This effect has been observed in some of the actinides, for example, in uranium, neptunium and plutonium. At the same time, it may also be shifted by structural effects. In this work, [((ArO)3tacn)U(VI)(NSi(CH3)3)] spectrum does not show well-defined feature except for the white line (I). However, one can note a pronounced shift in the threshold position (inflection point energy) by ≈4 eV to lower energy as compared to the uranyl nitrate. For UO2(NO3)2·6H2O, UO2I2(py)3 and [((ArO)3tacn)U(VI)(NSi(CH3)3)]+ DFT calculations have been performed in order to determine the effective charge of uranium. Mulliken analysis as well as Natural Population Analysis (NPA) has been performed and both approaches indicate a similar charge evolution for Uranium in the three compounds; Mulliken Charges are, respectively, +2.1, +1.8 and +2.0 whereas NPA charges are +2.8, +2.7 and +2.8. Obviously, the threshold energy does not increase with the uranium effective charge of the three molecular compounds. Despite the quite similar uranium charges in [((ArO)3tacn)U(VI)(NSi(CH3)3)]+, UO2(NO3)2·6H2O and UO2I2(py)3, the edge energy of [((ArO)3tacn)U(VI)(NSi(CH3)3)]+ is shifted by ≈−4 eV. In this case, the threshold energy shift may be due to structural effects or hybridization with the ligands orbitals.
Among the effects that modify the edge shape and position, structural effects are far from being minor. In the last decade, XANES has increasingly been coupled with molecular dynamics calculations [28] in order to extract valuable structural information, most often in aqueous solutions.
Figure 5 shows the XANES spectrum of uranyl(VI) cation in aqueous solution. Although both XANES and EXAFS spectra of aqueous uranyl have been reported for a long time [29–31], it can interestingly exemplify the combination of molecular dynamics with XANES (or EXAFS) to systems in solution. This methodology presents several advantages: (i) first it allows to account for solvent effects in the calculation of the atomic potentials and avoids an arbitrary truncation of the cluster when it is based on solid-state X-ray diffraction pattern. The solvent is treated explicitly up to a sphere radius of ca. 6–10 Å, depending on the size of the coordination polyhedron; (ii) it accounts for structural stereochemical relaxation, dielectric effects and solvent effects that can dramatically influence the cation coordination sphere in solution in comparison with solid-state structures; (iii) although XANES is barely not affected by statistical disorder (because it occurs at low values of wave vector k) it allows to partially account for disorder effects, such as residence time of the ligands in the cation first coordination sphere or dynamic fluctuations of the geometry of the cation coordination sphere. In the EXAFS part, these effects can mostly be accounted for by statistical and structural disorder through the Debye–Waller factor.

Calculated and experimental L3 edge XANES spectra of aqueous uranyl (0.05 M in perchloric acid). Two sets of calculations with frozen and unfrozen dioxo units have been performed based on 6 snapshots each, obtained from molecular dynamics calculations. The average of each set of calculation is compared to the experimental spectrum.
U(VI) in UO22+ exhibits a bipyramidal-type coordination sphere with two oxygen atoms at 1.76(1) Å and 5 oxygen atoms from water molecules at 2.42(2) Å [31]. Recently, we have refined the EXAFS spectrum of this species with implicit input of Debye–Waller factor through snapshots of molecular dynamics [32]. Fig. 5 compares the experimental L3 edge of [UO2(H2O)5]2+ with XANES calculations, performed with Feff82 code in self-consistent field mode, based on clusters obtained from 6 snapshots of molecular dynamics with, respectively, frozen [UO2O5] unit and unfrozen unit, as fully described in Ref. [3]. Qualitatively, all the calculations in the two series (frozen and unfrozen) reproduce the XANES features, i.e., the strong white line (A), shoulder (B) attributed to the multiple scattering contribution of the transdioxo unit and shoulder (C) (even if it is less intense in the simulation than in the experimental spectrum). Although some differences appear between each calculation corresponding to each snapshot, the broad character of the edge spectrum precludes the selection of one preferred conformation over another one by simple comparison with the experiment. The white line relative position and intensity is more sensitive to the snapshots in the unfrozen set of calculations than in the frozen one, in agreement with the strong influence of the first neighbors on the calculated potentials. Further comparison between different sets of calculations including the second water coordination shell or with and without the hydrogen atoms of the water molecules indicates that the relative shape of the calculated XANES is mainly driven by the potential calculation and little affected by either light scatters (hydrogen atoms) or second shell ligands. The two spectra obtained when averaging in each set the 6 calculations (which should represent the averaged conformation of the molecule in water) are indeed in very good agreement with the experiment.
3.2 Uranium M5 edges
M5 edges correspond to the first transition probing the 5f states in the dipolar approximation. More precisely, it corresponds to the formal 3d55/2 → 5fn+15/2 transition. Therefore, M5 edges are expected to be more sensitive to the cation electronic state than L3 edges are. In order to characterize the effect of the uranyl group (UO22+) on the M5 XANES spectra, two of the four U(VI) systems presented in Section 2.1 have been selected. One belonging to the uranyl(VI) series: UO2(NO3)2·6H2O and the perovskite Ba2ZnUO6 that does not exhibit any ‘yl’ oxygens. Moreover, electronic configurations are expected to be quite different for these two compounds since UO is supposed to be highly covalent while the perovskite is an ionic system.
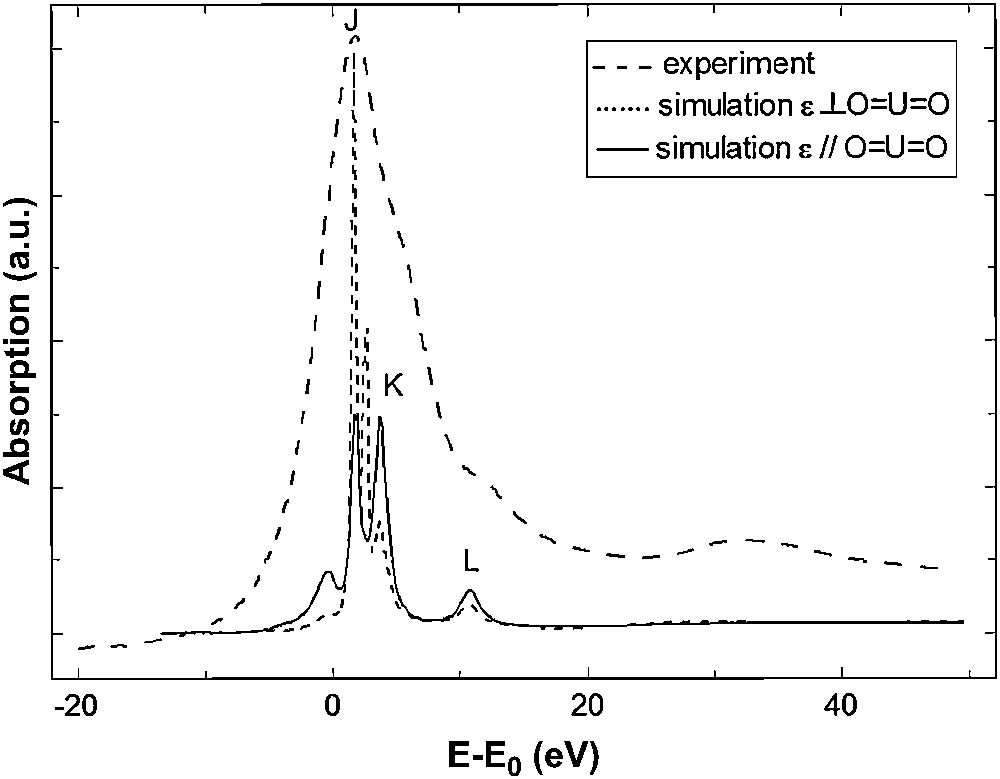
Normalized M5 edge spectra of the two selected U(VI) compounds are presented in Fig. 6, shifted in ordinate. Both absorption spectra exhibit an intense white line (J), due to the 3d → 5f transition, and weak scattering features (K) and (L) at higher energy. The main difference between the two spectra is the absence of feature (K) in the spectrum of Ba2ZnUO6. We tentatively assigned this feature to the ‘yl’ oxygens present in the uranyl nitrate and not in the perovskite. In order to confirm this assumption and compare the electronic properties of the two compounds, the spectra have been simulated with FDMNES code. At the same time, DFT calculations have been performed for the uranyl nitrate (Table 2). A Mulliken population analysis provides an effective charge of +2 for the uranium atom which is far from the formal charge +6 and is in agreement with the occurrence of a high covalency in the uranyl rod [10].
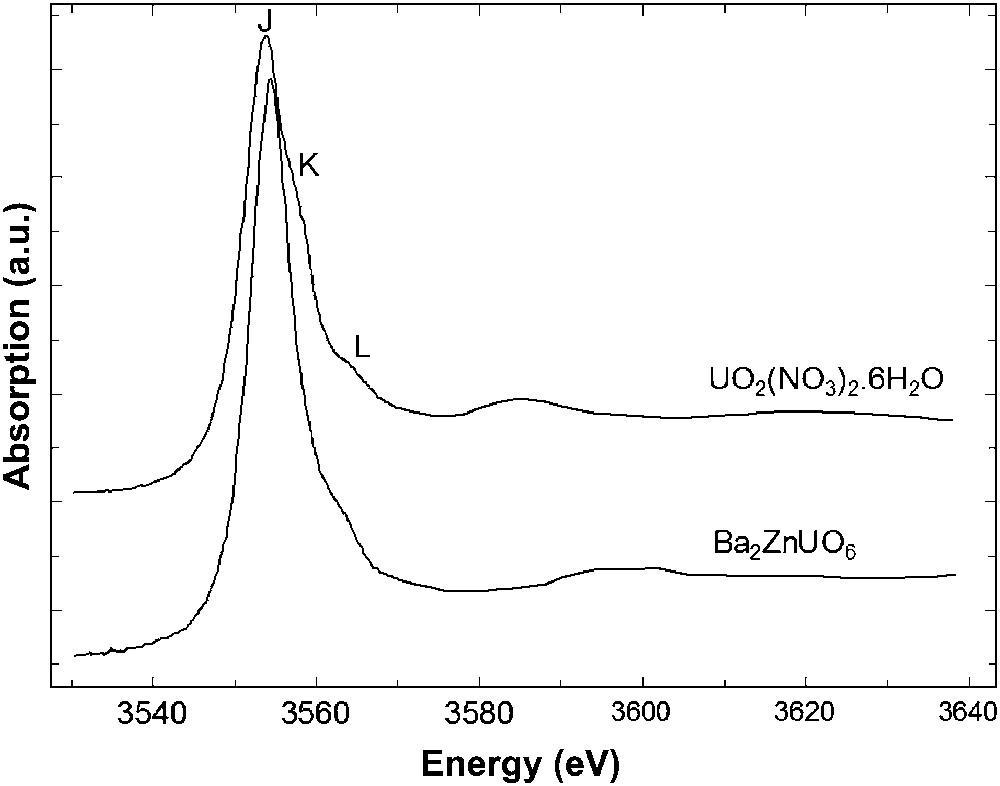
Experimental U M5 edge XANES spectra of UO2(NO3)2·6H2O and Ba2ZnUO6.
For the uranyl compound two XANES simulations, with two different electronic configurations, have been performed: one with neutral atoms (“U0”) and one with the electronic configuration obtained by DFT calculations (“U2+”). Unlike uranium L3 simulation, the calculation using the default electronic configuration “U0” is not able to reproduce the experimental spectrum. As we can see in Fig. 7, charges of each atom of the cluster have a strong impact on the uranium M5 edge XANES spectrum of UO2(NO3)2·6H2O. For the simulation with “U2+”, shoulder (K) appears and peak (L) is at the correct energy, compared to the calculation with “U0” electronic structure. This result demonstrates that the features of the U M5 edge XANES spectrum are sensitive to the effective charge of the central atom, which itself reflects the electronic structure of the compound. Furthermore, polarized calculations along the dioxo unit allow to assign feature (K) to the presence of the ‘yl’ oxygens, as for shoulder (B) at the uranium L3 edge. Fig. 8 shows the attribution of feature (K) to the ‘yl’ oxygen rod. In order to complement this analysis, the 5f density of state in the system's ground state has been provided by quantum chemistry and is plotted in Fig. 9, allowing to attribute XANES features to σ∗ or π∗ orbitals. The peaks in the 5f DOS curves, which have been widened by a Lorentzian curve, correspond to the energies of molecular orbitals with significant 5f participation. The corresponding percentage contributions of U 5f and O 2p atomic orbitals to the molecular orbitals are given in Fig. 9. Contributions of other atomic orbitals are less than 1% and can be neglected. The higher-intensity peak of 5f DOS corresponds to nearly pure 5f molecular orbitals incorporating small contributions from nitrate and water oxygen 2p orbitals. The two higher-energy features correspond to π∗ and σ∗ anti-bonding molecular orbitals formed between uranium 5f and “yl” oxygen 2p orbitals with no participation of oxygen atoms from nitrate or water molecules. A direct comparison between this 5f DOS and the experimental absorption spectrum is only qualitative and should be taken with care especially at high energy since the calculated DOS correspond to the uranium compound in its electronic ground state. However, peaks in DOS are consistent with the experimental feature intensities: a higher contribution of the uranium 5f orbital gives a more intense feature. Feature (K) and (L) can be attributed to transition toward π∗ and σ∗ anti-bonding molecular orbitals localized on the uranyl.
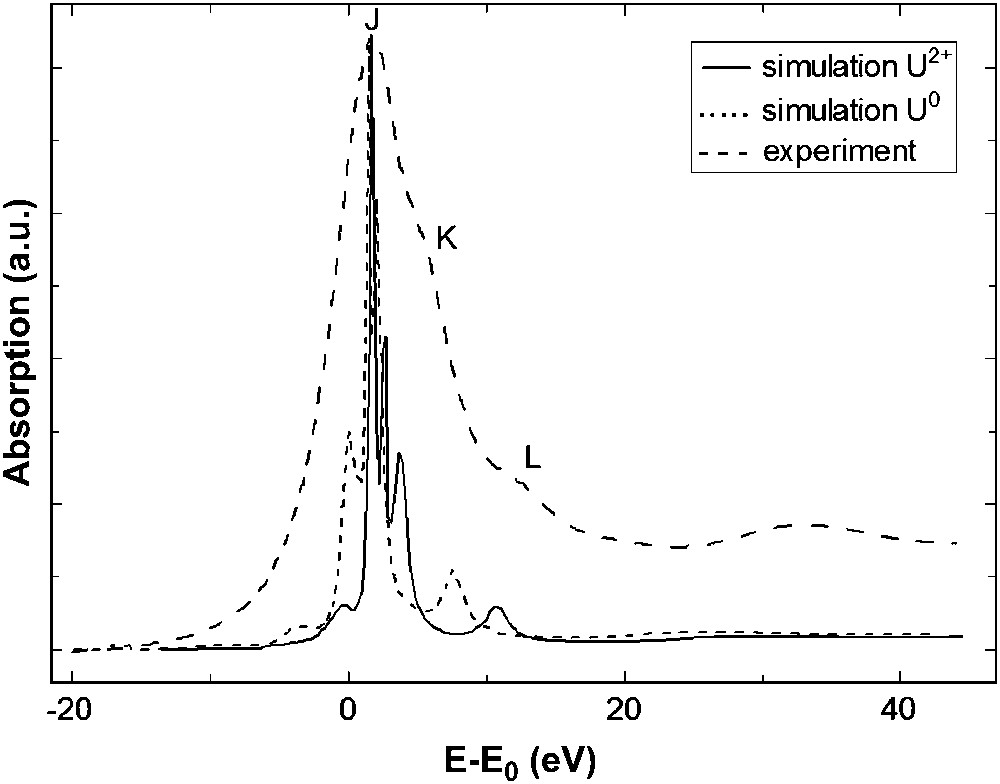
Experimental and calculated U M5 edge XANES spectra of UO2(NO3)2·6H2O with different electronic configurations. Simulations are shown before convolution.
Experimental and calculated U M5 edge XANES spectra of UO2(NO3)2·6H2O, along different polarization directions. Simulations are shown before convolution.
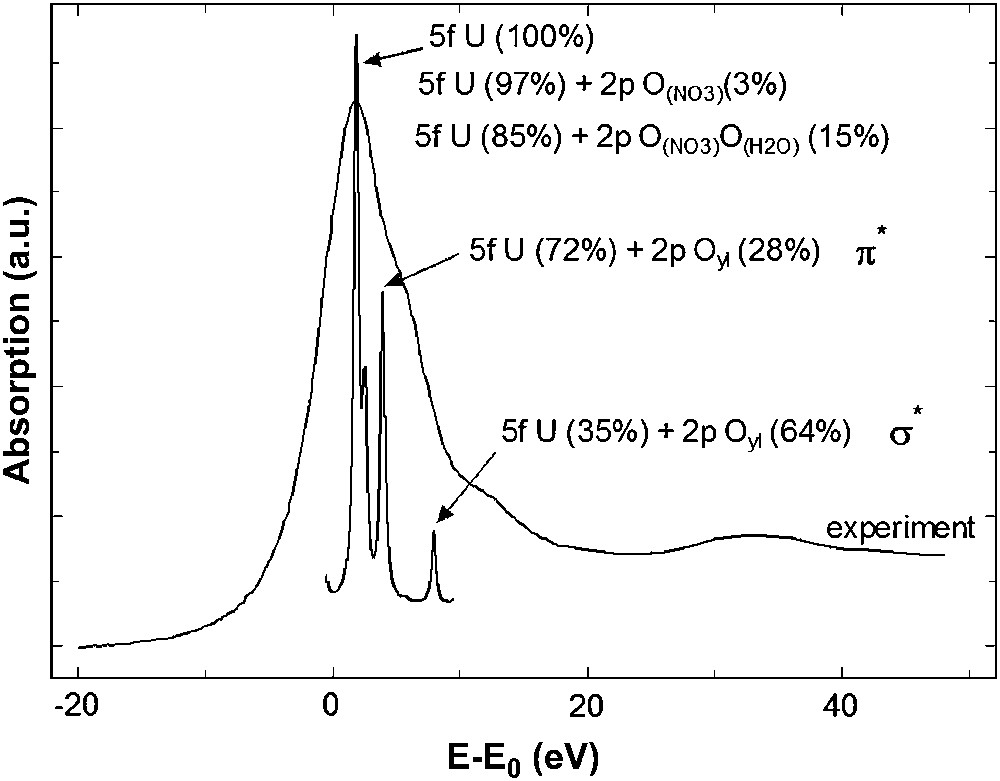
Experimental U M5 edge XANES spectrum of UO2(NO3)2·6H2O and DFT calculation of the density of state for uranium 5f atomic orbitals with orbital contributions (%) to the corresponding valence molecular orbitals.
As mentioned in the computational details section, the electronic structure of the crystalline perovskite has not been calculated yet. However, the uranium cation in Ba2ZnUO6 is supposed to be more ionic than in UO2(NO3)2·6H2O, because of its octahedral oxygen environment. Consequently, the effective charge of uranium in the perovskite is assumed to be higher than +2 and we set it arbitrarily to +3. In Fig. 10, FDMNES XANES simulations are presented for the neutral electronic configuration and for the following one: U3+ O− Ba+ Zn+. As for the uranyl case, all the features are poorly reproduced when the calculation is performed with “U0”. In particular, there is no shoulder above the white line. On the other hand, the calculation with “U3+” exhibits two main peaks, the more intense corresponding to the white line (J). Although the second peak is at lower energy than peak (L) in the experimental spectrum, the calculation qualitatively reproduces the experimental data. A better agreement is expected when charges from quantum chemical calculations are available. In order to complement our understanding of the actinide–ligand bond, XANES measurements have been performed at the ligand K edge and are discussed in Section 3.3.
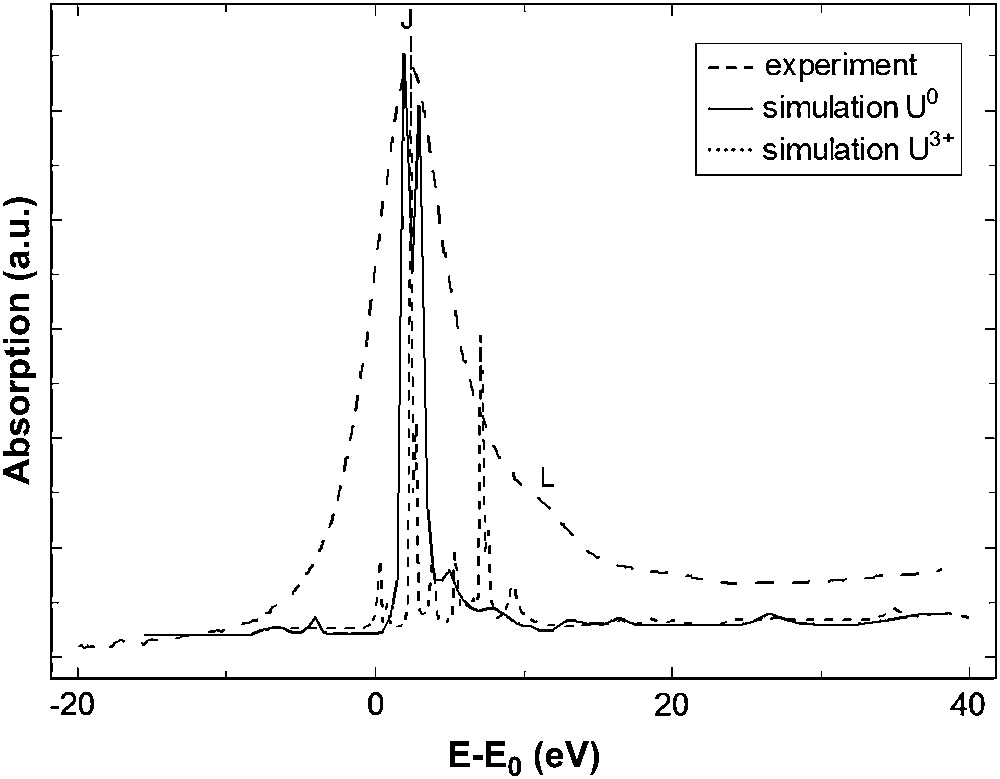
Experimental and calculated U M5 edge XANES spectra of Ba2ZnUO6 with different electronic configurations. Simulations are shown before convolution.
These examples illustrate the good sensitivity of the uranium M5 edge, the electronic structure of the atoms as well as the fact that weak multiple scattering features located at higher energy than the white line are a fingerprint of the actinide polyhedron.
3.3 Ligand K edge
Oxygen K edge is an excellent probe of the covalency of the actinide–oxygen bond, since the actinide 5f/6d and O 2p orbitals form an anti-bonding orbital [2]. Furthermore, those edges are very sensitive to the oxygen 2p states because of the very small core-hole width of oxygen (0.2 eV). However, an additional difficulty comes from the multiplicity of the type of oxygen atoms in many compounds (and in particular in UO2(NO3)2·6H2O). The resulting XANES spectrum is therefore an average of the various oxygen components and its interpretation becomes intricate. To overcome this difficulty, a molecular compound with only one type of oxygen atom has been selected: UO2I2(py)3. The oxygen K edge XANES spectrum cannot be adequately modelled through the full multiple scattering (FMS) approach, but the finite-difference method (FDM) combined with quantum chemical population analysis gives satisfactory results, as shown in Fig. 11.
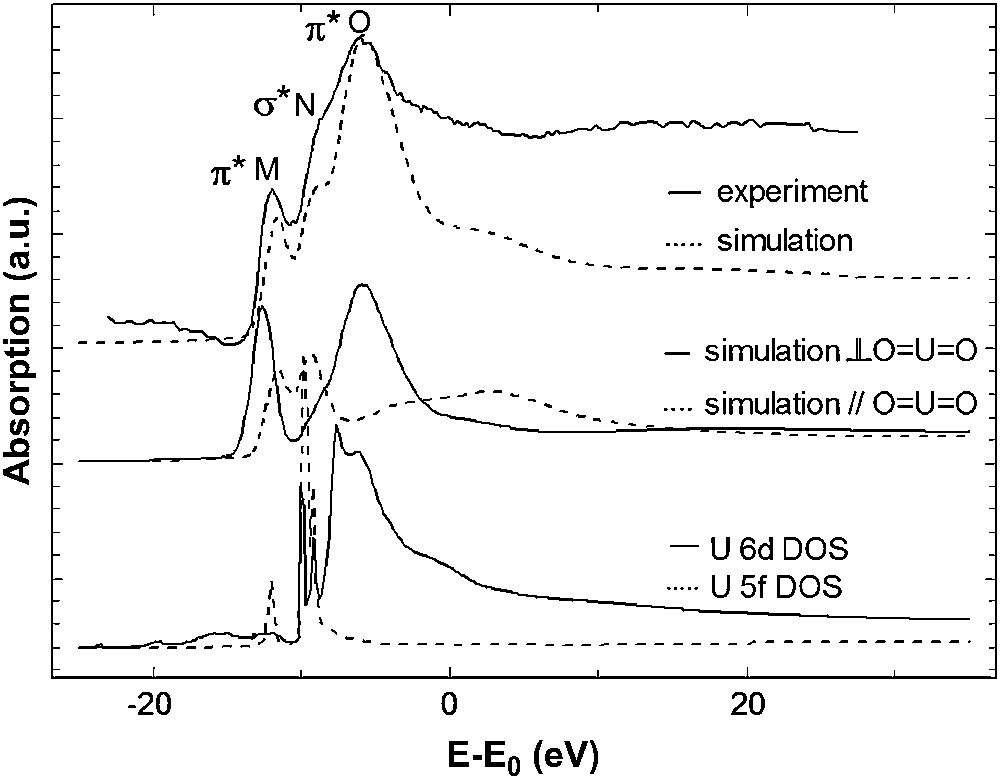
Experimental and calculated O K edge XANES spectra of UO2I2(py)3 (top). Polarized calculations before convolution (middle) and uranium 6d and 5f densities of states (bottom).
The spectrum exhibits a pre-peak (M) then a shoulder (N) and the white line (O) at higher energy. The experimental spectrum has been well reproduced using the electronic configuration obtained by the quantum chemical calculations reported in Table 3. The polarized simulations provide the XANES signal along two directions: one parallel to the OUO rod and the other one perpendicular to it. In Fig. 11, one can see that the shoulder (N) is polarized parallel to the OUO axis (i.e., z axis) so it can be attributed to transition toward an orbital involving the 2pz oxygen orbitals, i.e., a σ∗ molecular orbital. On the other hand, the first pre-peak (M) and the white line (O) are polarized perpendicular to OUO and arise from transition toward π∗ orbitals. Consequently, the different XANES features have been attributed to transitions toward π∗ or σ∗ orbital, by polarizing the theoretical spectrum. On the basis of these polarized calculations, it is not possible to go further in the interpretation, as we cannot distinguish whether peaks arise from an O 2p–U 6d or an O 2p–U 5f hybridization. In order to identify the origin of these features the projected density of states for the uranium atom have also been calculated with FDMNES (Fig. 11). The participations of uranium 5f orbital to the molecular orbitals occur at the energies of peaks (M) and (N) and the participations of uranium 6d orbital corresponds to the features (N) and (O). These results are consistent with the schematic molecular orbital diagram of UO22+ obtained by DFT calculation and plotted in Fig. 11. In this diagram, only the transitions to levels corresponding to uranium 7s, 6d and 5f orbitals hybridized with oxygen 2p orbital are authorized in oxygen K edge absorption. The order of the empty anti-bonding valence orbitals is established as πu∗ (5fπ) < σg∗(6dσ) < σu∗(5fσ) < πg∗(6dπ) and is the same as the one found by Denning et al. [2] with the presence of a 1s core hole (Fig. 12). Transition to 5fσ and 6dσ is expected to be polarized parallel to OUO and that to 5fπ and 6dπ perpendicular to this direction. To interpret the oxygen K edge XANES spectra, it is assumed that the intensities depend on the square of the oxygen 2p contribution of the molecular orbital to which transitions take place. By comparing the intensities of oxygen K edge XANES features for different uranium compounds one can compare the contribution of oxygen 2p orbital to the molecular orbitals of these compounds.
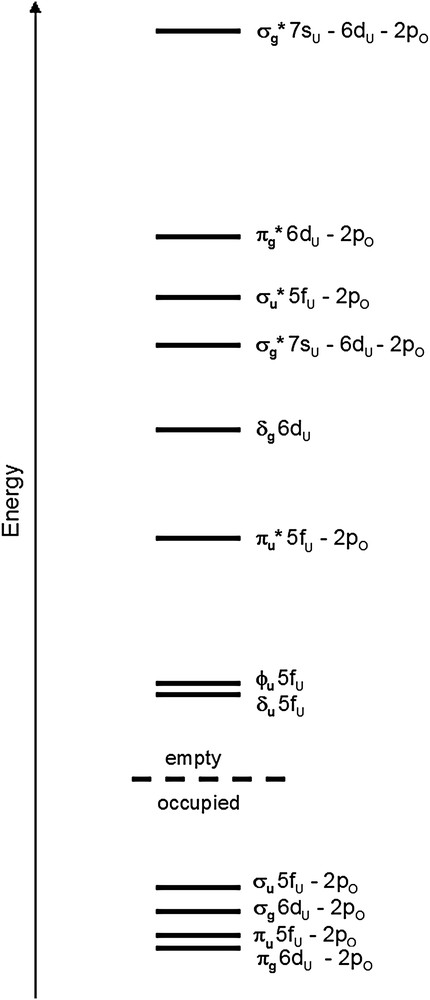
Schematic representation of the order of the valence molecular orbitals for the uranyl ion.
These results show the relevance of ligand K edge study as a complementary tool because of its sensitivity to the symmetry of the ligand environment as well as electronic structure of the system.
4 Conclusion
The present work shows that multiple edge approach for XANES spectroscopy is very promising for electronic and structure studies of uranium and transuranium actinide compounds. The uranium XANES analyses lead to characterize the absorbing atom coordination sphere and its effective charge, by coupling the simulation of the experimental spectroscopic data with theoretical chemistry. The shape of the threshold in L3 edge spectra is essentially due to local structure effects. In case of compounds with not well-defined structure, coupling L3 edge XANES spectroscopy with molecular dynamics calculations is a relevant method to determine structural parameters or implement them. However, the L3 edge shape is not well enough resolved to extract electronic information. On the other hand, the M5 edge provides a better resolution (∼4 eV for uranium M5 core hole) and then is much more sensitive to the electronic structure. The work presented in this paper has proven that M5 edge XANES simulation combined with electronic structure calculation by quantum chemistry leads to extract quantitative information such as the evolution of the effective charge of the absorber in a series of compounds. Furthermore, theoretical analysis of low energy ligand K edge XANES spectroscopy is feasible and gives complementary information on the actinide–ligand bond. Overall, to compare experimental and theoretical data, it is essential to validate and improve the models used for the different calculations. In the future, analyses on uranium N4,5 XANES spectra will be performed. They are featureless but present some differences in branching ratio, reflecting various tuning of the spin–orbit coupling.
Acknowledgements
Support for this research was provided by the ACTINET program (JRP-02-19), a European network for actinide sciences, “Groupement de recherche”, Paris, France, and CEA/DEN/DSOE/RB. The authors would like to thank Y. Joly for his help and advice in the use of FDMNES and J.J. Rehr for the use of Feff82. XAS measurements were carried out at ESRF, a European user facility, at Stanford Synchrotron Radiation Laboratory, a national user facility operated by Stanford University on behalf of the U.S. Department of Energy, Office of Basic Energy Sciences and at the Advanced Light Source supported by the Office of Science, Office of Basic Energy Sciences, of the U.S. Department of Energy under Contract No. DE-AC02-05CH11231. The authors would also like to thank A. Scheinost, (FZR, ROBL) and J. Bargar, J. Rogers (SSRL/11-2) for their help.