

1 Introduction
High-level, long-lived (HLLL) nuclear waste represents a small volume fraction (∼1%) of the total nuclear waste, but concentrates the major part of its activity. Among this waste, one finds fission products (such as 137Cs and 90Sr), actinides, and activation products. Due to their high radioactivity level, they need to be kept away from the biosphere while their activity decreases, and due to their long life, this confinement must last over hundreds of thousands of years. The general strategy to ensure the confinement of these wastes is based on a multibarrier concept, each barrier contributing to the retention of the waste (mainly charged particles), thereby preventing its release.
At present, HLLL is first vitrified in a borosilicate matrix, and embedded in a steel container. There is now an international consensus on the relevance (and feasibility) of completing this packaging by storing these parcels in deep geological disposal. If chosen appropriately, the geological medium itself participates in the confinement of waste by acting as the main barrier on the long term. In this context, a number of studies have been undertaken in many countries producing nuclear waste [1]. Since its creation in 1991, the “Agence Nationale pour la gestion des Déchets RAdioatifs” (ANDRA) is in charge of the management of all French nuclear waste, and it supervises a research program aiming at providing the necessary data for assessing the feasibility of a geological storage of HLLL, developing a repository concept, and finally the realization of such a repository. ANDRA has its counterparts in other countries (NAGRA in Switzerland, ONDRAF in Belgium, SKB in Sweden…).
Among the various possible host rocks clay formations have attracted a particular attention. Their retention properties, related to their very low permeability, their structural charge and their chemical reactivity (possible binding of species on the mineral surfaces) have made them good candidates for the geological disposal of nuclear waste. In order to assess the safety of such a disposal, a comprehensive study of the structural properties, and most importantly, of the ionic mobility in clays is necessary. The difficulty is related to the multiscale structure of such materials, with relevant length scales ranging from 1 nm to 1 cm as far as the microscopic structure is concerned, up to the kilometer if one then includes empirical descriptions of the medium in macroscopic models to predict the evolution at the geological formation scale.
The determination of empirical parameters to characterize the medium, such as the apparent diffusion coefficient of each species, can be made experimentally. To gain insight in the microscopic mechanisms underlying ionic mobility in clays, a number of theoretical approaches have been undertaken [2]. The purpose of the present article is to review some of these approaches developed in our laboratory, focusing on their complementarity to investigate the properties of such a complex system.
A first class of models assumes the validity of macroscopic equations (e.g. Navier–Stokes for solvent flow, Poisson–Boltzmann for the ionic distributions) to describe the solvent and ions properties at the mesoscopic scale. This is justified only if the water content is high enough. Some results will be given and the range of validity will be discussed in Section 2. When the water content is low, one needs to account for the discrete nature of the solvent in order to describe correctly the structure and dynamics of water and ions in clays. This will be illustrated with molecular simulation results in Section 3. Finally, a tentative connection between an atomic description of the system and a more macroscopic one will be made in Section 4, by determining effective parameters using a mesoscopic model based on the molecular simulation results.
2 Hydrated clays
In this article, we will focus on an idealized lamellar system consisting of parallel clay layers separated by a pore containing water and counterions. Even though in real clays several porosities exist, this simple model allows to get insight into the properties of water and ions in two extreme cases: in the clay interlayer (at low hydration, with a water mono- or bilayer between the mineral surfaces) and at a mineral/solution interface (at high hydration).
2.1 Validity of macroscopic descriptions
Montmorillonite clays consist of large particles formed by stacks of negatively charged aluminosilicate layers whose charge is compensated by counterions in between them (Na+ or Ca2+ in soils). When the system is hydrated, water enters into the interlayer to solvate the counterions and as a result the spacing of adjacent clay layers increases.
At high water content, this distance becomes significantly greater than the size of solvent molecules. The description of such hydrated clays is based on macroscopic equations, such as the Navier–Stokes equation for hydrodynamics or the Poisson–Boltzmann equation for the calculation of the electrostatic properties [3,4]. These equations are valid at the pore scale, and can be used to derive transport properties at the macroscopic scale (e.g., Darcy's law for flow induced by a pressure gradient). The validity of these equations is, however, questionable if the water content is very low. Thus one of the most important questions is the determination of the range of applicability of such macroscopic descriptions. Microscopic simulations taking explicitly into account every ion and every atom have been carried for that purpose. The virtually exact results of Molecular Dynamics (MD) and Monte Carlo (MC) were then used as a benchmark to assess the validity of macroscopic descriptions.
2.2 Microscopic simulations: technical details
Since montmorillonite clays are rather heterogeneous, in terms of chemical impurities and charge distribution, an idealized composition is used: M0.75Si8(Al3.25Mg0.75)O20(OH)4, with M = Na+ or Cs+ being the counterion. A mineral layer consists of three sheets: an octahedral sheet containing the Al and Mg atoms between two tetrahedral sheets containing the Si atoms. The negative charge of the mineral arises from the substitution of AlIII by MgII. The simulation box contains two half-layers made of eight unit cells whose formula is given above, and one interlayer space with water and counterions. The atom positions are taken from X-ray data [5]. The lateral dimensions of the layer are 20.72 × 17.94 Å2, its thickness is 6.54 Å.
The water is described by the SPC/E model [6] (O–H bond 1.0 Å, angle H–O–H 109.47 Å., charges −0.848e and +0.424e for oxygen and hydrogen atoms, respectively). This water model is able to describe accurately the structure of bulk electrolyte solutions and its dielectric constant is close to the experimental value at 298 K. A similar accuracy is found for the viscosity [7] so that SPC/E is a relevant water model to study the electrostatic properties of a confined solution. SPC/E model was also demonstrated to correctly describe the thermodynamic properties of water even at high temperature [8], as well as water diffusion coefficient, at least up to 330 K [9]. The atoms of the clay layer are modelled by charged 6–12 Lennard–Jones potentials with parameters taken from Smith [10]. Long-range electrostatic interactions were computed using Ewald summation, and a cut-off of 8.9 Å was used for Lennard–Jones interactions.
MC simulations were undertaken in the (N, σzz, T) ensemble, where σzz refers to the stress perpendicular to the clay layers (1 bar) and T = 298 K. The equilibrium volume of the box (i.e. the interlayer spacing L) was first obtained by varying the number of solvent molecules N in the interlayer space. Only water-saturated states were studied, and values of N for the considered water content are given below. MD simulations in the (N, V, T) ensemble then allowed the dynamic properties of the system to be obtained.
2.3 Validity of the Poisson–Boltzmann treatment
The macroscopic model which is commonly used for the description of electrostatic properties is based on the Poisson–Boltzmann (PB) equation. The solvent is treated as a continuum characterized by its dielectric constant εr. The negative clay layers of both sides of the pore are modelled by two uniformly charged planes. The surface charge density is σ with σ = 0.0161/2e Å−2. Within this approach, the cations are considered as point-like.
Using Boltzmann statistics and Poisson equation, the concentration of cations as a function of the vertical dimension z can be calculated analytically [11], with the result:
| (1) |
| (2) |

Cation distributions for two different hydration states, corresponding to N = 100 and 33 water molecules per cation. Solid lines: Microscopic simulations, dashed lines: Poisson–Boltzmann treatment.
The main differences between simulated and analytical curves are the oscillations given by the microscopic model, which are characteristic of the discrete nature of the solvent molecules. Thus, the agreement is very good for the more hydrated state L = 52 Å, especially in the middle of the pore. Near the surface, the difference remains whatever the hydration state. This is because the hydration of the cation is neglected in the Poisson–Boltzmann treatment. In fact, Na+ ions, which are well hydrated, cannot approach the surface as closely as in the analytical model, due to the finite size of solvating water molecules. For L = 17 Å, we reach the limit of validity of the PB equation. However, the agreement is reasonably good, considering that the interlayer space contains only five layers of water.
2.4 Ion transport properties from the macroscopic models
Comparison of the results for the structural properties obtained using macroscopic equations with that of molecular modelling showed that for high enough water contents (leading to interlayer spacings ), these macroscopic models lead to fairly accurate predictions. Similar results can be obtained for structural properties of clays in equilibrium with an electrolyte reservoir, that is water and salt, instead of pure water as discussed hitherto. The presence of salt enriches the dynamic properties of clays, giving rise for example to a DC conductivity. Relying now solely on the macroscopic models, it is possible from the knowledge of the ionic profiles, to evaluate some of the ion transport properties.
The conductivity has several contributions whose order of magnitude varies with increasing concentration [12]:
| (3) |
The first term represents the intrinsic conductivity which arises from the counterions which neutralize the charge of the layers. The second term is the salt conductivity which represents the conductivity of the electrolyte which entered into the interlayer spacings and the third term is the electro-osmotic conductivity which can be calculated from a hydrodynamic approach within the framework of the Mean Spherical Approximation (MSA) [11]:
| (4) |
The MSA treatment of the specific conductivity of the salt gives χsalt by using the Fuoss–Onsager equations for the non-equilibrium pair distribution functions. We used an analytical theory that gives extended laws for the variation of transport coefficients as a function of concentration for strong and associated electrolytes [13]. In the case of bulk solutions, this theory was found to be in agreement with experimental data up to molar concentrations.
The results of a NaCl model with a mean ionic diameter d = 3.3 Å for the equivalent conductivity Λ = χsalt/cext are presented in Fig. 2. Λ starts from zero without added salt, as a consequence of electroneutrality. The counterions must remain in the vicinity of the immobile charged surfaces, and therefore cannot contribute to the DC conductivity. In the presence of an excess of added salt, it tends to a plateau value depending strongly on the interlayer spacing. Larger interlayer spacings exhibit a broad maximum at low ionic strength. The curves are close to the bulk conductivity only for large interlayer spacings and important external concentrations.
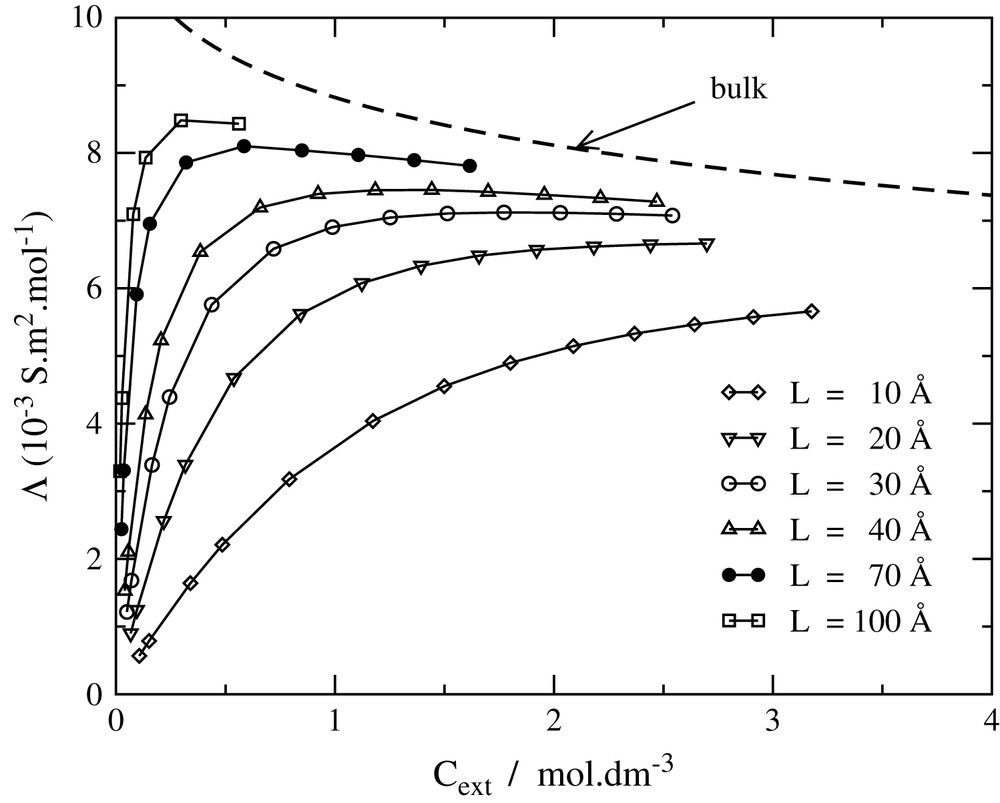
Equivalent salt conductivity Λ as a function of the external salt concentration for different interlayer distances.
It should be noted that Onsager's limiting laws are not valid for the relation between equivalent conductivity and external concentration. Indeed, because of the Donnan effect, the internal cint concentration is different from the external one. More precisely, for high surface charge F = πLLBσ/e ≥ 1 at low cext:
| (5) |
As a matter of fact, the total equivalent conductivity does not scale as at low salinities (as it does in a bulk electrolyte), but rather as cext.
3 Molecular modelling of compacted clays
In the previous section, we showed that the macroscopic models used to describe hydrated clays with or without added salt are not valid anymore when the interlayer space is too narrow, that is when the water content is too low. In Fig. 1, it can be seen that the simulated distributions of cations already show strong oscillations compared to Poisson–Boltzmann profiles because of the discrete nature of the solvent. This effect is particularly important in compacted clays. At high compaction rates, most of the porosity consists of interlayer porosity [14], in which only one to three water layers are present between the layers. The detailed study of transport properties for such systems requires a molecular modelling via Monte Carlo and molecular dynamics simulations.
3.1 Ion and water distributions
The montmorillonite of Section 2 was simulated with one and two layers of water between the layers, that is a much lower water content. For these simulations, the box contained two clay layers and thus two interlayer spaces. Such water contents correspond to N = 36 and N = 72 water molecules per interlayer, respectively, that is 6 and 12 water molecules per cation. Two different counterions were studied: Na+, a naturally occurring cation in montmorillonite, and Cs+, a potential radionuclide. A snapshot of the simulation box is given on Fig. 3. The interlayer spaces found by Monte Carlo in the (N, σzz = 1 bar, T = 298 K) ensemble for the mono- and the bilayer state were 12.3 Å and 15 Å for the sodic montmorillonite, and 12.7 Å for the monohydrated Cs-montmorillonite. The bihydrated state of Cs-montmorillonite does not exist experimentally. These results agree with RX diffraction experiments [15–17].
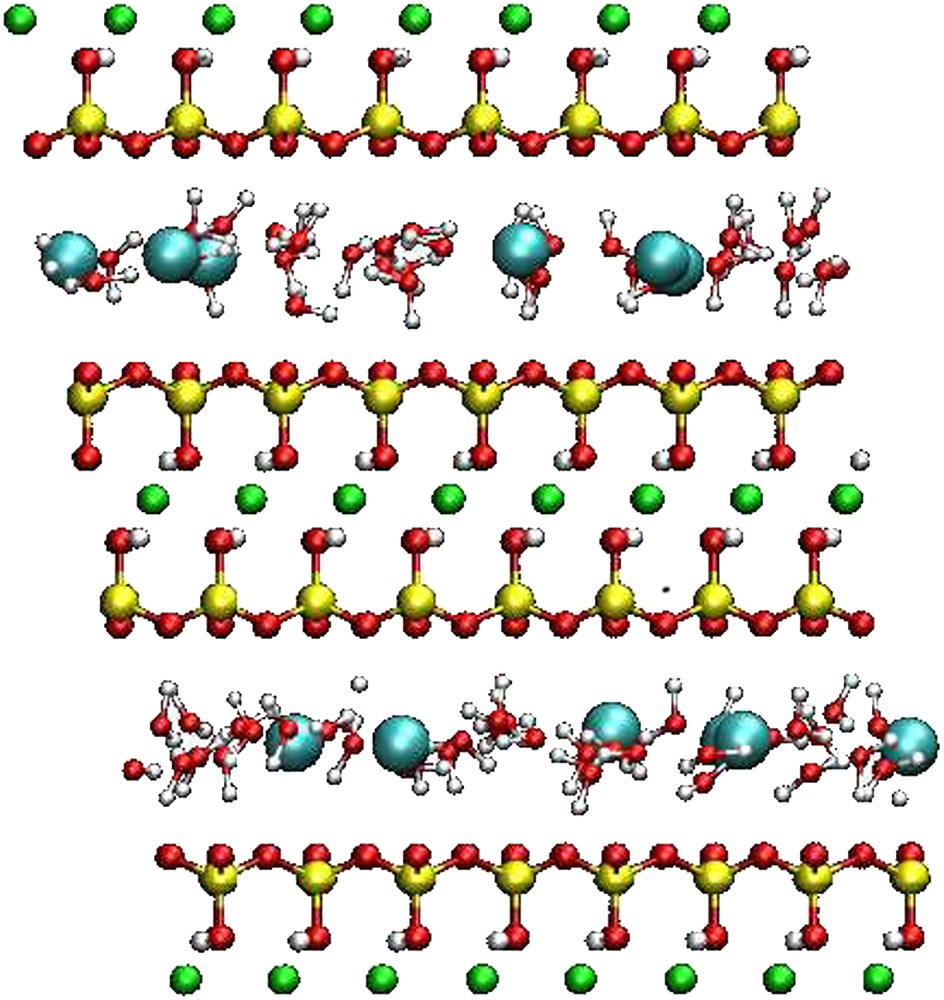
Snapshot of the simulation box for Cs-montmorillonite for the case of a water monolayer. It contains two layers (with counterions) of formula Cs6Si64(Al26 Mg6)O120(OH)24. Oxygen atoms are in red, H in white, Si in yellow, Al in green and Cs in cyan (for the interpretation of references to color in this figure legend, the reader is referred to the web version of this article).
Water distributions in the direction perpendicular to the clay surface are shown on Fig. 4 for mono- and bihydrated Na-montmorillonite. The peaks on oxygen profiles clearly show the presence of one or two layers of water in the interlayer space. The hydrogen profiles are representative of the preferential orientations of O–H towards the surface of the clay layers. Maps of hydrogen preferential positions along the clay surface (not shown) reveal that H atoms have a tendency to remain around the oxygen atoms of the mineral layers, forming hydrogen bonds with them [18,19].
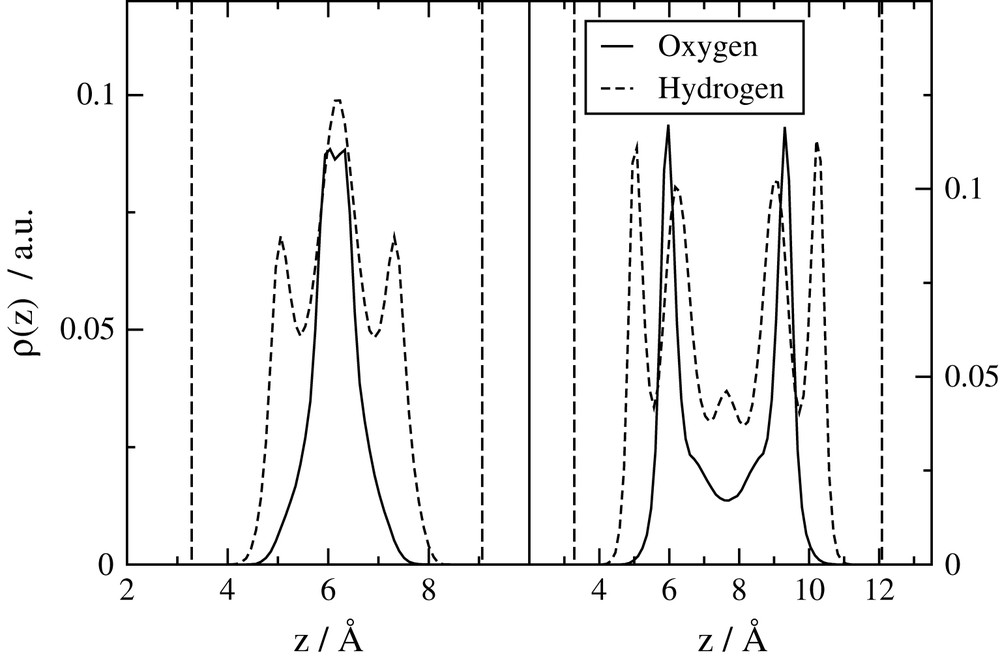
Water atoms' distributions along the direction perpendicular to the clay surfaces. Left: monohydrated Na-montmorillonite. Right: bihydrated montmorillonite. The vertical lines represent the surface of the clay layers.
Sodium and cesium cations have quite different behaviours towards clay surfaces. Na+ is well hydrated. In the bihydrated case, it stays in the middle of the interlayer space, surrounded by six water molecules, like in its first hydration shell in bulk water. On the contrary, Cs+ is not fully hydrated by the interlayer water molecules, and it remains partially coordinated to the clay surface. The Cs+ trajectories exhibit a site-to-site diffusion of the cation above surface silicon atoms. Surrounded by the three oxygen atoms linked to the silicon, Cs+ can indeed complete its solvation shell. The maps of their preferential positions along the clay surface in the monohydrated state are given in Fig. 5. They illustrate the different behaviours more precisely. The very localized Cs+ fixation sites are quite obvious. In the Na+ case, the motion is more diffuse but it is clear that contrary to Cs+ and Na+ counterions have a behaviour similar to water hydrogen atoms, preferring oxygen surface atoms to silicon and hexagonal cavity centers.

Maps of cation distributions parallel to the clay surface. The distributions are given for the elementary crystallographic cell. Left: monohydrated Na-montmorillonite. Right: monohydrated Cs-montmorillonite. The density increases with the brightness. The dark and bright circles represent surface oxygen and silicon atoms, respectively.
To conclude this structural study, the discrete structure of water is of prime importance in the low states of clay hydrations: The hydration tendencies of the various counterions lead to quite different diffusion behaviours in the interlayer.
3.2 Self-diffusion coefficients
Self-diffusion coefficients of water molecules and cations can be evaluated from trajectories, by calculating mean-square displacements parallel to clay surfaces as a function of time. The diffusion coefficient in the direction perpendicular to the clay layers is zero, since the motion is bounded, and is then not considered. Diffusion coefficients of cations in the monohydrated montmorillonite at ambient pressure and temperature were about 10−10 m2 s−1, that is to say one order of magnitude lower than in bulk water. The same order of magnitude was found for water molecules. In the bihydrated states, diffusion coefficients were only two to three times lower than in the bulk. It means that differences with the bulk quickly decrease when the number of water molecules increased. This observation supports the use of macroscopic models for hydrated clays, even for dynamic properties, as explained in Section 2. The diffusion coefficients obtained for water agree with coefficients obtained by neutron scattering [20–22]. Moreover, all the diffusion coefficients are in agreement with values obtained in previous simulations [23,24].
Simulations were performed at various temperatures to evaluate the influence of temperature on diffusion [25]. The study of the obtained trajectories shows that temperature has no effect on the specific behaviours of water, Na+ and Cs+. However, diffusion is accelerated as temperature increases. Diffusion coefficients of water are given on Fig. 6. Fitting the curves with Arrhenius laws, we find activation energies around 12–15 kJ mol−1 for the monohydrated state and 14–19 kJ mol−1 for the bihydrated state. These activation energies are close to the bulk one (18 kJ mol−1), even if the diffusion process is quite different (orientations towards the surface, two-dimensional diffusion). Neutron scattering experiments as a function of temperature are in process to test the validity of the simulation results.

Water diffusion coefficients as a function of T in the bulk and in mono- and bihydrated homoionic montmorillonites.
4 Mesoscopic modelling of compacted clays
Molecular modelling provides a detailed description of water and ion dynamics in compacted clays, but this description is restricted to both small length scales (of the order of 1 nm) and short time scales (of the order of a few nanoseconds). In order to link this microscopic information to macroscopic observables, and most importantly to the apparent diffusion coefficient of each species, several routes may be followed. The complex nature of this inhomogeneous system (from the chemical and structural point of view) makes any macroscopic description approximate. Geometrical effects are generally accounted for by a set of empirical parameters: Porosity ω, that is the fraction of the medium accessible to the diffusive species, constrictivity δ, which accounts for the closing/opening of diffusion pathways (bottlenecks), and tortuosity τ, which quantifies the length of the diffusion pathways in the medium with respect to the straight trajectory. Experimentally, one can measure independently ω and the ratio δ/τ2. In addition to geometric effects, the interactions of the diffusing particles with the mineral surfaces are accounted for in the framework of a diffusion/reaction scheme: an ion can remain temporarily trapped at the mineral surface, thereby reducing its apparent diffusion coefficient. This effect is quantified by a partitioning coefficient Kd, which is the ratio between the concentrations of bound and mobile forms of each chemical species. The apparent diffusion coefficient is determined from these parameters and the “free” diffusion coefficient D0 via the relation:
| (6) |
A diffusion/reaction scheme might seem too simple, since the interactions of diffusing ions with the surrounding medium are rather complex. However, it already captures some dynamic features induced by the interactions of the ions with the surfaces, and allows for example to make some simple predictions for the dielectric properties of clays at low water content which were shown to be consistent with experimental results [26,27]. Furthermore, it is possible to make a connection between the atomic level of modelling developed in Section 3, and the macroscopic one just described. We do not claim that the latter is rigorous, but rather that it is possible to relate it to a more microscopic description. The general coarse-graining strategy involves two steps: the first one defines a mesoscopic description, where the solvent is described by a continuum, calibrated on the molecular dynamics results, i.e. taking advantage of the microscopic insights gained from molecular modelling; the second step derives, from the mesoscopic model, the parameters defining the diffusion reaction scheme, namely a dimensionless analogue of Kd, and the kinetic rates of the exchange. These two steps are now described in more detail.
4.1 Mesoscopic description
Assuming a separation of time scales between the slow solute (ion) and fast solvent (water) dynamics, one can average over the solvent degrees of freedom, and describe the solute/solvent interaction by a single friction parameter γ (in s−1): the friction force on an ion is proportional to its velocity (Fsolv = −mγv), and the resulting diffusion coefficient is given by Einstein's relation , with the thermal velocity of the ion. The solute/surface interaction is described by an external (free energy) potential Veff, calculated by inversion of the ionic density profiles obtained by molecular dynamics simulations. One is then interested in the probability density function f(x, v, t) of finding an ion at a given position with a given velocity, whose moments in velocity space are the ionic density and fluxes:
| (7) |
| (8) |
This probability density evolves, within this simplified mesoscopic description, according to the Fokker–Planck (FP) equation [28]:
| (9) |
In this equation, the potential V can also include an additional external field (e.g. an electrical field), which is necessary to determine the mobility of the ions. Recently, a lattice method inspired by the Lattice-Boltzmann methodology was developed to solve numerically the FP equation, namely the Lattice Fokker–Planck method [29–32], which we used in this particular context of ionic mobility in compacted clays [33].
Instead of using the potential derived from MD simulations, one can use an analytical ansatz, which respects the characteristic features of the true potential (topology, barrier height, …). Though approximate, this approach allows screening efficiently the behaviour of all parameters determined below as a function of the magnitude of the interactions between the ions and the walls. The latter is quantified by the ratio Vs/kBT = βVs, where Vs is the barrier connecting two adjacent free-energy minima. The density profiles corresponding to the model potential is shown in Fig. 7. These profiles are to be compared to those obtained with the fully atomic description of Fig. 5: there is a clear room for improvement in the Na+ case, although it already reflects its more diffuse behaviour; the Cs+ case is more accurately reproduced.

Ionic density corresponding to the effective potential Veff used for the mesoscopic description. Small values of the interaction parameter βVs result in a diffuse ionic profile, similar to that of Na+ (a), whereas larger values result in sharply peaked densities, mimicking the Cs+ behaviour (b). These profiles are to be compared to those obtained with the fully atomic description of Fig. 5.
4.2 Ionic mobility and the diffusion/reaction scheme
Starting from this mesoscopic model, we can now determine the mobility of the ions interacting with the mineral surfaces. This is achieved by applying an external force on the ions Fext, in addition to the one arising from the clay layer itself. The average steady-state velocity is proportional to the applied field, the proportionality coefficient being related to the apparent mobility: vst = μapp/m × Fext. The latter is of course lower than the “free” mobility μ0 = 1/γ of the ions when no interactions with the walls are present. Within the two-state diffusion/reaction scheme, the ratio μapp/μ0 is precisely the fraction of mobile ions fm that is the ions that are not bound to the surfaces. Translating this fraction of mobile ions in terms of the partioning coefficient Kd, one gets:
| (10) |
Note that the definition of Kd is slightly different from the one given above, because no geometric effects are encompassed in the present description. In particular, this definition makes Kd dimensionless. In addition, deducing Kd from the mobility is closer to its experimental determination from diffusion experiments than to batch sorption experiments. Results for Kd as a function of the interaction parameter βVs are represented on a logarithmic scale on Fig. 8. Two regimes clearly appear: for strong interactions with the walls or low temperature, the diffusion is activated (Arrhenius law) with an activation energy which is precisely Vs, the barrier that an ion needs to overcome to move from one energy minimum to the next; for weak interactions or high temperature, no such activated diffusion is seen. These results are consistent with the trajectories observed in MD simulations for sodium (weak interaction case) and cesium (strong interaction case). From the knowledge of the amount of bound ions, it is also possible to determine the adsorption/desorption rates [33], thereby completely specifying the diffusion/reaction model.
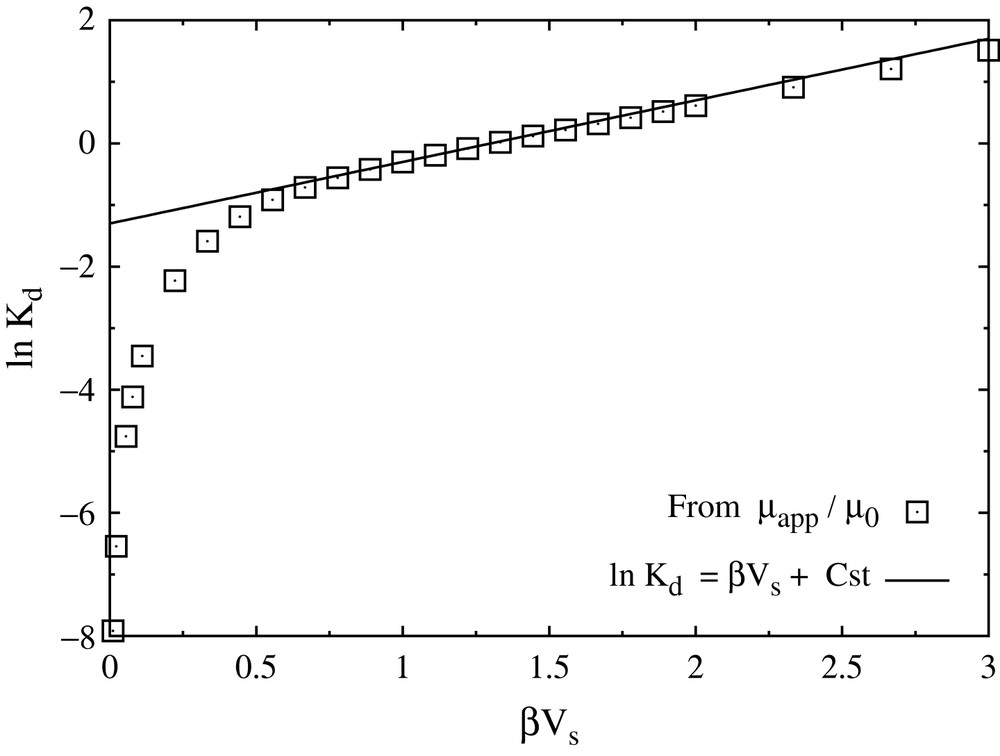
Partitioning coefficient Kd as a function of the interaction parameter β/Vs. The semi-logarithmic plot clearly reveals two regimes: for strong interactions with the walls or low temperature (right), the diffusion is activated (Arrhenius law); for weak interactions or high temperature (left), no such activated diffusion is seen. The solid line indicates the fit to an Arrhenius law with activation energy Vs.
5 Conclusion
We have reviewed some theoretical approaches developed in our research group to model the structural and dynamic properties of water and ions in clays. The various levels of descriptions used (micro-, meso- and macroscopic) are complementary. Molecular modelling provides the most accurate description, but is restricted to short length and time scales. The small size of the simulated systems also require to consider a model composition and structure which are idealized compared to the real system. Molecular modelling can be used as a benchmark to assess the range of validity of macroscopic equations (Poisson–Boltzmann and Navier–Stokes), which are of simpler use and give access to transport properties on longer timescales. It can also be used to calibrate mesoscopic models (Fokker–Planck) which provide a well-defined link between the most accurate and more approximate descriptions. Such a complementarity should of course apply to many systems other than clays, and we recommend this multiscale approach for the study of transport at solid/fluid interfaces, for which is has proved particularly powerful.
Acknowledgments
BR acknowlegdes financial support from ANDRA (“Agence Nationale pour la gestion des Déchets RAdioactifs”). Financial support of GdR PARIS (“Physico-chimie des actinides et autres radioéléments aux interfaces et en solution”) is gratefully acknowledged. LI2C is part of the SFR “Sciences chimiques pour l'analyse et la mesure de Paris-Centre”.