

1 Introduction
Nowadays corrosion scientists and engineers use a huge number of electrochemical techniques that enable them to obtain much information about reactions at the solid/liquid and the solid/gas interface. For this purpose simple DC current experiments, just a simple potential vs time measurement gives useful information on the corrosion processes. If more complete data are required, it is possible to perform potentiodynamic experiments in order to understand properly the electrochemical behaviour of the studied systems. These techniques are simple and quite cheap but they do not supply enough information to explain completely the corrosion phenomena, in particular concerning polymer/metal composites [1,2]. Improvements to the corrosion study came out after the introduction of the AC current techniques or rather electrochemical impedance spectroscopy (EIS). This very powerful tool has been largely used for the interpretation of many of corrosion processes, both on bare and coated (organic or inorganic coatings) metals [3].
All these techniques have been used for years and nowadays they are well known and widespread in every corrosion control laboratory.
In spite of this, these tools have an important limitation, i.e. the spatial resolution. Using these techniques it is possible to achieve only average data about the behaviour of an electrochemically active surface. It is very difficult to apply these techniques and the associated analysis models to small surface areas. For example it is not possible to differentiate small local anodes and cathodes on a metal surface or to detect precisely filiform corrosion phenomena. This means that it is necessary to apply different strategies in order to investigate these kinds of processes on the microscale. In the last two decades a lot of efforts have been made in order to realize new equipments for the analysis of corrosion phenomena with high spatial resolution. Scanning Kelvin Probe (SKP), Scanning Kelvin Probe Force Microscope (SKPFM), Scanning Vibrating Electrode Technique (SVET) and Localized Electrochemical Impedance Spectroscopy (LEIS) are the main results of all these attempts. LEIS is the evolution of the traditional Electrochemical Impedance Spectroscopy. With this technique it is possible to investigate the interfacial impedance properties of bare or coated metals. The influence of heterogeneities on the surface of bare metal samples can be investigated as well as the presence of blisters on coated metal samples [4,5].
SKP, SKPFM and SVET equipment enable the measurement of local potential and current difference on the microscale [6]. SKP is a non-contact and non-destructive device that allows us to measure and map the work function difference between a sample and a reference probe using the vibration condenser method. SKPFM is a very similar device. The physical working principle is the same as SKP, but the resolution is higher because the probe is much smaller than the probe used in the classical SKP [7]. Similar to the SKP, the SKPFM allows mapping of topography and Volta potential difference distribution on the investigated sample’s surface [8].
SVET is an electrolyte immersed device that enables us to spatially characterize corrosion activity measuring the potential gradients in the electrolyte (using a fine tipped vibrating microelectrode) due to the presence of anodic and cathodic areas on a metal surface.
Among these techniques, the SKP and the SVET seem to be much more appreciated by the scientific community than LEIS and SKPFM. In fact, despite LEIS being a very promising technique, several questions on the correct interpretation of the experimental data still influence the diffusion of this device. Concerning SKPFM, it has been demonstrated [7] that this technique is subject to much more artefacts than the classical SKP. At the moment, the information obtained using SVET and SKP seems to be the object of major interest. In fact, using these equipments it is possible to investigate metal samples at the micrometer scale level and to obtain very useful information on the physics and/or chemical reactions occurring on the surface [9]. With the aid of these devices it is possible to analyse a huge number of electrochemical processes and to check a lot of different materials (they are used on metals, semiconductors and polymers).
Several studies have been performed using the SKP [10–12] and SVET [13–15] technique. For example SKP has been used for studying corrosion problems under thin and ultra-thin electrolyte layers and at the buried interface organic coating/metal [7], for the detection of residual stresses and inclusions on metal surfaces [16] and for the study of thin hybrid conversion films [17].
On the other hand SVET has been used for the corrosion control and analysis of a Zn–Al alloy galvanised coatings [18], for the study of electroactive conducting polymers [19] and for the evaluation of corrosion resistance of siloxane coatings [20].
Because of the great potential and the increasing interest for high resolution techniques in corrosion studies, the theory and practice of SKP and SVET will be discussed in the next chapters. All measurements were recorded using a SVP/SKP100E (by Perkin Elmer Instruments) system at normal conditions in the Industrial Corrosion Control Laboratory at the University of Trento (Trento, Italy).
2 Scanning Kelvin Probe
2.1 The technique
The Scanning Kelvin Probe technique measures micro-galvanic activity existing close to the surface of an electrochemically active specimen in the presence of a film or a drop of electrolyte or in humid air. It is a non-contact, non-destructive device for the determination of the work function of conducting and semi-conducting materials. The scanning tip is a cylindrical Platinum wire (∅ = 500 μm). It is important to note that SKP is a unique device able to investigate corrosion processes without the employment of a conducting liquid media. As anticipated before, it works in air as well as in the presence of drops of electrolyte.
After the development of the principles of direct correlation between the measured work function and the surface condition [21], it became a tool of wide application for both surface science and industrial uses. Regarding corrosion science and electrochemistry, the technique permits the investigation of different fields such as localized corrosion phenomena, surface coating degradation, effect of microstructure and finish on corrosion initiation, the performance of corrosion inhibitors, the performance of batteries and, in general, the behaviour of materials in aggressive environments.
2.2 Theory behind the SKP technique
The orientation of the Kelvin Probe tip with respect to the sample surface approximates a parallel plate capacitor (see Fig. 2) where the capacitance C is defined by Eq. (1):
| (1) |
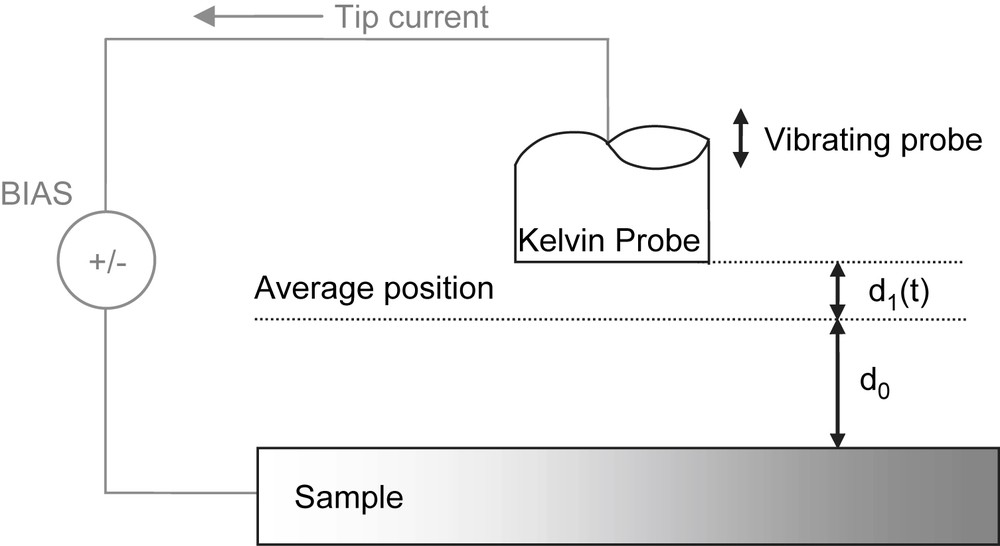
Schematic representation of the SKP vibrating system.
The position of the KP tip changes with time and hence:
| (2) |
| (3) |
Substituting Eqs. (1) and (2) in Eq. (3), the current signal i(t) can be expressed as:
| (4) |
In this case, the sum of the chemical potential and the surface potential (the work function) for the KP is much larger than for the sample. Under such circumstances, when the two are connected in an electric circuit, electrons flow from the material of lower work function to that of higher work function (high to low energy) until their respective Fermi energies equalize. The voltage required to reduce the electric field is proportional and of opposite sign to the Volta potential difference ΔKPSψ [21]. By definition then:
| (5) |
Fig. 1(a–c) illustrates three electron energy diagrams depicting two metals characterized by work function and Fermi level of (ϕ1,E1) and (ϕ2,E2), respectively. The schemes of Fig. 1 are useful to understand what happens connecting a conductive sample to the Platinum Kelvin Probe.
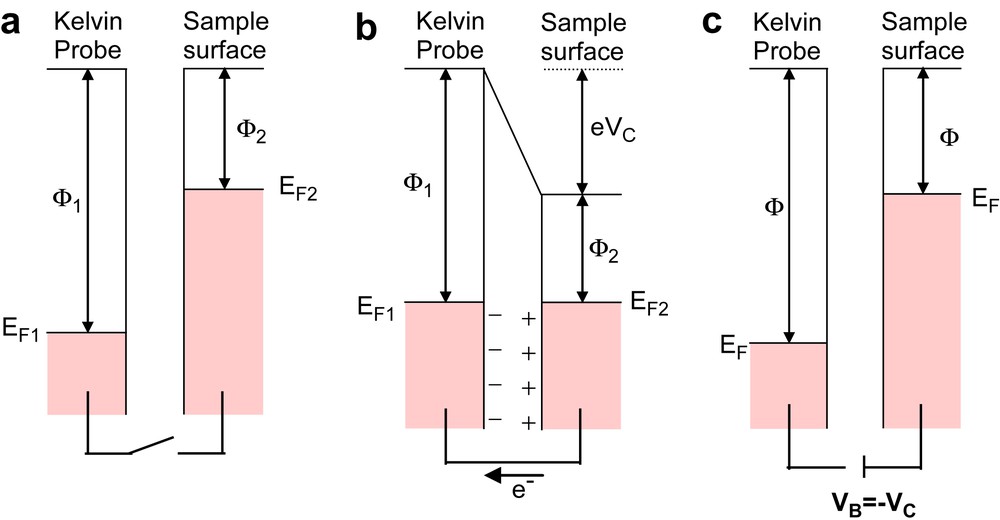
(a–c) Energy level diagrams illustrating the basics of the SKP.
The diagram on the left (Fig. 1a) shows the metals with no electrical contact. The different Fermi levels are highlighted. When an electrical contact is realized (Fig. 1b) the flow of charge allows the Fermi levels to equalize and gives rise to a surface charge and potential difference Vc, which relates to the difference in work function:
| (6) |
In the field of corrosion science, measurements of work function can be taken one step further to allow the corrosion potential (Ecorr) at a specific point to be determined. Stratmann [22,23] demonstrated the following relationship:
| (7) |
Without going into details, it is also possible to perform topographical measurements using the difference capacitance between the probe and the sample to determine the height of the probe above the surface being scanned [26]. It is achievable by means of a suitable “height calibration”.
2.3 Practical example of SKP measurements
In the following, practical examples of some applications of this technique will be presented. In order to put the right emphasis on the non-destructive feature of this device, it is important to note that all reported measurements have been performed in air without the presence of an electrolyte.
2.3.1 Organic coated steel food-cans
The first example deals with the investigation of localized defects in food industry organic coatings. In particular, two different food-cans protective coatings such as TiO2 enriched melaminic coating and TiO2 and carbon black enriched phenolic coating have been analysed. For both the two coatings the substrate consists of tin plated mild steel. Measurements have been performed before and after the immersion of the sample in a 0.35 wt% NaCl solution (pH modified to 4 adding HCl) for 120 h. This solution simulates the corrosion attack of vegetables and fruit acids, in order to better highlight the real damage that can occur.
For comparison an SKP measurement has been also performed on a bare tin plated surface. Fig. 3 shows the results of the measurement. In this case the scanned area is 15.0 × 19.4 mm. The surface looks quite homogenous, even if some little defects (or discontinuity) are observable. In fact the value of the work function difference mainly attests around the mean value.
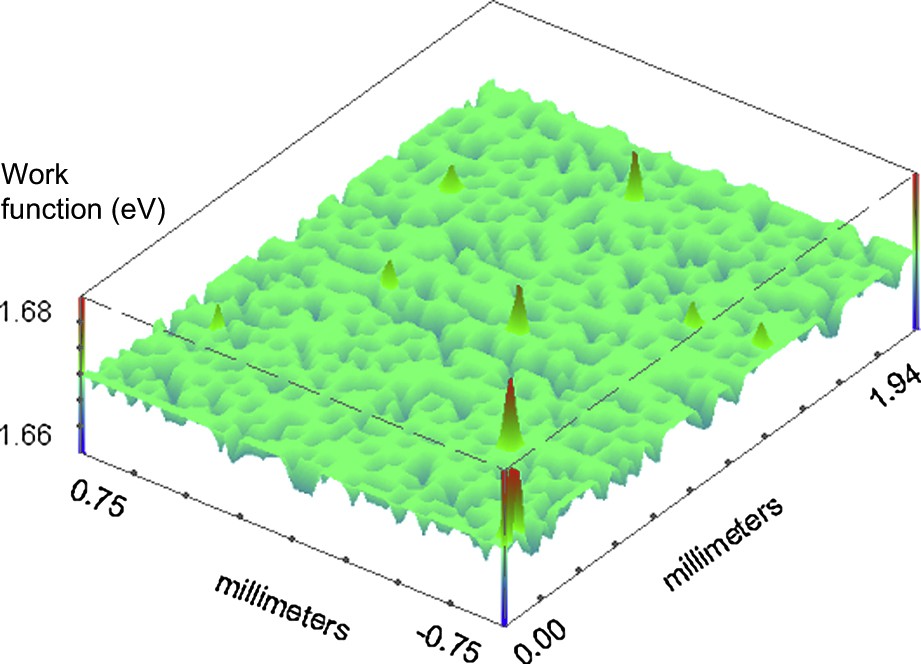
SKP in topography mode for a tinplate surface: three-dimensional representation.
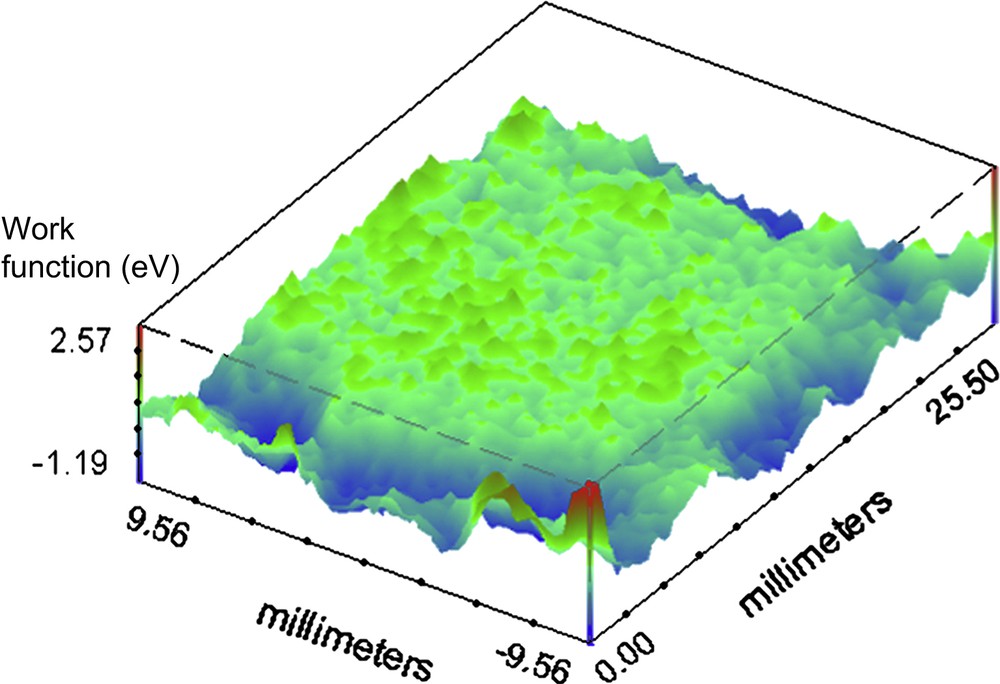
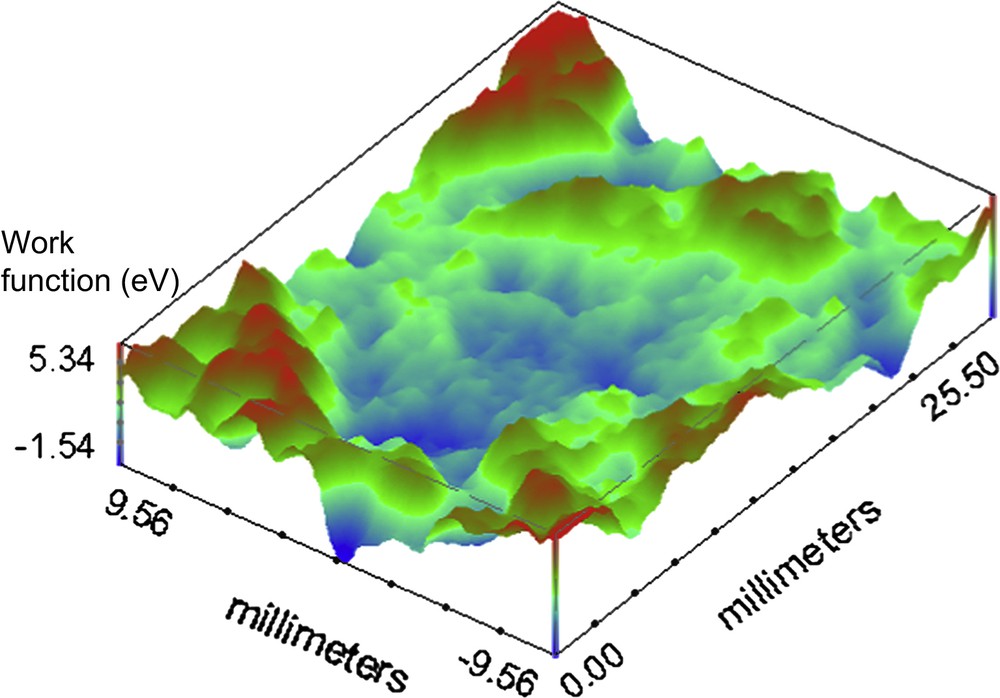
For the investigation on the organic coated surface the set scan area is 25.5 × 19.0 mm. Fig. 4 shows the melamine coated container base before the continuous immersion. It is possible to observe some defects on the surface represented by high and localized work function variation, compared with the average value all over the surface (1 deV, with a standard deviation of 0.21). Fig. 5 presents the SKP map of the phenolic polymer coated container base before immersion in the electrolytic solution. Comparing this mapping with the previous (Fig. 4) it is clear that, except for the marginal zones, the total area is more homogeneous than the corresponding melaminic coated food-can. The average value for the phenolic before continuous immersion is 0.4 deV with a standard deviation of 0.3. Fig. 6 shows the representative behaviour of the melaminic coated food-can after continuous immersion for 120 h. The average work function difference is 2 deV with a standard deviation of 0.62. It is possible to observe that the coating surface is damaged by the chloride ions generating some defects. Fig. 7 shows the phenolic coated surface after the immersion in the electrolytic solution. Its work function average value is 1.1 deV and the standard deviation is 0.98.
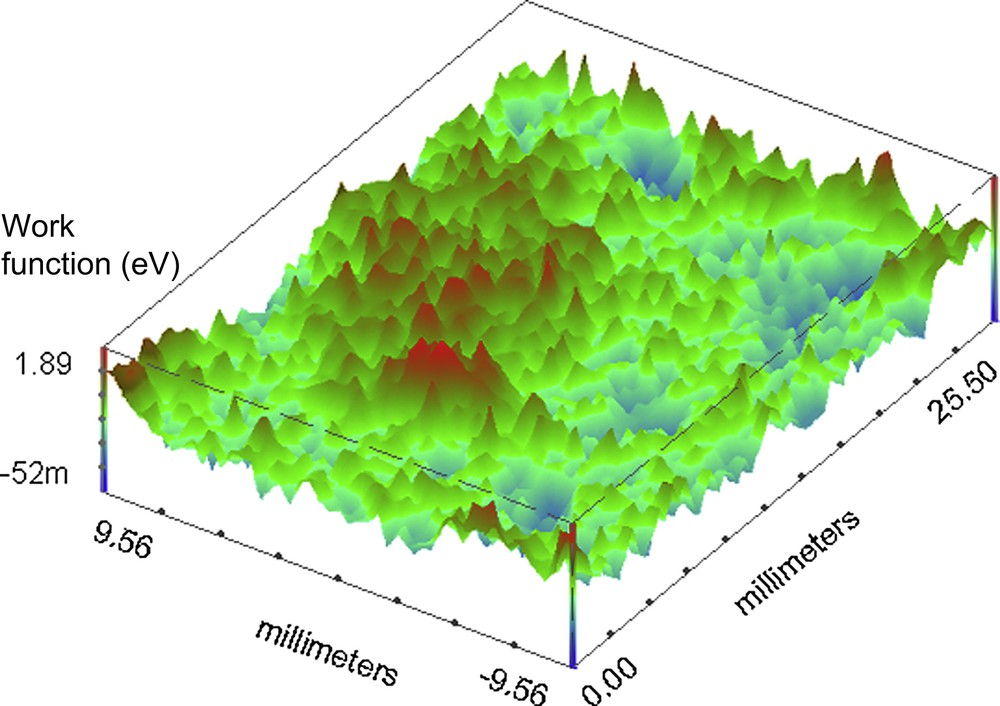
Working Function difference map of the base of the melaminic coating covered container before continuous immersion in the 0.35 wt% NaCl solution at pH 4.
Working Function difference map of the phenolic organic coated container before continuous immersion in the 0.35 wt% NaCl solution at pH 4.
Working Function difference map of the base of melaminic organic coated container after 120 h of continuous immersion in the 0.35 wt% NaCl solution at pH 4.
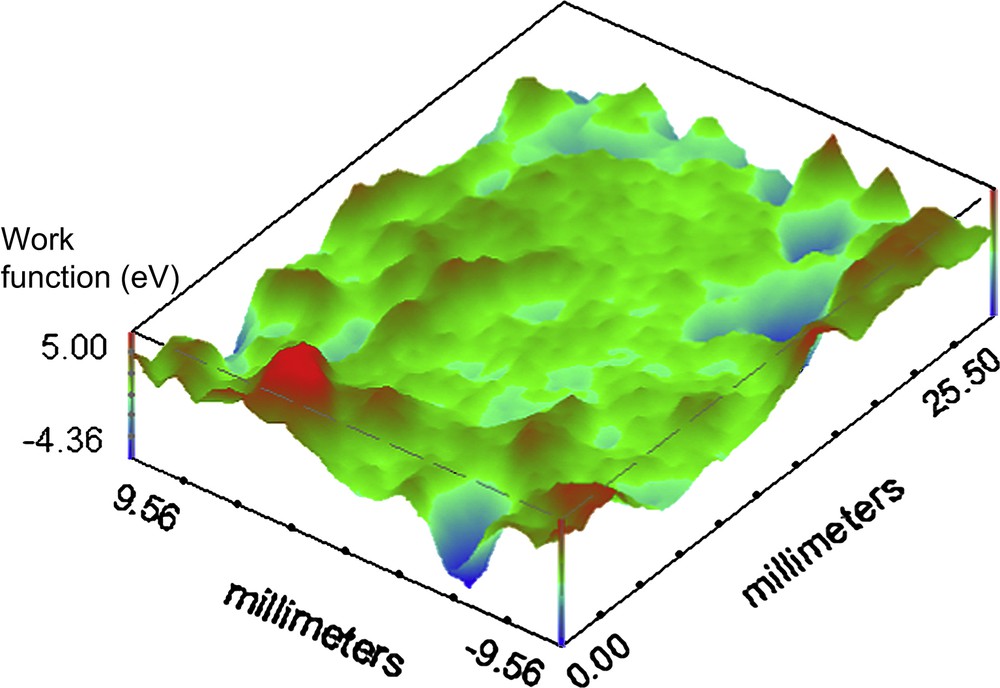
Working Function difference map of the phenolic organic coated container after 120 h of continuous immersion in the 0.35 wt% NaCl solution at pH 4.
With these results it is possible to observe more important changes on the melaminic coating compared to the phenolic one. Considering the impedance data reported in Fig. 8, it is evident that the melaminic coating has better barrier properties than the phenolic coating. This fact confirms the SKP analysis, because the melaminic coating lacks homogeneity and is characterized by a high number of defects (highlighted by scattering of the work function difference). In addition note that both the analysis confirm that after the immersion time the two coatings look very similar and there are no remarkable differences between them. This example proves that SKP is a very useful tool for the investigation of coating defects and, with respect to EIS, it provides a finer analysis of the surface conditions of the organic coatings.
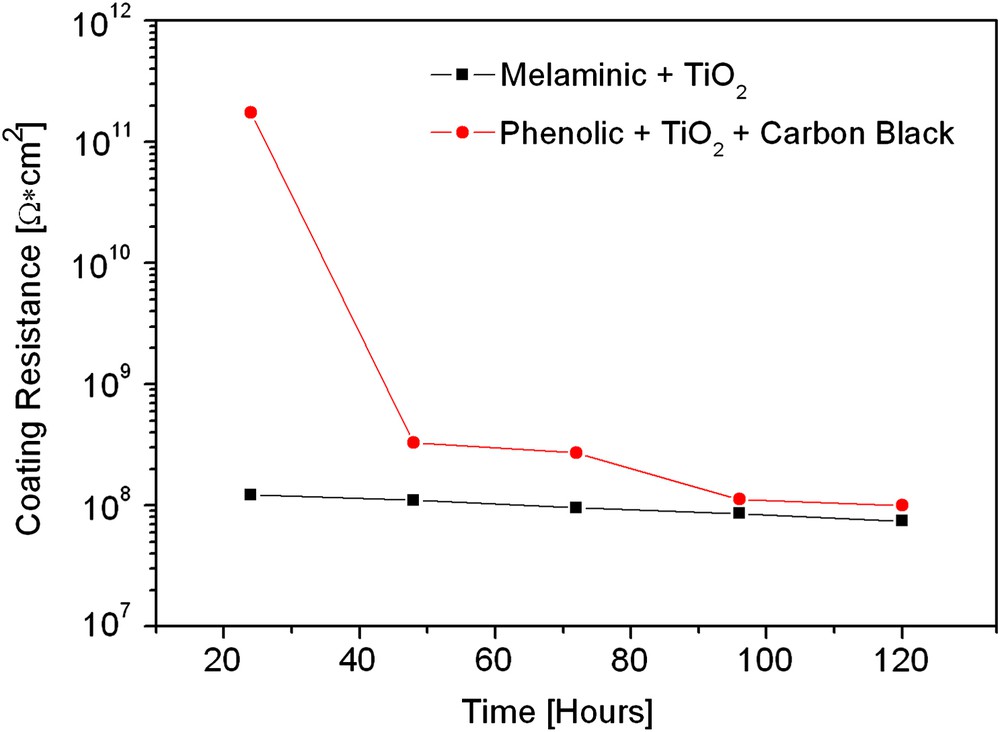
Coating resistance after 120 h of immersion in the electrolyte.
2.3.2 Hybrid silane conversion film
Applying a simple statistical analysis to the SKP experimental data it is possible to obtain more refined data about the studied system. In this example several SKP measurements were performed on silane treated copper panels. Silanes are hybrid molecules (widely used as adhesion promoters between inorganic and organic materials) able to form a thin film on metals surfaces [27]. It is possible to obtain the conversion coating by dipping copper panels into a water based solution containing silanes molecules and curing the self-assembled films in an oven for a certain time and temperature combination.
Table 1 shows the different kinds of deposition. Ox is a modified commercial mixture of silane molecules (the main fraction consist in γGlycidoxypropyltriethoxysilane, γGPS) while γGPS is the neat single silane molecule.
Silane coated samples: features and labels
| Sample | Silane pre-treatment | Heat treatment (T and t) | |
| Type | Concentration (in water) | ||
| Ox | 5% | 200 °C, 10 min | |
| 200 °C, 30 min | |||
| Ox | 50% | 200 °C, 10 min | |
| 200 °C, 30 min | |||
| γGPS | 5% | 200 °C, 10 min | |
| 200 °C, 30 min |
Fig. 9(a) and (b) depicts SKP results on bare copper (a) and on sample Ox510 (b) [28]. Since work function mapping gives only a rough idea of the behaviour of different samples, a statistical analysis is necessary, in order to highlight properly the main differences among the different samples. Fig. 10 shows the main values of the work function difference and its standard deviation calculated over the surface of each sample. Note that the relative stability of copper oxide leads to very similar and hardly comparable values of the absolute values of the mean work function difference. For this reason standard deviation was used as an indicator of the surface stability and homogeneousness. Considerable values of this statistical parameter mean a high scattering of work function over the investigated surface. For comparison, Fig. 11 shows the values of the charge transfer resistance for all the investigated samples measured after 1 h of immersion in a 0.3 wt% Na2SO4 solution. This electrochemical parameter has been calculated applying the suitable electrical equivalent circuit model for the elaboration of the impedance data. Considering Figs. 10 and 11 it is easy to observe a very similar hierarchy for the work function and the charge transfer resistance, respectively.
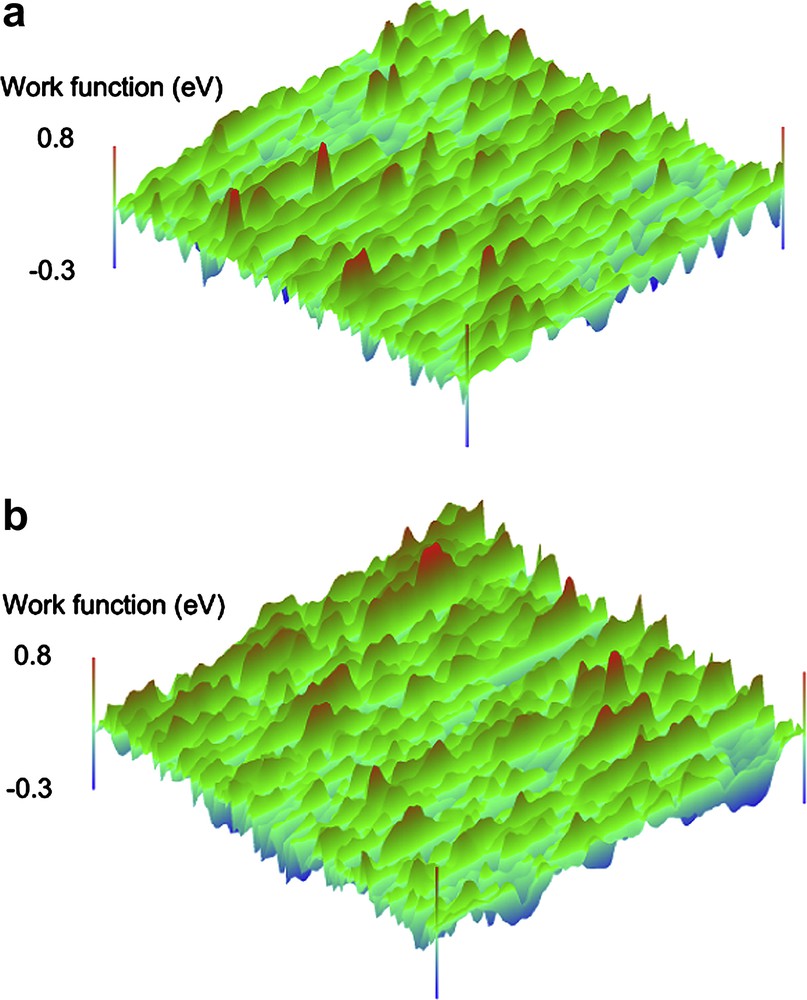
SKP work function mapping on copper surface (a) and on sample Ox510 (b); scan area 15 mm × 15 mm.
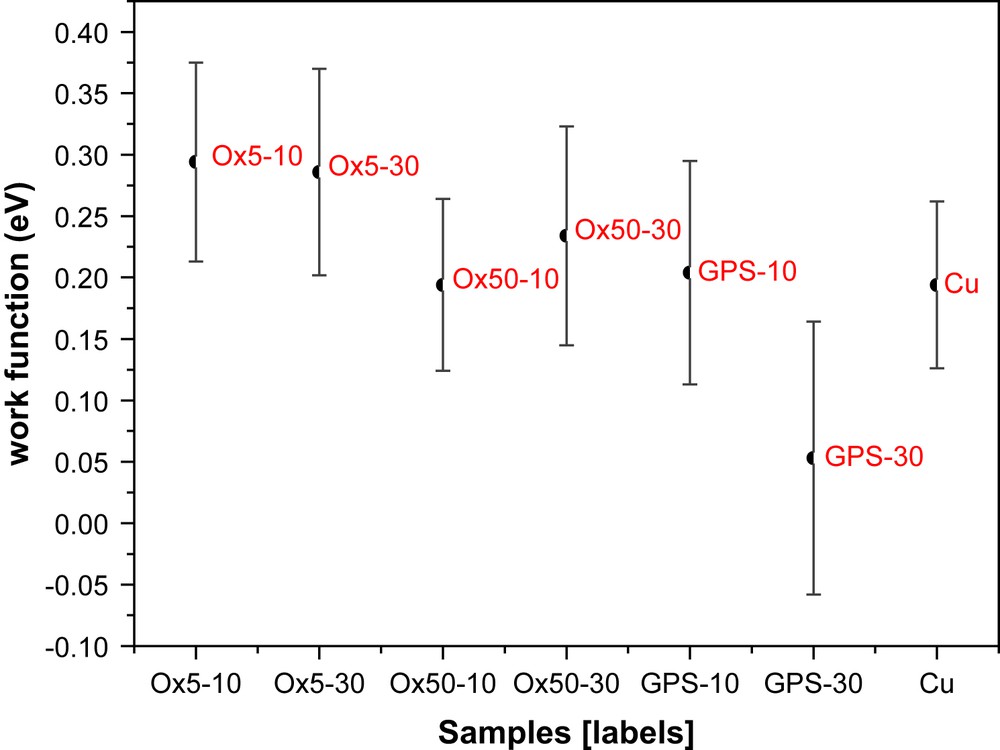
Average work function values and the corresponding standard deviation.
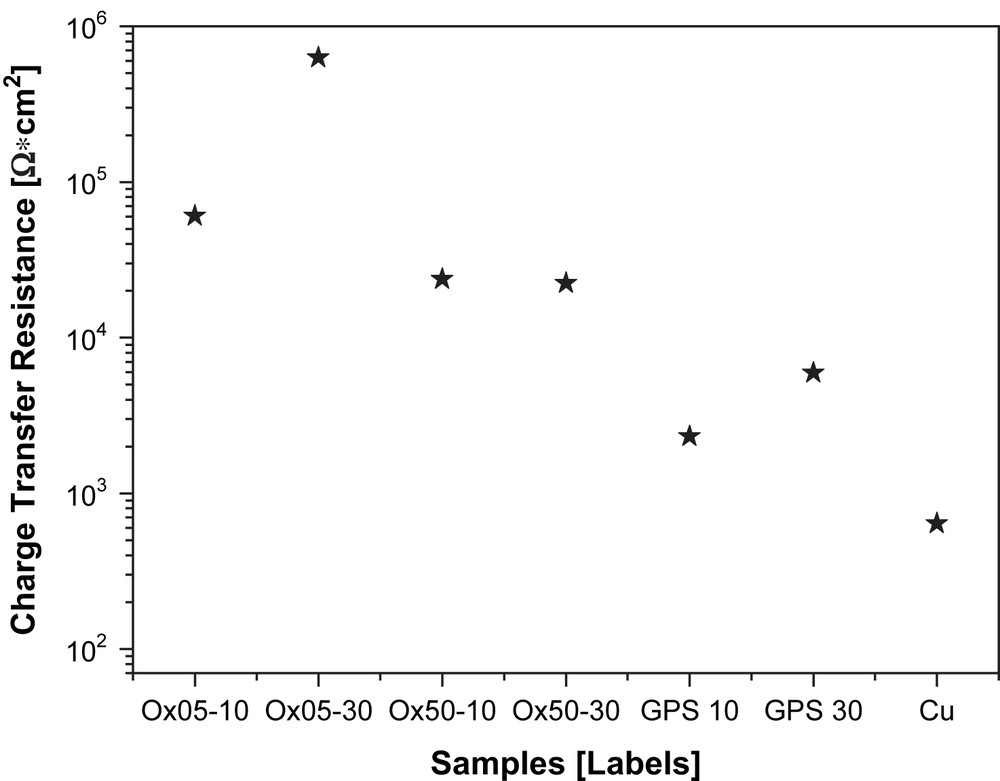
Charge transfer resistance after 1 h of immersion in a 3.5 wt% NaCl solution.
This is to underline the potential of this technique which enables to get precious information about the electrochemical activity of the metal-coating interface. Higher potentials are directly correlated with a more noble behaviour while higher charge transfer resistance means higher corrosion resistance.
Now it is easy to demonstrate that panels treated with neat γGPS show the worst behaviour. Absolute values of the work function for the panels obtained from Ox5 and Ox50 solutions do not look very different and the standard deviation is more or less the same. This simple statistical analysis highlights the fine differences among different depositions. The three-dimensional contact potential map is not sufficient if the aim of the work is an accurate samples characterization.
2.3.3 PVD TiN coated steel
A reactive sputtered TiN coated mirror polished steel surface [29] has been analysed using the Kelvin probe instrument. Fig. 12 shows the correspondent SKP map over a 2.5 × 3.0 mm surface. For comparison the measurement has been also performed on a portion of the steel sample not covered with the ceramic coating. It is clearly visible (Fig. 12) that there is a different mean work function value for the coated and the bare steel substrate. This is directly connected to the dissimilar electrochemical activity of the different surfaces. This is quite obvious, since we are comparing a ceramic coating with a bare metal. Note that the signal scatters markedly over the whole coated surface. This is a clear clue of the deposit lack of homogeneity. The signal variation (highlighted by the scattering of the work function value) is higher on steel than on the TiN film because of, even if not homogeneous, the ceramic coating which is much more electrochemically stable than the metal. In general defects occurred during film formation such as cracks or thickness variation could be detected using this technique.
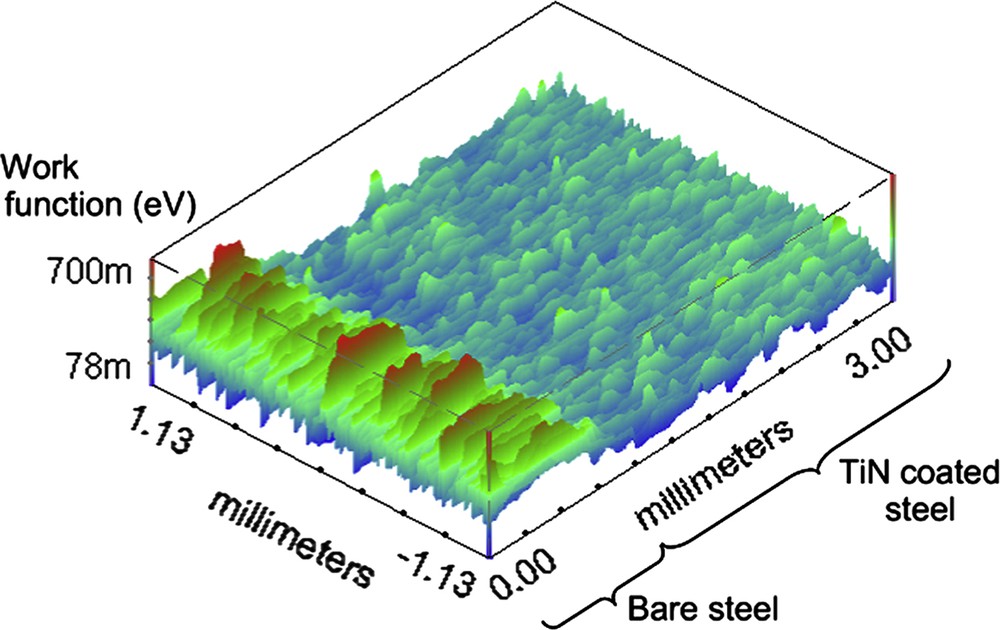
SKP map over a 3.0 × 2.5 mm area on a PVD TiN coated steel substrate.
3 Scanning vibrating electrode technique
3.1 The technique
The SVET technique measures the changes in micro-electrochemical activity in proximity of the specimen surface. SVET detects extremely small potential variations which exist over the surface of electrochemically active materials within an electrolyte. For example this device could be used on stainless steels to determine local conditions within active pits [30]; Bates [31] used this tool for the investigation of pitting corrosion in FV448 gas turbine disc steel and Sekine [32] applied the technique for the evaluation of corrosion protection performance of polymeric resins. In addition, other possible research topics of this technique are pit initiation and development, detecting of electrochemically active pin-hole defects in coatings, effect of microstructure and finish on the electrochemical activity, evaluation of the passivation–repassivation characteristics, corrosion inhibitor performance, micro-corrosion and electrochemical effects, behaviour of materials in aggressive environments.
The technique permits us to obtain potential and current density maps and to quantify the extent of the corrosion processes over the surface of the material under study. It is an in situ working device and allows us to measure localized corrosion events of less than 5 μA/cm2.
The idea to use fine tipped scanning probes to detect changes in micro-galvanic activity close to the specimen surface was proposed by Evans [33]. Later many research groups applied this method to their electrochemistry and corrosion studies [24,34,35].
3.2 Theory behind the SVET technique
Experimentally it has been observed that there exists a flow of metal ions into solution above a localized corrosion phenomenon, and a corresponding flow of electrons within the metal (Fig. 13). This miniature current dipole sets up an associated electric field distribution within the electrolyte. It is the potential variations which SVET detects and quantifies (Fig. 13).
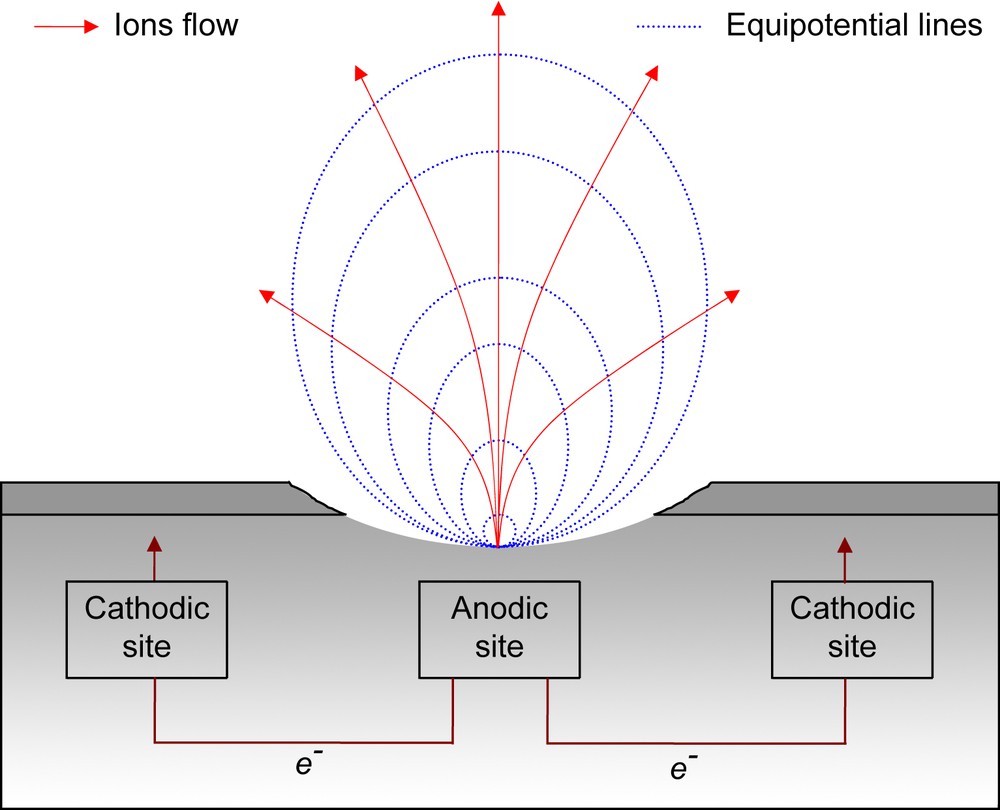
Current flow and electric field associated with an electrochemically active site on a metal exposed to a conducting solution.
The scanning probe instrument consists of a very thin platinum tip configured as differential inputs to measuring electronics. Tips measure potential variations. The probe scans over a surface of the specimen which is inside the conducting solution (electrolyte). Measurements are made in x–y directions permitting the potential variations of the localized electrochemical activity to be depicted and quantified.
Using a vibrating probe in conjunction with a lock-in amplifier it is possible to eliminate the noise occurring at any frequency other than the frequency of vibration of the probe. This increases the electrical sensitivities and the system stability also improves.
A piezo-ceramic device controls the movements of the probe allowing vibration amplitudes from 1 to 60 μm in the direction perpendicular to the sample surface (Fig. 14).
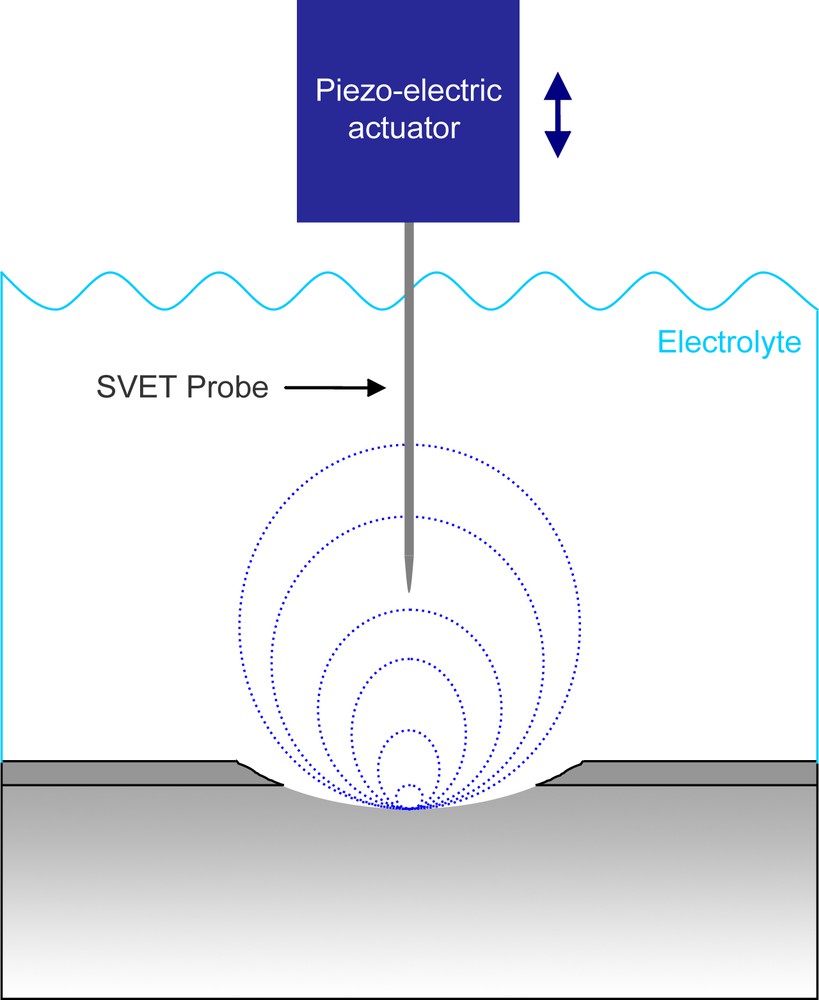
Schematic representation of the SVET technique.
The explanation of the working principles of this technique is based on the analysis and consideration of Bayet et al. [36]. In their study the microprobe vibrates at an angular frequency of Ω. The distance between the probe and the sample (working electrode) varies with time as follows (see Fig. 15):
| (8) |
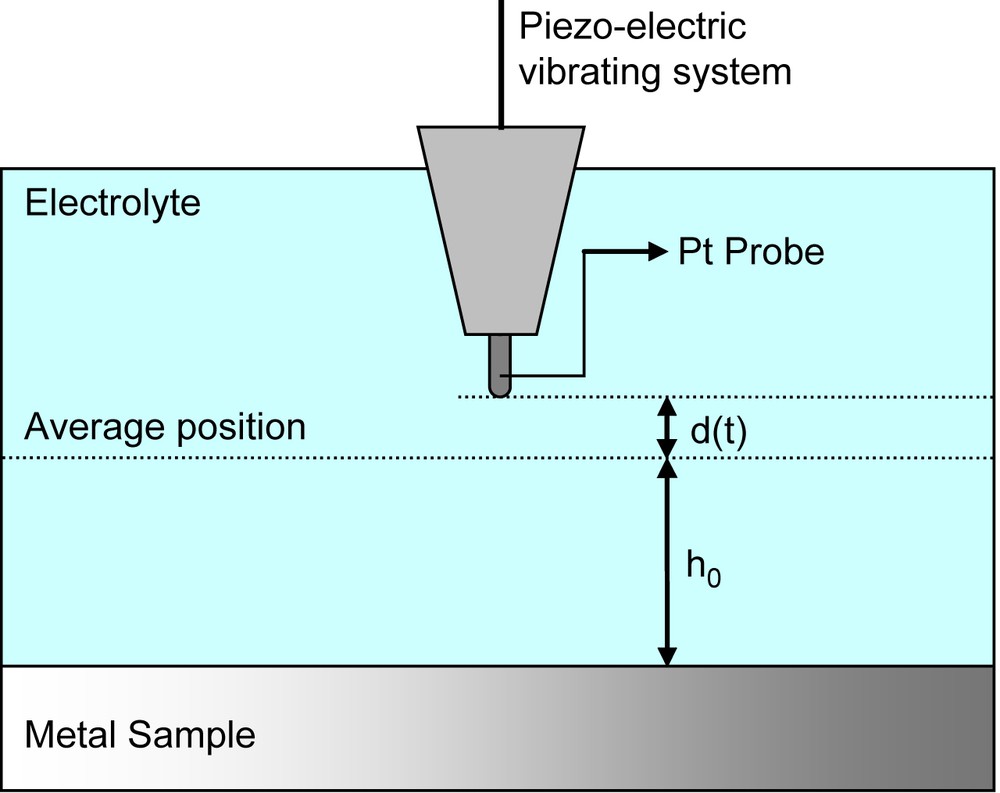
Schematic representation of the SVET vibrating system.
Under galvanostatic control and AC regime, the local current density, , just above the electrode surface, can be expressed as:
| (9) |
| (10) |
| (11) |
If the electrolyte resistivity, , remains constant even in the vicinity of the sample surface, then the electrolyte resistance relative to the unit surface between the sample surface and the vibrating probe varies with time as follows:
| (12) |
Therefore the potential between the vibrating probe (VP) and the sample surface (i.e. working electrode, WE) varies with time as follows:
| (13) |
In Eq. (13) the probe signal passes through the electronic circuit as an SVET system. This involves amplification with again G, multiplication by a reference signal in phase with the probe vibration, and filtering with a low-pass filter with transfer function . The signal then passes to the X-input of a frequency response analyser (FRA). Since the correlation calculation performed by the FRA cancels out all signals having a frequency different from, the useful component of the signal is from Eq. (13):
| (14) |
| (15) |
| (16) |
The standard calibration operation of the commercial SVET system gives the value of . The and G terms represent the specific filter transfer function and the gain of the commercial SRET circuitry, respectively, and can be readily determined by injection of a known AC signal in the circuit. Thus, the local electrochemical impedance of the interface can be directly obtained from Eq. (16).
3.3 Practical example of SVET measurements
A practical example of SVET measurements will also be reported. An organic coated beverage-can has been studied with the SVET device. Notice that, compared with the Kelvin probe technique SVET needs an electrolyte directly in contact with the sample surface.
3.3.1 Organic coated steel food-cans
Similar to the SKP measurement, the inner side of the base of a commercial beverage-can has been studied. The sample was immersed into a 0.005 M NaCl solution. The probe scans over a localized electrochemical event previously detected. The distance between tip reference and beverage-can surface was set at 80 μm. The scan area is 4.5 × 4 mm.
The graph on the left of Fig. 16 is the SVET signal as measured in volts with the displacement in micrometers along the x-axis. The SVET map in the middle of Fig. 16 is a consecutive answer of several lines’ scan that with time down the y-axis shows the measured signal in the form of defects of the coating. The dark area in the circle indicates an anodic behaviour, while zones outside could be interpreted as cathodic sites or intact coating. For comparison an image of the corroded site is reported (Fig. 16, on the right). Observe that it is possible to see the defect just because this is a pigment-free coating. The growth of the local anode area on the paint film is statistically calculated and determined by the difference (ΔE) of the potential gradient values (E) between the local anode (defective area of painted film) and the local cathode part corresponding to a non-defective area. The E values for the anode part increase with the immersion time. The potential gradient value (E) could be converted into current density (i). The following are the calculations of the current density
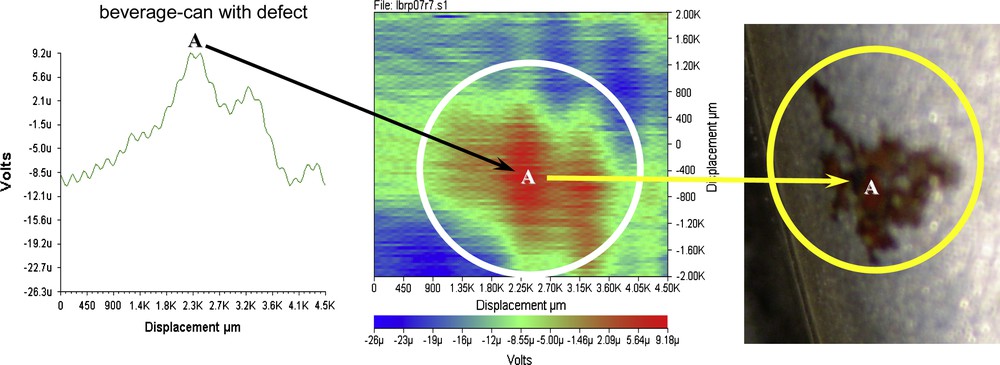
Defect of the beverage-can base detected with the SVET technique.
Curve response = 9.2 μV obtained from the graph (Fig. 16, on the left).
Applying the following equation it is easy to calculate the value of the current:
| (17) |
The solution conductivity is 12.47 μS cm−1, hence:
Multiplying this value by the vibration amplitude of the probe tip: .
Using Ohm's Law: E = IR, E = 9.2 μV and R = 25 μΩ, I = 23 nA.
4 Summary
High resolution localized techniques such as SKP and SVET have been explained. The basic principles of these devices have been reported with some simple clarifying mathematical models. In addition practical examples of the potential of these devices have been proposed in order show the wide application fields and the importance of the data achievable. It has been discussed that SVET provides very interesting information concerning the local values of the current and potential, and the experimental data are quite easy to correlate with the corrosion phenomena occurring at the metal interface. However, the limitation of this technique is that it is necessary to use an electrolyte. The presence of a conductive solution directly in contact with the sample affects the electrochemical activity of the surface of the metal. The achievable electrochemical data are influenced by the effect of the electrolyte on the natural evolution of the corrosion processes. On the contrary, SKP needs no contact between the sample and a conductive solution. Thus, the corrosion process can be monitored affecting just slightly the system. The limit of this device can be found in the difficulty of the interpretation of the experimental data.