

1 Introduction
Microemulsions emerged during the 1940s as a term to describe systems where oil and water could mix approximately in equal proportions promoted by surfactants and cosurfactants [1,2]. These systems differed from emulsions by the absence of strong light scattering and it was inferred that the systems contained smaller aggregates. Later it was also realized [3,4] that the systems were thermodynamically stable. On the basis of what was known for ordinary solubilization, it was natural to assume that the microemulsions contained either globular aggregates of surfactant and oil in water or the reverse with surfactant–water aggregates in oil. However, as more experimental studies were performed it became clear that the idea of only globular aggregates in a medium could not be the whole picture and also microemulsions with a bicontinuous structure existed [5–7]. There was also a problem in explaining why some systems would form microemulsions, but other seemingly similar ones would not. An important step forward was taken by de Gennes and Taupin [8] in a paper where the concept of an elastic surfactant film was introduced. The idea of seeing a layer of amphiphilic molecules as a flexible film had been introduced earlier by Helfrich [9] for the description of lipid bilayers. de Gennes and Taupin used the same concepts to describe surfactant monolayers at the water–oil interface. An important conclusion was that the film had to have sufficiently low bending rigidity to allow for the formation of a disordered bicontinuous structure.
After the pioneering work by de Gennes and Taupin there followed a number of more detailed theoretical treatments of the structure and thermodynamics of microemulsions [10–14]. A common approach has been to describe a microemulsion in terms of a flexible surfactant film separating aqueous and oil domains. In the Helfrich description the free energy of a specific configuration of the film is obtained as the surface integral
| (1) |
| (2) |
| (3) |
After having established a theoretical understanding of microemulsions the knowledge can be used in several ways. One obvious possibility is to address problems of practical and technical importance. In this paper, we will demonstrate another use of such systems. Microemulsions represent liquid systems with aggregates that are substantially larger than molecules and yet small. In this way they allow for uniquely quantitative studies of a range of liquid state phenomena. These studies are based on a ternary system: water, normal alkane and nonionic oligo oxyethylene alkyl ether surfactants, CnEm. The spontaneous curvature is very temperature sensitive and the properties are conveniently tuned through temperature changes [16,17]. Fig. 1a shows a schematic ternary phase diagram of a surfactant–water–oil system at balanced conditions (T = T0) where H0 and c0 are zero. The strong temperature dependence of H0 and hence the phase equilibria are illustrated in Fig. 1b for the C12E5–water–decane system with equal amounts of water and oil.
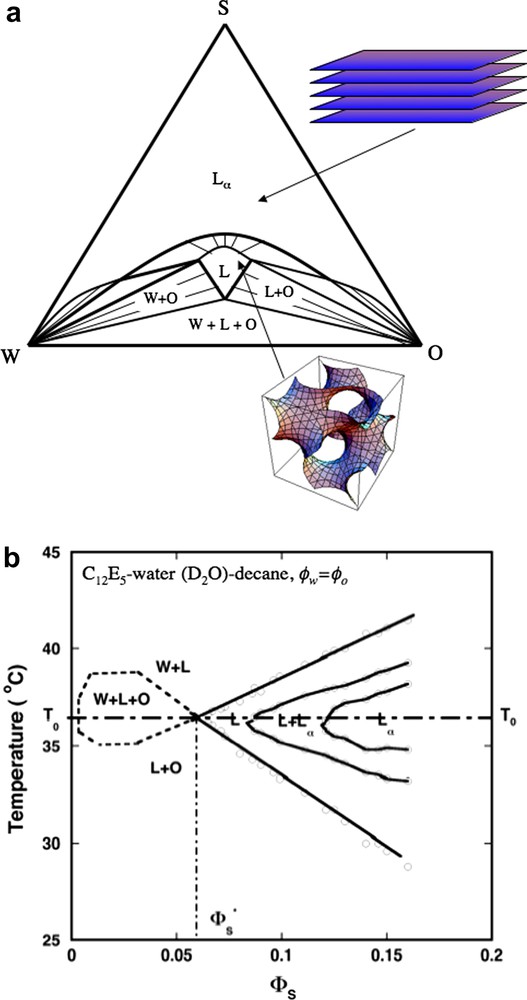
(a) Schematic ternary phase diagram under balanced conditions where H0 = 0, that for nonionic surfactants occur at the balance temperature T0, also corresponding to the phase inversion temperature, PIT. When H0 = 0 either the lamellar phase (Lα) consisting of a stack of planar bilayers, or a bicontinuous (balanced) microemulsion (L) containing equal volumes of water and oil is stable. In both phases the average mean curvature of the surfactant film is zero. (b) Kahlweit's “fish diagram” [54] of the ternary system C12E5–water–decane showing how the phase behavior evolves with temperature and the surfactant volume fraction (ϕs) at the constraint of equal volumes of water and oil (ϕw = ϕo). ϕ∗ is the minimum surfactant concentration (maximum swelling) of the balanced microemulsion. Adapted from Ref. [24].
Below we summarize how we have used the ternary system C12E5–water–alkane to study a range of physical–chemical phenomena. In covering such a broad spectrum of studies, the account of each specific case will, by necessity, be kept brief. Unfortunately, we cannot describe here the full background for each individual case.
2 Interfacial tension
A characteristic feature of microemulsion systems is that one can obtain low to very low interfacial tensions between macroscopic water and oil phases. Much attention was paid to this phenomenon in the early days of microemulsion work [18–21]. The hope was that this could be very useful for applications in, for example, tertiary oil recovery. Here we take an opposite view and ask what we can learn about liquid–liquid interfacial tensions in general from studies of microemulsion systems. Sottmann and Strey have made accurate and systematic measurements of the interfacial tension for a series of water–alkane–CmEn systems [22]. The measurements cover a wide temperature range including the balanced temperature. In this way one covered situations with both droplet and bicontinuous microemulsion liquid phases.
Microemulsions are often denoted as “complex liquids”. However, when it comes to a theoretical description of the interfacial tension it turns out that they can be seen as substantially simpler than the “simple liquids”. The source of this simplicity is the fact that the surfactant film that develops at the oil–water interface is already present in the microemulsion system. When new interfacial area is created in the system, surfactant film moves from the bulk to the interface, rearranges geometrically, but remains intact from a local molecular perspective. A calculation of the interfacial tension can then be based on an already established description of the film in the bulk phase.
A few degrees away from the balanced temperature one finds a two-phase liquid–liquid coexistence between a nearly pure oil or water phase and a droplet phase with the enclosed coexisting bulk liquid (see Fig. 1b). Above T0 there is water coexisting with W/O droplet microemulsion and below T0 one has oil coexisting with an O/W phase. At the interface there is a surfactant monolayer, which can be formed by transferring a droplet to the interface and then unwrapping it. It has long been recognized [17] that the main free energy cost in this process is associated with the change in monolayer bending energy. However, in a full description one has also to consider a number of contributions of entropic origin.
The localization of a droplet to the interface involves a decrease in the translational entropy. Additionally, droplets are depleted from a small volume adjacent to the film, which involves another entropy loss. The film on the other hand is flat only on an average, since it experiences thermally excited deformations. These deformation modes can be classified according to how they depend on the wave vector, q. For long wavelengths, small q, gravitational modes dominate. In an intermediate q range the q2 capillary waves are the most prominent, while for still shorter wavelengths the q4 bending modes contribute most to the entropy.
Neglecting the small contribution from gravitational waves, a single mode (qx,qy) contributes a relative area increment of [23]
| (4) |
| (5) |
When calculating the free energy change due to the entropy of these deformation degrees of freedom, it is important to realize that bending modes are also present in the droplets. There, however, the wavelength is limited by the size of the droplets. When a drop is incorporated into the interfacial film there are drastic changes in only three degrees of freedom of the drop: the translation perpendicular to the film and the two rotations with in-plane axes. We see no easy way to estimate the free energy contribution from these degrees of freedom. However, the free energy contribution is small from the loss of translational entropy in relation to the curvature term. The correction term from the films' degrees of freedom should be even smaller and below we neglect this contribution.
The surface free energy of the system is then [23]
| (6) |
One can expand c0 around the balance temperature and
| (7) |
The factor (1 + (kT/8πκ′)ln Xd)−1 in Eq. (6) deviates significantly from unity, but it does not vary substantially with temperature changes. Thus, for the systems in Fig. 2 we arrive at an approximate relation [24]
| (8) |

Temperature dependence of the water–oil interfacial tension, γ, plotted as γ versus (T − T0)2, emphasizing the parabolic temperature dependence, for four different C12E5–water–oil systems, varying the oil chain length. T0 is the balance temperature where H0 = 0. The solid line is the best fit of Eq. (8) to the data, yielding κ′α2 = 3.6 × 10⁻⁷ J m−2 K−2. Data from Ref. [22].
Fig. 2 shows a plot of the interfacial tension for four different C12E5–water–alkane systems. The figure demonstrates the quadratic dependence of γ on (T0 − T). Note that, within experimental accuracy, the slope is the same for all four systems. Based on the independent determinations of α we arrive at a value of κ′ = 1.4 × 10⁻²⁰ J independent of the length of the alkyl chain of the oil.
In a small temperature range around the balanced point (T1 < T < T2 in Fig. 1b) one has a three-phase equilibrium: water–oil–bicontinuous microemulsion. As one could qualitatively expect from Eq. (8) there is a very low water–oil interfacial tension in this case. However, the detailed arguments leading to Eq. (8) are no longer valid. As a special case, consider the interfacial tension at the balanced point where the spontaneous curvature is zero. Clearly there is no penalty with respect to the mean curvature term of Eq. (2) for forming a flat interfacial film. Yet, there is an interfacial tension.
In the bulk microemulsion phase the Gaussian curvature is strongly negative and there is a change in the Gaussian curvature energy when a flat monolayer is formed. Additionally, the bicontinuous microemulsion structure is disordered and one can associate an entropy to this disorder. In our interpretation, this is the dominant factor stabilizing the microemulsion, while we expect that is negative. In going from a bicontinuous to a planar state K goes from a negative value to zero. Thus in the case the Gaussian curvature term provides a negative contribution to the interfacial tension. Whatever the detailed free energy model, taking a patch of the monolayer in the bulk to the interface involves bringing it to the reference thermodynamic state. Thus the surface free energy is directly related to the bulk free energy density gbulk(ϕ) so that [23,24]
| (9) |
| (10) |
| (11) |
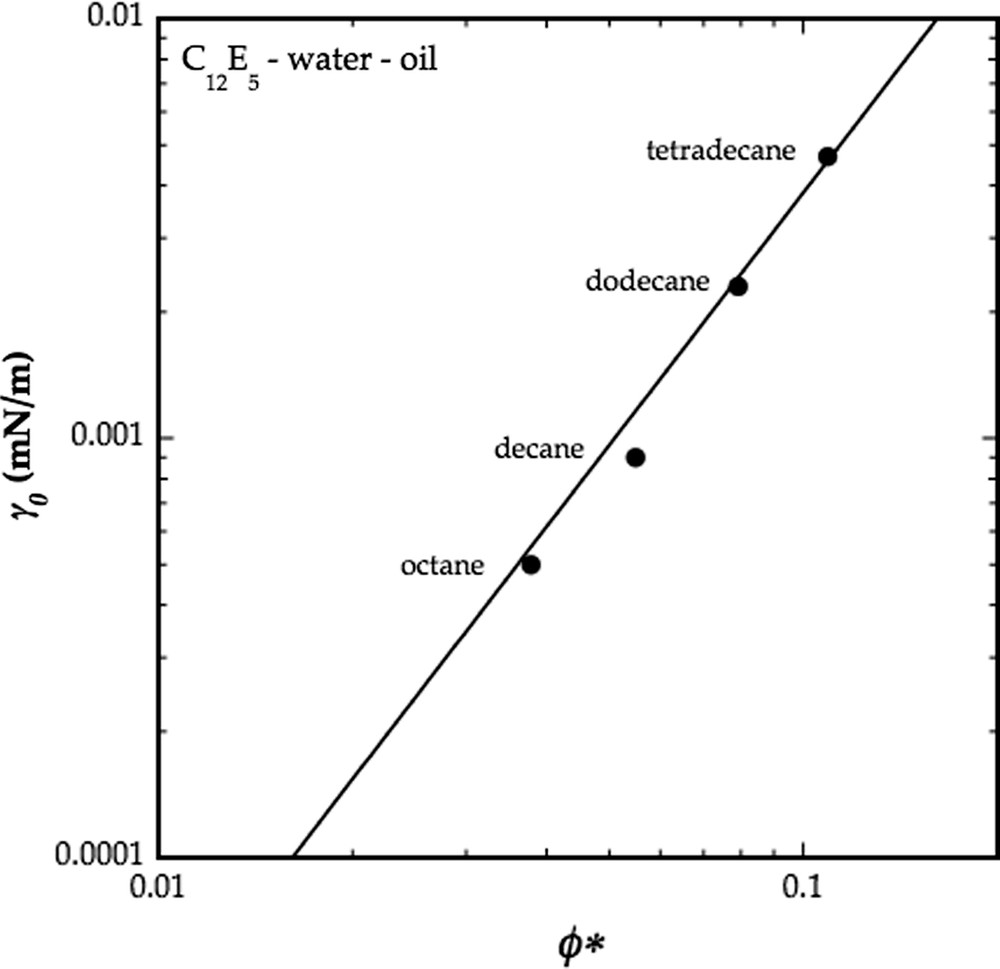
Variation of the minimum water–oil interfacial tension, γ0, at T = T0, with the minimum surfactant concentration, ϕ∗, of the balanced microemulsions of four different C12E5–water–oil systems. The different data correspond to four different alkanes. The solid line is the best fit of Eq. (11) to the data yielding a3l/2 = 0.38 mJ/m2. Data from Ref. [22].
Above we have demonstrated that by a careful analysis of the bulk thermodynamics of microemulsions one can arrive at the explicit Eqs. (8) and (11) for the interfacial tension of microemulsion systems. Such simple relations are not available for “simple” liquids. We have further shown that for our particular case there is no large difference between the area of the surfactant film at the interface and the macroscopic base area. Even though the interfacial tension is small the bending modes dominate at high values of the wave vector reducing the tendency for a divergence of the molecular interface.
3 Nucleation
The classical theory of homogeneous nucleation is based on the idea that the formation of a nucleus of an emerging phase is hindered by the surface free energy of the nucleus. The larger the supersaturation, the easier it is to overcome the barrier caused by the surface free energy. One problem in a quantitative description of nucleation in molecular systems is that the emerging phase is a small cluster and one can question the relevance of the macroscopic interfacial tension for estimating the surface effects. It is challenging to theoretically or experimentally estimate the size dependence of the interfacial tension.
Fig. 4 shows a partial phase diagram for the system water–decane–C12E5 at a constant surfactant/oil ratio of 0.815 (w/w). A remarkable feature of this diagram is the nearly horizontal phase boundary at 25.0 °C separating a homogeneous droplet microemulsion phase at higher temperatures from a two-phase area where the microemulsion coexists with pure oil. Through a temperature quench, one can thus move from a stable homogeneous microemulsion system to a system where an oil phase should separate out. This process can be simply monitored through the increase in light scattering measured, for example, by the change in turbidity. The observation is that a measurable nucleation is found first for temperature quenches that are at least 3.0 °C [26,27].
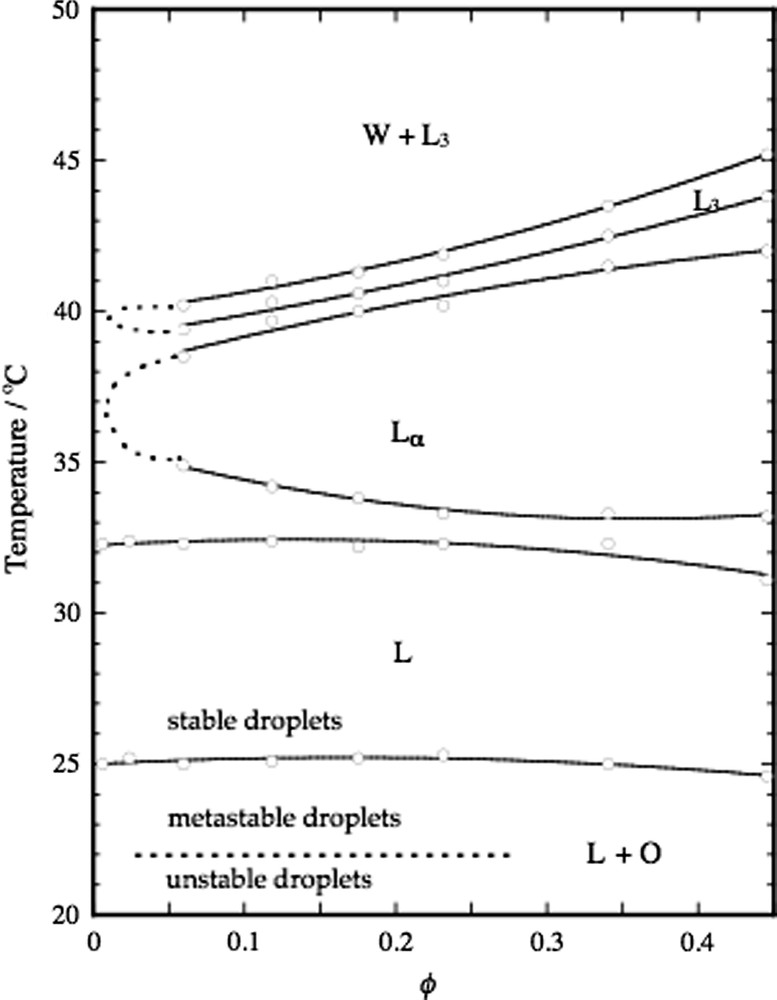
Partial phase diagram of the C12E5–water–decane system at a constant surfactant-to-oil ratio, ϕs/ϕo = 0.815. The water rich microemulsion phase consists essentially of surfactant stabilized oil droplets and ϕ = ϕs + ϕo is the total droplet volume fraction. When cooling the droplets below 25 °C the droplets shrink and expel oil to an excess oil phase. The droplets can be supercooled and remain metastable in the temperature range 22–25 °C. Upon cooling below the spinodal line at 22 °C, the excess oil phase forms instantaneously. Data from Ref. [26].
In contrast to the case of phase separation from a molecular solution, we can in the microemulsion case construct a quantitative model for the process. Instead of singly dissolved molecules the initial state consists of microemulsion droplets of known size [28,29]. At the final temperature of the quench, the droplet size distribution is metastable/unstable. The equilibrium state is a separated oil phase and a droplet distribution of a smaller size. The most favourable route to the final state is through a disproportionation where the majority of droplets decrease in size, as favoured by the curvature free energy, while a few are “sacrificed” to grow towards macroscopic dimensions.
The Helfrich expressions, Eqs. (1)–(3), can be used to derive an expression for the nucleation rate in a way analogous to classical nucleation theory. The important difference is that a) the objects are large enough for the macroscopic concepts to apply, and b) the curvature energy concept provides a quantitative account of the size dependence of the interfacial tension. A detailed derivation [27] gives the expression
| (12) |
If one assumes that the changes in droplet size occur due to diffusional transport of individual oil molecules it is possible to also derive an expression for the nucleation rate. Previous measurements on the system have established reasonably accurate values for the parameters entering the rate expression. The predicted nucleation rates increase from 10−29 s−1 at 1.5 °C quench to 10−17 for 2 °C and 10−5 at 3 °C below the phase boundary. This is fully consistent with the experimental observations. The conclusion is that the approach of classical nucleation theory is valid for this case provided that the free energy penalty for forming larger drops is calculated through the change in curvature energy.
4 Ostwald ripening
When a new phase is emerging from a homogeneous system there is first a nucleation burst as discussed above. As the nuclei are formed and grow the degree of supersaturation decreases and one rapidly reached a stage where the bulk concentration of the precipitating species is only marginally higher than the saturation concentration. A further development of the system towards a separate bulk phase then occurs either by self-association of the nuclei or by Ostwald ripening. In the latter case molecules move as monomers from smaller to larger drops by diffusion in a process driven by the gain in surface free energy. Slezov and Lifshitz [30] and Wagner [31] independently developed the kinetic theory for this process. The prediction is that a stable distribution function is established during the ripening and that the mean drop volume increases linearly with time.
In Fig. 5 we show the result of a small angle neutron scattering (SANS) study of the Ostwald ripening for the same system water–decane–C12E5 as used in the nucleation study described above [32]. Following an initial phase with uncertain data the measured mean radius grows with the cube root of time in accordance with theory. Furthermore, the theory predicts the relation
| (13) |
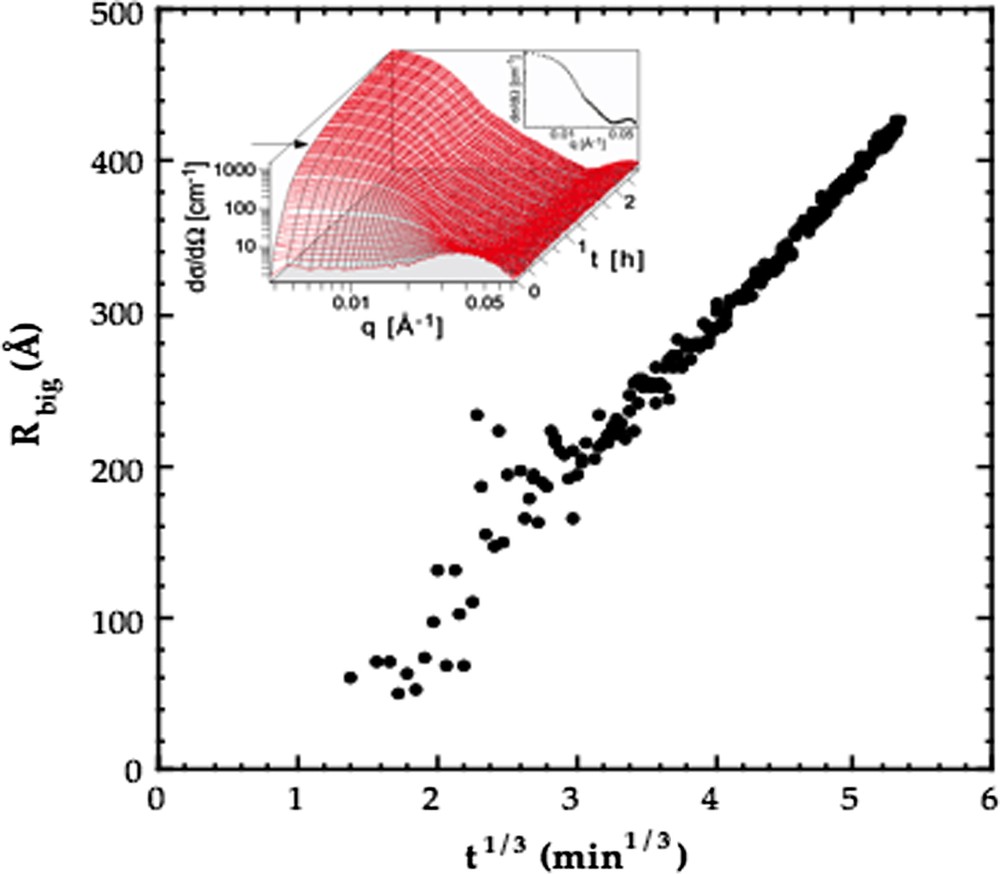
Variation of the mean radius with the cubic root of time for oil drops undergoing Ostwald ripening in the C12E5–water–decane system described in Fig. 4, obtained from time resolved small angle neutron scattering (SANS) experiments. The insert shows a stacked plot of the time resolved SANS data. Data from Ref. [32].
5 Solubilization kinetics
Many practical applications of surfactants are based on their capacity to solubilize apolar compounds in an aqueous system. The equilibrium aspects of solubilization can readily be studied. For a proper function in practice it is also essential that the kinetics is fast enough. The solubilization process involves the transfer of molecules from an apolar phase to the interior of amphiphilic aggregates like micelles and microemulsion droplets. In order to systematically study the dynamics of the process it is necessary to have well characterized initial states. For a macroscopic oil phase floating on the aqueous medium the solubilization rate is clearly limited by diffusion transport over macroscopic distances. To determine the possible influence of local molecular events one has to find another way to prepare the initial state.
In the previous section we discussed the Ostwald ripening of oil drops in a droplet microemulsion. This non-equilibrium system was prepared through a temperature quench of around 10 °C from the microemulsion phase. Now one can reverse this process by jumping back to the original temperature after a given time of ripening. Just after the temperature jump back one has access to a well controlled bimodal initial state where larger oil drops coexist with smaller microemulsion droplets. The size and number of large drops depend, due to ripening, on the time spent at the lower temperature. After jumping back to the higher temperature the system relaxes towards the equilibrium unimodal size distribution by having the large oil drops solubilized by the smaller microemulsion droplets.
We have used this concept for systematic studies of solubilization kinetics [34–36]. Fig. 6 shows the result of two representative experiments, where the size of the drops is monitored through turbidity in visible light. It is possible to quantitatively fit the data using a model where the basic assumption is that the rate-limiting step is the diffusion of oil molecules from the large drops to the smaller microemulsion droplets. It is necessary to account for the finite concentration of drops and droplets in a cell model to achieve a quantitatively accurate description. The main conclusion that even the diffusional transport over colloidal distance is rate limiting implies that there are no appreciable barriers for oil molecules to enter through the surfactant film of the droplets. Additionally aggregate fusion or fission does not occur under the given experimental circumstances. However, we have observed that under certain circumstances there occurs a direct mass transfer from large drops to small droplets [35].

Variation of turbidity with time in the C12E5–decane–water (Fig. 4) where a phase separating system in the two-phase region L + O, containing a bimodal size distribution of droplets, is suddenly heated back to the microemulsion phase at 25 °C. The turbidity decreases as the small droplets, of initial volume fraction ϕsmall and initial radius 60 Å, solubilize the big drops, of initial volume fraction ϕbig and initial radius 150 Å, turning the initially bimodal size distribution into a unimodal one. In experiment 1 ϕsmall = 0.024 and ϕsmall = 0.05. In experiment 2 ϕsmall = 0.012 and ϕsmall = 0.14. The solid lines are model calculations based on the cell model that takes into account the finite volume fraction of droplets. The broken line is the infinite dilution limit (IDL) prediction of experiment 1. Note that the solubilization kinetics increases with the concentration of small droplets. Data from Ref. [34].
6 Capillary induced phase separation
It is a characteristic feature of microemulsion systems that the surfactant film at the boundary between oil and water can adopt many different topologies without major changes in free energy. Thus, small perturbations can lead to large changes in the overall structure, since there are virtually no changes in the local molecular organization. One way to introduce a perturbation on such a system is to confine it between surfaces. Then there is, in addition to the bulk free energy, also a surface term. The surface free energy depends on the organization of the film and this affects the relative stability of different phase structures. The surface force apparatus provides a useful method to induce a surface confinement on a sample. One can readily follow the changes in the system by measuring how the force between the surfaces varies with separation.
Petrov et al. [37,38] studied the behavior of the aqueous sponge phase of C12E5 between mica surfaces. For this system hexanol was added to tune the phase structure into a sponge phase at the operating temperature of 22 °C of the instrument. The sponge phase contains surfactant bilayers organized in a topologically complex network structure. Fig. 7 illustrates a measured force curve. At surface separations larger than 60 nm there is in the range up to 100 nm an oscillatory force. The characteristic length of the oscillations matches the expected structural length-scale in the bulk phase. At 60 nm the force curve changes character and the forces become stronger and they show oscillations on a shorter length-scale. Furthermore full equilibrium is not reached in the sense that on moving the surfaces apart one observes a clearly attractive regime. This does not appear on approach since jumps occur due to a mechanical instability, which is an inherent feature of the measuring procedure.
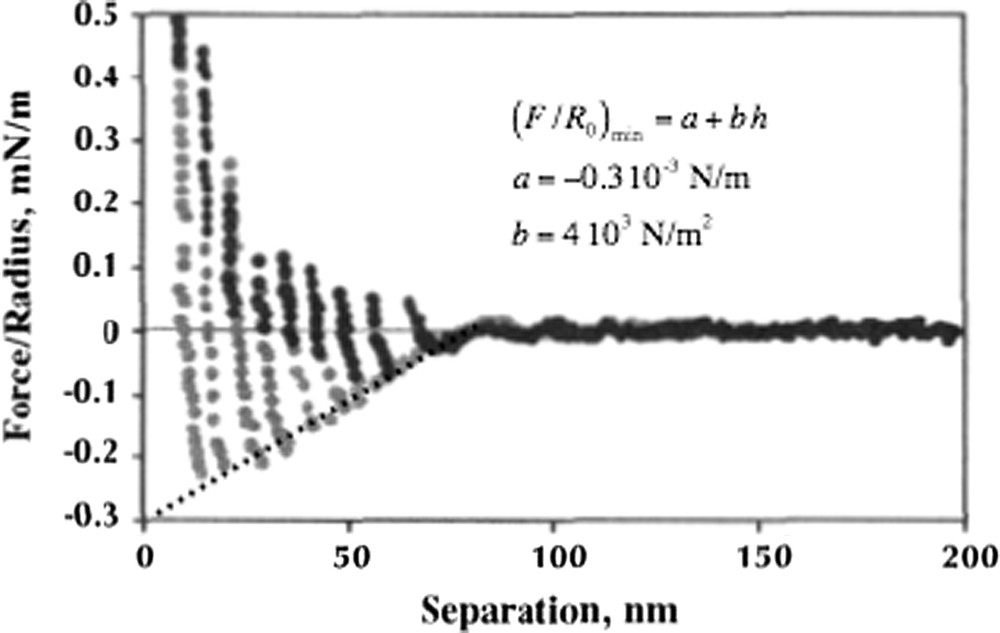
Force curve for two mica surfaces in a nonionic sponge phase in the C12E5–hexanol–water system at 25 wt.% C12E5 + hexanol. Below ca. 80 nm there is a transition to a lamellar structure in the confinement between the surfaces. The dotted line is a linear fit to the series of attractive minima allowing for a quantitative analysis of the phase transition induced by the confinement. Data from Ref. [37].
The most likely interpretation of the change occurring at separations around 60 nm is that there is a transition to a lamellar phase oriented in the gap between the mica surfaces. As the surfaces approach further the lamellae are sequentially squeezed out with larger and larger kinetic barriers. A more subtle effect that strongly supports such an interpretation is related to the attractive minima observed on separating the surfaces. If there is the formation of a multilamellar structure this is an example of the general phenomenon of capillary induced phase separation (CIPS), where capillary condensation is the most studied case. A derivation based on balancing the bulk and surface free energies yields an attractive force
| (14) |
| (15) |
7 Ions at interfaces: the Hofmeister series
The characteristic length-scale, ξ, of a bicontinuous microemulsion is determined by the inverse of the interfacial area per unit volume, ξ ∼ (A/V)−1 = (ϕs/l)−1, where ϕs is the surfactant volume fraction and l again is the film thickness. This length is typically in the range 10–50 nm (corresponding to A/V ≈ 20–100 m2/cm3) which implies that a large fraction of the system is, in a molecular way, influenced by the surfactant film. It is thus possible to obtain information on interfacial properties by adding solutes to either water or oil and monitor the response of the system. The study of the effect of electrolytes provides a clear illustration of the approach. An electrolyte based on small ions will certainly preferentially dissolve in the aqueous region of a bicontinuous microemulsion. It is less clear how the ions distribute between the “pure” aqueous part and the palisade layer of the film also containing ethylene oxide groups. How can one study this partitioning? Due to the fact that the interfacial area is so large it is actually possible to analytically measure the effects of the partitioning. For a bicontinuous microemulsion in equilibrium with an aqueous phase a measurement of the electrolyte content in the latter provides direct information on the surface excess in the film [39]. Table 1 provides a summary of the depletion effects for a range of simple electrolytes. The trend follows the Hofmeister series. This is a clear illustration of a situation where the Hofmeister effect is associated with interface effects.
Henry constants at the C12E5 microemulsion monolayera
| Substance | Henry constantb (Å) | Depletion layer thicknessc (Å) | Salting out strengthd (mol/l)−1 |
| Dextran hexamer | −9.9 ± 0.8 | 8.0 ± 0.8 | 40 |
| NaF | −4.8 ± 0.6 | 2.9 ± 0.6 | 14 |
| NaCl | −4.2 ± 0.6 | 2.3 ± 0.6 | 8 |
| NaBr | −3.1 ± 0.6 | 1.2 ± 0.6 | 3 |
| NaI | 3.4 ± 0.7 | −13 | |
| NaSCN | 16.9 ± 3.5 | −71 |
a Adapted from Ref. [39].
b The Henry constant, λ, is defined through Γ = λcsalt, where Γ is the surface excess and csalt is the bulk salt concentration.
c A water layer thickness outside the ethylene oxide palisade layer from which the ions are depleted.
d Defined as the inverse salt concentration at which an initially balanced microemulsion (with ϕo/ϕw = 1) becomes ϕo/ϕw = 2 (positive values) or ϕo/ϕw = 1/2 (negative values).
A more subtle consequence is that for an electrolyte that is depleted from the palisade layer there is a change in the spontaneous curvature H0. This occurs since on addition of electrolyte the osmotic pressure, πbulk, increases in the solution. A depletion of ions from the palisade layer generates a gradient in the osmotic pressure. This in turn generates a change in the curvature energy and there is a shift in the product κH0 [40]
| (16) |
8 Emulsion coalescence
Surfactants are widely used to stabilize emulsions. For ionic systems the electrical double layer repulsion can ensure kinetic stability, while for nonionic systems the mechanism of stabilization has been debated. There exists a large body of empirical data collected for more than a century. These reveal clear stability trends for the nonionic systems. It is natural to assume that the rate-limiting step for emulsion coalescence is the fusion of the two surfactant monolayers. However, Kabalnov and Wennerström [41] considered the free energy changes occurring as a neck, formed after fusion, grow to produce a single globular emulsion drop. This process is illustrated in Fig. 8. The driving force for the process is the decrease in film area resulting in a decrease in surface free energy. During the growth of the neck there is an increase in curved regions of the film. This situation had been analyzed by Kozlov and Markin [42] for a corresponding bilayer system. For the emulsion monolayer case the free energy of the neck is
| (17) |

Schematic illustration of the coalescence process involving the nucleation and growth of a hole in the thin solvent film separating two emulsion drops. In the model calculations the film is assumed to be flat with a thickness 2b, and hole radius is denoted as a.
where a is the (smallest) radius of the gap and b the thickness, away from the neck, of the solvent layer separating the monolayers. The free energy barrier is obtained by minimizing G∗(a,b) with respect to b for each value of a and
| (18) |
For systems C12E5–water–alkane the spontaneous curvature is easily modulated by temperature changes and one expects a change in the stability behavior at the balanced temperature T0, where H0 = 0. From the previous section it follows that we can also tune the spontaneous curvature at constant temperature by adding an electrolyte, like NaCl, that is depleted from the palisade layer. Fig. 9 shows measured emulsion stability, due to Kabalnov and Weers [43], as a function of such intensive parameters that change the monolayer spontaneous curvature. The predicted extreme sensitivity of emulsion stability on spontaneous curvature is indeed observed. The conclusion is that for these systems it is the growth of the neck that is the rate-limiting step in the coalescence of emulsion drops.

(a) Emulsion life time on a log-scale versus temperature and salinity in the C12E5–water (brine)–octane system. The salinity scan (squares) was performed at a constant T = 19.91 °C. Temperature scans were performed with the middle phase present (filled circles) and the middle phase removed (unfilled circles). The data demonstrate a dramatic reduction in the vicinity of the balance point (T = T0 = 32.65 in the absence of salt). The insert shows schematically the dependence of the activation energy for the hole nucleation on the spontaneous curvature. (b) Detailed behavior around the balance point. Data from Ref. [43].
9 Bilayer fission and fusion
Bilayer fusion and fission are central physiological processes for the communication of cells with its environment. Nerve signals are propagated across synaptic clefts through fission and fusion of vesicles carrying transmitter substances. Some viruses infect cells by transmitting their nucleic acids with the help of a fusion between viral and cellular bilayers. In spite of the importance of the process there are still many unsolved issues concerning the interplay between membrane lipid properties and the protein machinery that controls the fusion/fission. One route towards a deeper understanding is the study of bilayer fusion and fission in simple model systems.
For systems water–alkane–C12E5 a lamellar phase forms over a wide concentration range for temperatures around the balance temperature T0. A more intriguing bilayer phase, the sponge phase, forms when H0 < 0 in systems with excess water and for H0 > 0 in excess oil. The surfactant monolayers can adopt optimal curvature by locally bending as saddles and joining up into bilayer network structure. The topology is similar to that of a bicontinuous microemulsion and it is characterized by a large negative value of the Euler characteristic, χE [44]. A peculiar feature of this phase is that there is a rather stringent relation between the value of the spontaneous curvature and the composition of the phase. As a consequence, the phase is thermodynamically stable over only a very limited range of values for H0 at a given composition [44]. In systems based on the ethylene oxide nonionic surfactants this implies that the phase is stable over a narrow temperature range, of order 1 °C, while it exists over a large concentration range with bilayer volume fractions ranging from 0.03 to 0.4.
A further indication that there are stringent structural requirements in the sponge phase is obtained from light scattering measurements. The osmotic compressibility can change by 30% across the narrow stability range of the phase as the temperature is varied [45–48]. One can use this unusually strong temperature dependence of the osmotic compressibility as an advantage. In a study of the relaxation kinetics even moderate temperature jumps provide detectable changes in the scattering amplitude. Fig. 10 shows a typical T-jump experiment on a sample in the system water + NaCl–decane–C12E5 [49]. NaCl is added to make the system conductive for producing the T-jump through an electrical discharge. Note that even a T change of ΔT = 0.3 °C gives a very distinct change in light scattering intensity. In a systematic study it was found that the slowest relaxation is due to a scalar, q independent, process for bilayer volumes fractions, ϕ, less than 0.22. The relaxation time of this process increases in a remarkable way with decreasing concentration. Between ϕ = 0.20 and ϕ = 0.11 the change in the relaxation time is approximately a factor of 700. For ϕ < 0.11 this relaxation in the system is slower than the temperature relaxation after the T-jump, limiting the study with this particular setup. Fig. 11 shows the variation of the relaxation time with the bilayer concentration.

Typical raw data from a T-jump experiment in a nonionic sponge phase in the C12E5–brine–decane system (apart from a small temperature shift due to the salt, the phase diagram is essentially identical to that in Fig. 4). The bilayar volume fraction, ϕm = 0.11 and ΔT = 0.30 °C. The response of the sample is followed by monitoring the scattered light intensity (b, middle). (a, top) The laser beam intensity and (c, bottom) the residuals from a model fit to the data, shown as a solid line in (b). The linear response fit to the data was done taking into account the temperature relaxation of the instrument. After the initial ms T-jump, the instrument temperature relaxes back on the time scale of ca. 20 s. Data taken from Ref. [49].

Variation with bilayer volume fraction, ϕm, of the structural relaxation time, τm, of the bilayer membrane in a nonionic sponge phase in the C12E5–brine–decane system (circles and squares). Regarding the concentration dependence, two clear regimes (I and II) can be identified. At lower concentrations, regime I, τm shows an enormously strong (exponential) dependence on the concentration, and is interpreted as being governed by the membrane fusion, or topology relaxation, kinetics, τt. At higher concentrations, regime II, the time consuming step is the relaxation of the local excess concentration. Here the q-dependent relaxation rate equals the relaxation rate, τd, measured by dynamic light scattering (DLS, diamond symbols). Data taken from Ref. [49].
The existence of the slow to very slow (ms to s) q-independent relaxation time demonstrates that there are structural changes occurring in the system. An increase in temperature makes the spontaneous curvature H0 more negative. From the basic model of the sponge phase we can conclude that the topology of the bilayer network should change with ΔχE < 0. Such a process involves bilayer fusion. We here define fusion as a process where ΔχE < 0, and where fission then involves ΔχE > 0. The most likely interpretation of the T-jump data is then that we are monitoring a bilayer fission process with a rate that increases sharply with increasing concentration.
The study of the kinetics of the phase change sponge-to-lamellar structure provides an alternative way to study bilayer fusion/fission. Fig. 12 illustrates how one through a T-jump or T-quench can transform between a sponge and a lamellar phase [50]. At these low concentrations the kinetics is so slow that the changes are conveniently monitored by 2H magnetic resonance on samples containing heavy water. In this case it is obvious that the transformation between the two phase-structures involves a change in the bilayer topology through fusion or fission depending on the direction. In Fig. 12 it is seen that the time scale for the phase change is approximately the same in both directions. Furthermore the observed rate is consistent with the values extrapolated to lower concentrations in the light scattering T-jump studies discussed above. The most reasonable interpretation is that also for the phase change it is the fusion/fission that is the rate-limiting step.
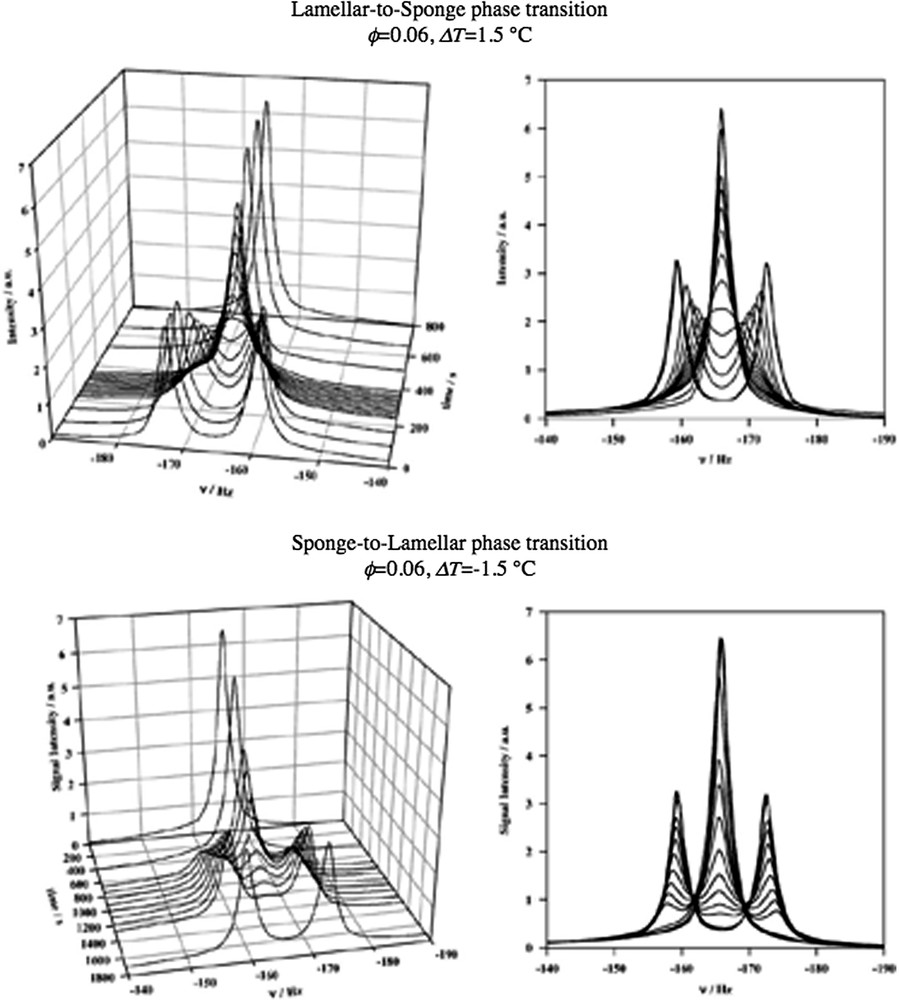
Time resolved deuterium NMR spectra recorded during the lamellar-to-sponge phase transition (top) and the reverse sponge-to-lamellar phase transition (bottom) in the C12E5–water–decane system (Fig. 4). To the left we show a stacked plot of the data. To the right, the spectra are plotted on top of each other. The transformation process depends on the direction of the transition. The sponge phase forms from the lamellar phase by random bilayer fusion events. In the opposite direction, involving bilayer fission, the lamellar phase forms by a nucleation and growth mechanism. Data taken from Ref. [50].
Fusion can also be studied directly in vesicle systems using scattering methods. Vesicles with bilayers of nonionic surfactant differ from the much more studied membrane lipid case in two interesting ways. The bending rigidity is substantially smaller in the nonionic systems. More important, however, is that the monolayer spontaneous curvature is independently known and can be easily modulated by moderate temperature changes. This provides a basis for a quantitative test of theoretical models [42,51,52] of fusion based on the curvature energy concept. Recent work [53] has shown qualitatively that the spontaneous curvature has a strong influence on the rate of vesicle fusion. A lamellar phase can in dilute conditions be dispersed into kinetically stable unilamellar vesicles, while this is not the case for the sponge phase. Hence, kinetic vesicle stability requires H0 > 0, as suggested by fusion models.
10 Conclusions
We have shown how one can use microemulsions to study a number of fundamental problems in the physical chemistry of solutions. Although microemulsions are commonly referred to as complex liquids this complexity can in many cases be turned into an advantage and the systems turn out to be simpler than the “simple liquids”. In the microemulsion the role the single molecule has in simple liquids is taken by the surfactant monolayer. This object can appear with varying size, shape and topology. However, the Helfrich curvature free energy provides a very useful tool for calculating the energetics of the various monolayer configurations. It was de Gennes and Taupin [8] who pioneered this very useful approach.