

1 Introduction
Over the past decade nanocomposite materials comprising metal nanoclusters embedded in an organic medium have gained considerable attention. These materials possess many specific properties, pertaining to their structure, thermodynamics and electronic, spectroscopic, optic, electromagnetic and chemical features. Composite nanoparticle/polymer materials combine the sensitivity and response of polymers to external stimuli (e.g., polymer swelling in the presence of vapors or gases) with the charge transport ability of the metal nanoparticles, thus allowing creation of materials with tunable stimuli-responsive conductivity. The possibility of tuning the chemical and electrical properties of these materials by systematically varying the size, structure, and composition of the constituents renders them not only interesting for scientific investigation, but makes them increasingly attractive for technological applications such as nanoelectronics, catalysis, and chemical sensing [1–5].
Au-nanoparticle/dendrimer nanocomposite films are stimuli-responsive materials. It was shown that the conductance of these films is strongly affected by sorption of chemical species from the vapor phase, which makes these materials good candidates for highly sensitive and selective chemical sensors [6–8]. Today, it is assumed that swelling and changes in the permittivity of the film as a consequence of analyte sorption are the major factors that account for the response of such nanoparticle/organic sensors to dosing with gaseous analytes. Thus, for enabling a quantitative understanding of the films' sensitivity it is necessary to quantify both the structural changes and the distribution of adsorbed vapor molecules in the film.
Here we summarize the structural changes upon vapor sorption in Au-nanoparticle films prepared with two dendrimers with different solvent affinity (Fig. 1). Poly (amidoamine) (PAMAM) dendrimer third generation was used as organic component in AuPAMAM films. Poly (propylene imine) (PPI) fourth generation dendrimer was used as organic component in AuPPI films.
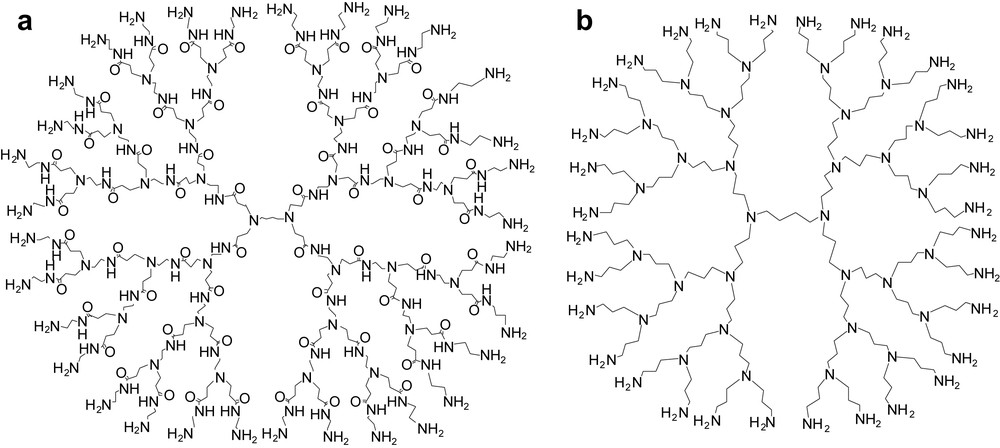
Structural formulas of the dendrimers used as linkers of the Au nanoparticles: a) third generation poly (amidoamine) dendrimers (PAMAM); b) fourth generation poly (propylene imine) dendrimer (PPI).
Neutron reflectometry [9–11] was used as the main tool in the present study. The method has been applied for analyzing the structure and swelling of polyelectrolyte layers [12,13], composition variations in thin polymer films caused by chemical reactions [14] or solvent diffusion [15]. Neutron reflectivity (NR) experiments provide structural information in the direction z perpendicular to the film surface over a length scale of 1–500 nm with a resolution down to about 0.2 nm. Neutrons possess strong penetration power as a consequence of their weak interaction with almost any material. Their sensitivity to different isotopes allows measuring the composition profiles along the z direction. An important advantage of the methodology, as compared to X-ray methods, is the absence of sample damage, even upon prolonged exposure to the neutron beam.
The specular neutron reflectivity method is based on the variation in the specular reflection at the interface between two phases with the wave vector transfer Q = 4πsin θ/λ, where θ is the angle of incidence of the neutron beam and λ is the neutron wavelength. The variation of the reflectivity R with Q (the reflectivity profile) depends also on the scattering length density profile ρ(z), according to Eq. (1) [9,16]. The scattering length density (SLD) is given by , where bi is the neutron scattering length, and Ni is the number density of the ith sort of nuclei.
| (1) |
Here we report results from specular neutron reflectivity experiments which were performed to study the composition profiles in thin self-assembled Au-nanoparticle/dendrimer films under the influence of solvent vapors with different polarity (water, methanol, and toluene) as external stimuli.
2 Materials and methods
2.1 Film fabrication
AuPAMAM or AuPPI films were deposited via layer-by-layer (LbL) self-assembly from nanoparticle dispersions and dendrimer solutions as described elsewhere [6]. Dodecylamine-stabilized Au nanoparticles with an average diameter of about 4 ± 2 nm prepared by a wet chemical synthesis [17] were used as inorganic component. Third generation poly (amidoamine) dendrimers (PAMAM) or fourth generation poly (propylene imine) dendrimer (PPI) (both from Aldrich, Germany) were used as organic component that served to interlink the nanoparticles. The structural formulas of the PAMAM and PPI dendrimers are shown in Fig. 1.
The films were deposited onto 2 inch BK7 glass wafers (CrysTec GmbH, Berlin, Germany). The substrates were plasma-cleaned before deposition and immersed in a toluene solution of aminopropyldimethylethoxysilane for surface activation. The films were assembled via repetitive exposure of the substrates to Au nanoparticles and dendrimers. This was done by first dipping the substrates for 15 min in a dispersion of Au nanoparticles in toluene, rinsing with toluene, and then dipping for another 15 min in dendrimer solutions in methanol. This procedure was repeated 14 times for AuPAMAM and 10 times for the AuPPI films. The layer-by-layer deposition was always terminated after a dendrimer solution treatment.
2.2 Neutron reflectivity
Neutron reflectivity measurements were performed at the V6 reflectometer at the Hahn-Meitner Institute, Berlin. A detailed description of the instrument is given elsewhere [18]. The reflectometer had a vertical scattering geometry. The neutron wavelength was fixed at λ = 4.66 Å. The incoming beam geometry was defined by two adjustable slits between the monochromator and the sample. The scattered neutrons were recorded with a 3He detector. The incoming intensity was measured simultaneously using a monitor placed directly in the incident beam path. The reflectivity, which is the ratio between the detector counts and the monitor counts, was measured as a function of the angle of incidence θ. A beam of rectangular cross-section 0.5 × 40 mm2 incident on the sample was set by the slit system on the sample side and was not changed during the data acquisition.
The measurements were performed in θ/2θ geometry in a Q range up to 0.12 Å−1. Each scan lasted typically 5–7 h of beam time. The resolution of the measurements was always better than ΔQ = 0.002 Å−1. The background signal was collected simultaneously with a detector offset from the specular position by 0.44° towards larger scattering angle. It was directly subtracted from the specular signal to obtain the background corrected intensity. The reflectivity data were footprint corrected for the varying flux on the sample as θ increased and normalized to the measured incident intensity to obtain the reflectivity R(Q).
The reflectivity curves were analyzed by applying the standard fitting routine Parratt 32 [19]. The program calculates the optical reflectivity of neutrons from flat surfaces. The calculation is based on the Parratt recursion scheme for stratified media [20]. The film was modeled as consisting of layers of specific thickness and SLD. The model reflectivity profile was calculated and compared to the measured one. Then the model was adjusted to the best chi-square fit to the data. Our fitting strategy was to use the simplest physically reasonable model to describe the experimental data. The thickness d, scattering length density profile ρ(z) and the interfacial roughness σ of each layer were obtained from the fits. The errors in the parameter values were set in accordance to a level of 10% increase in chi-square. The best fit parameters to the experimental reflectivity data are shown in the Appendix.
A home-built gas-tight experimental chamber [21] for neutron reflectivity studies on solid/gas interfaces was used. Deuterated water D2O (99.0% isotope enrichment, Aldrich, Germany), and perdeuterated toluene-d8 (98.5% isotope enrichment) and MeOH-d4 (99.5% isotope enrichment) from Deutero GmbH, Kastellaun, Germany were used to produce solvent vapors. Saturated vapors were created by dropping ca. 0.5 ml of the solvent into a small glass pan placed directly in the experimental chamber.
The specular reflectivity from each sample was measured first under dry nitrogen (N2, purity 5.0) in order to yield reference data. Then the sample reflectivity was measured in different solvent vapors. The sample was purged with dry nitrogen for at least 12 h in order to ensure complete desorption of the vapor between the exposures to the different analytes. The reversibility of the adsorption/desorption process was checked for each sample by comparing the reference reflectivity curves measured in dry N2. These were always identical showing a complete reversibility of the sorption process. At least three consecutive scans over the entire Q range were carried out for each analyte to prove whether the film had reached equilibrium with its surroundings. Only the last reflectometry curves which correspond to the final equilibrium state of the sample are shown in the present paper. All experiments were performed at room temperature.
3 Results and discussion
The reflectivity from a bare interface decreases inversely proportional to Q4. When a layer of a certain material is deposited onto the bare interface, the reflectivity profile R(Q) becomes an oscillating function with a period of oscillations depending on the thickness of the layer. The amplitude of the fringes depends on the change of ρ(z) across the interface. Damping of these fringes indicates high roughness of the interface or smaller contrast between the film and the substrate. The information that can be extracted in a single experiment from a neutron reflectivity curve includes the film thickness d, the surface roughness at the film/gas interface σ and the scattering length density profile ρ(z) across the film. The latter can be converted into a concentration profile, and thus gives information about the species distribution within the film.
Neutron reflectometry curves of the AuPAMAM and AuPPI films in dry N2 and saturated solvent vapors are shown in Fig. 2. Strong differences in the reflectivity of the dry and the vapor dosed films were observed, suggesting variation in both film thickness and composition upon sorption. The changes in the reflectivity profile R(Q) caused by the sorption of the vapor are different for any particular analyte and film, revealing potential dissimilarities in the film/analyte interactions in each experiment.
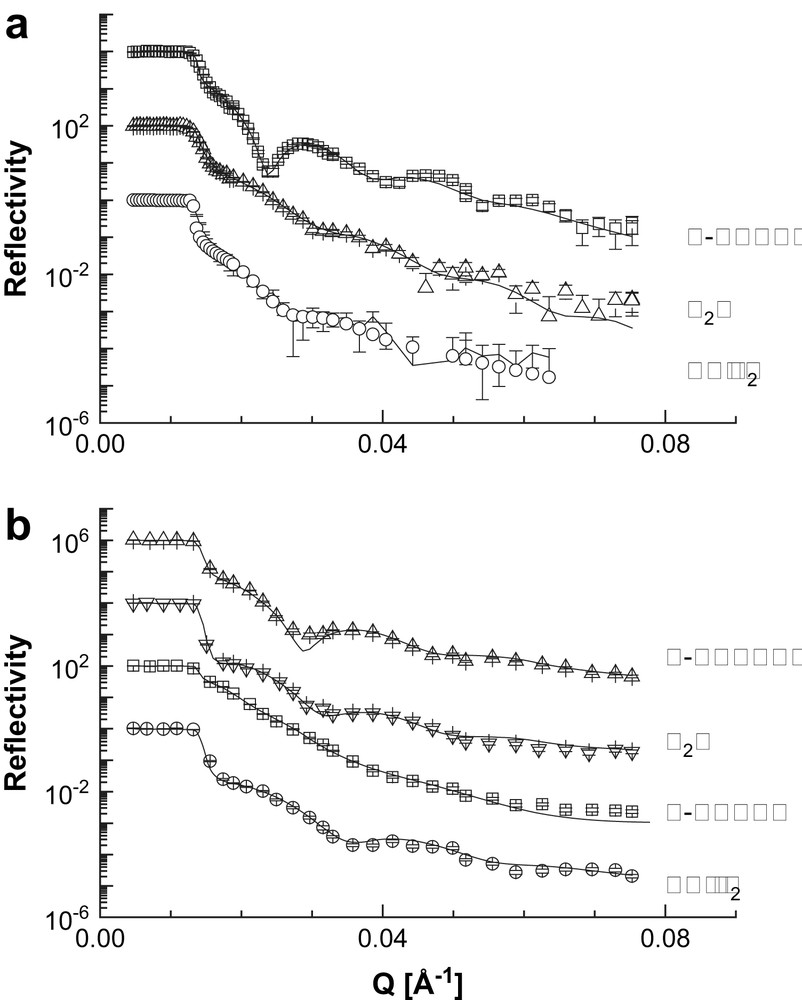
Neutron reflectometry curves (points) and best fits to the experimental results of the studied samples at different conditions (solid lines): a) AuPAMAM films; b) AuPPI films. The curves are shifted along the reflectivity axis for clarity.
The best fits to the reflectivity curves in dry N2 were always obtained using a single box model with finite surface roughness. This model suggests that the film comprises a single layer with a thickness of 36.6 nm for the AuPAMAM sample and 27.8 nm for the AuPPI film. The SLD of the dry sample is homogeneously distributed through the film and it is 1.56 × 10⁻⁶ Å−2 in case of the AuPAMAM film and 1.70 × 10⁻⁶ Å−2 for the AuPPI film, respectively. The SLD profiles for the two samples in dry N2 are shown in Figs. 3, 5 and 6 to be compared with the profiles of the films when exposed to the solvent vapors.
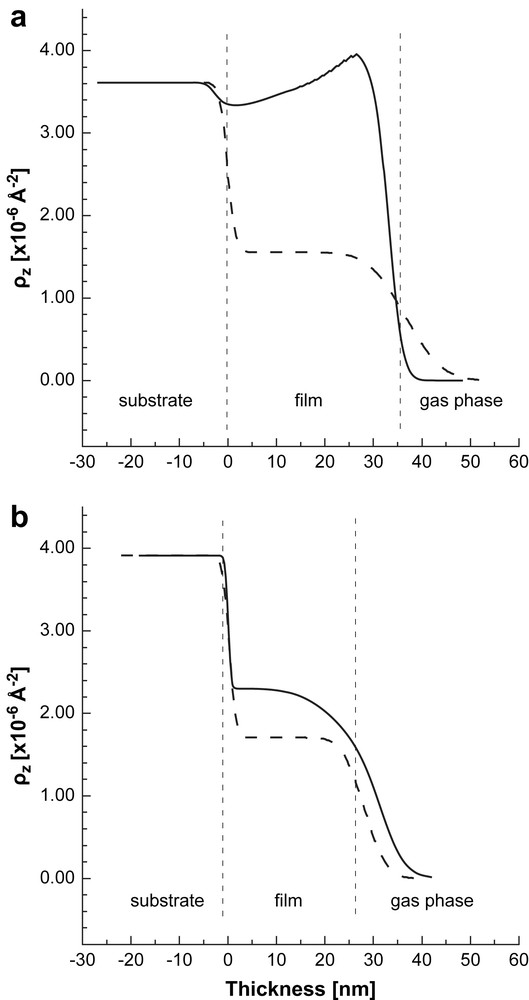
SLD profile of the films exposed to D2O (solid line). The SLD profiles of the dry films are shown for comparison (dashed lines). a) AuPAMAM films; b) AuPPI films. Non-uniform SLD distribution (respectively, vapor distribution) is seen in both cases. The vertical dashed lines are guides for the eye. They represent approximately the thickness of the dry composite Au/dendrimer film. The structure of the wet film is more complex and contains different sub-layers which are not presented (see the text for details).
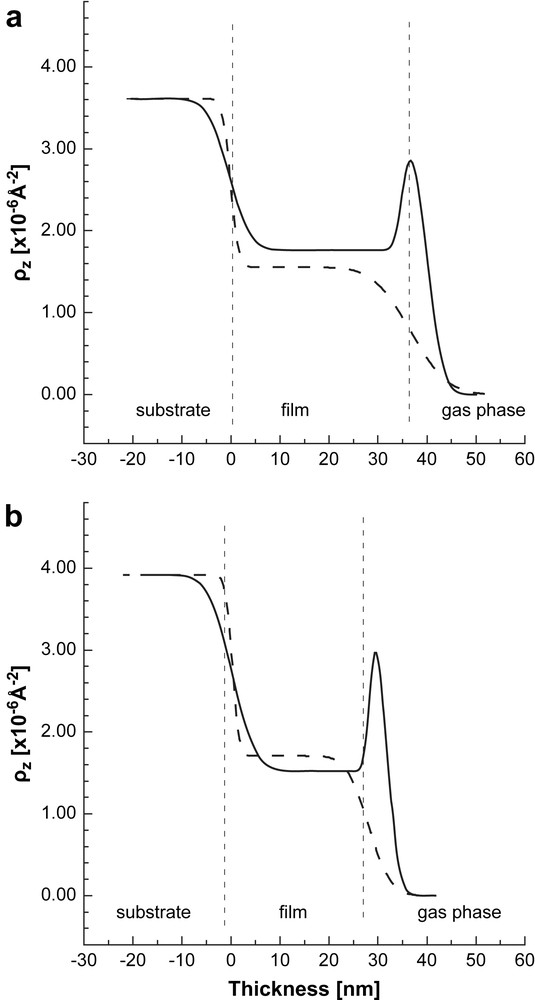
SLD profile of the films exposed to toluene-d8 (solid line). The SLD profiles of the dry films are shown for comparison (dashed lines). a) AuPAMAM films; b) AuPPI films. Non-uniform distribution of the SLD (respectively, vapor distribution) is seen in the two cases. The vertical dashed lines are guides for the eye. They represent approximately the thickness of the dry composite Au-dendrimer film. The structure of the wet film is more complex and contains different sub-layers which are not presented (see the text for details).
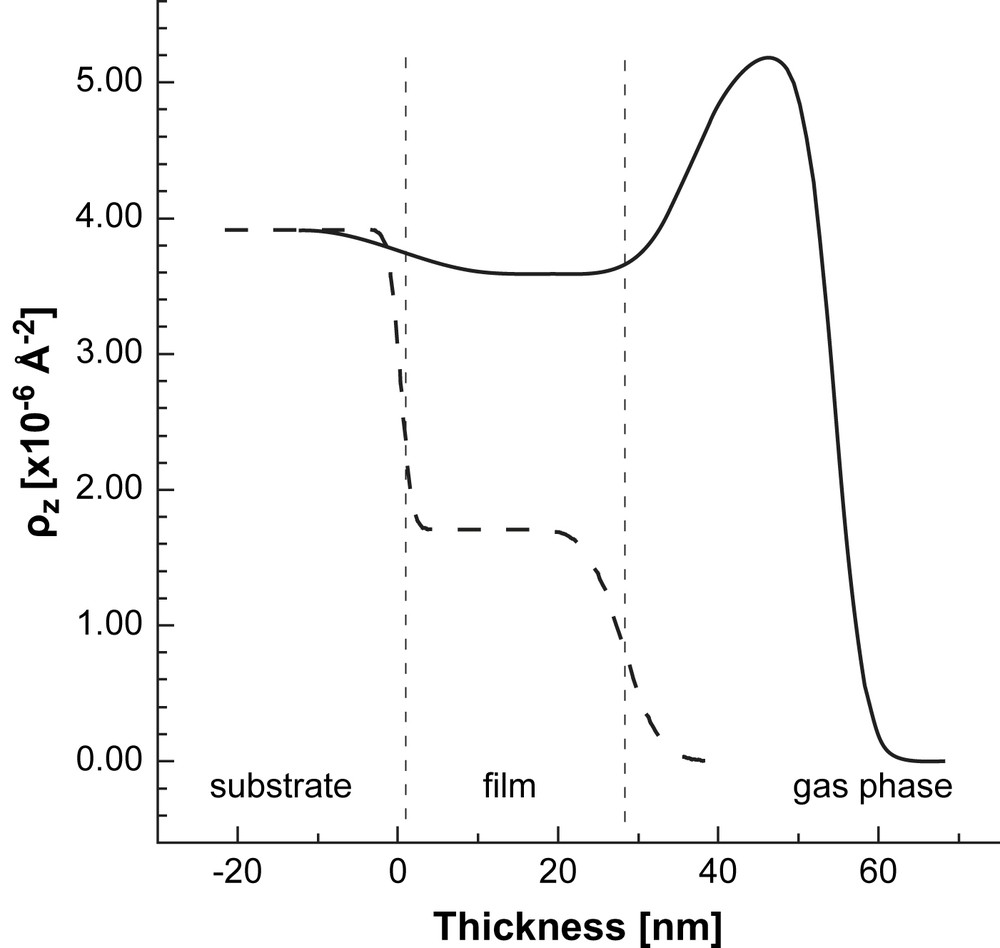
SLD profile of the AuPPI film upon exposure to MeOH-d4 (solid line). The SLD profile of the dry film is also shown for comparison (dashed lines). The vertical dashed lines are guides for the eye. They represent approximately the thickness of the dry composite Au-dendrimer film. The structure of the wet film is more complex and contains different sub-layers which are not presented (see the text for details).
In contrast to the SLD profiles of the dry films, more complex models were required to fit the R(Q) curves of the film dosed with solvent vapors. In all vapor dosing experiments the best fit to the data was obtained using multiple box models, which approximate the film as consisting of up to three layers each with a finite thickness and a characteristic SLD profile.
The scattering length density of the dendrimer film in presence of vapors is directly related to the number of adsorbed solvent molecules. Considering the film as a homogeneous void-free system, can be expressed as:
| (2) |
3.1 Water dosing experiments
The SLD profiles of the films dosed with D2O are shown in Fig. 3 together with that of the dry films for comparison. The reflectivity data for the AuPAMAM sample were modeled by using a three-layer model. The SLD of all layers is much higher than that of the dry film showing strong sorption of D2O in these regions of the film. The first layer has constant low scattering length density of 3.02 × 10⁻⁶ Å−2 and a thickness of 4.3 nm. It is located at the film/substrate interface and represents the innermost interfacial region of the film. The second layer is the thickest one (d = 24.1 nm) with a SLD of 3.97 × 10⁻⁶ Å−2. Its SLD decreases exponentially with increasing distance from the film/gas interface. The third layer is located at the film/gas phase interface (d = 8.0 nm and ). This layer represents the outermost interfacial region of the composite film which accumulates lower amount of D2O. This layer is quite thin and difficult to be observed in the SLD profile shown in Fig. 3a.
The SLD profile for the AuPPI film is also not uniform. Compared to the AuPAMAM film the change in SLD is much lower indicating less sorption of water in the film. The SLD profile comprises two regions. The inner layer next to the glass substrate has a SLD higher than that of the dry film. Its thickness is about 2 nm smaller than that of the dry film. The second layer with a thickness of about 6 nm is located at the film/vapor phase interface. Contrary to the case of the AuPAMAM film, this interfacial layer has a SLD that is lower than the SLD of the inner layer. This suggests that the layer is D2O poor, but contains some D2O as its SLD is higher than that of the dry film.
In another experiment the kinetics of D2O sorption in the AuPAMAM film was followed by the NR experiments in order to estimate the speed at which the sorption equilibrium is reached. The reflectivity from the sample was recorded with the time at fixed angle of incidence in θ/2θ geometry of the instrument (Fig. 4). The experiment was performed at Q = 0.027 Å−1. This is the Q value at which the maximum difference in the reflectivity of the dry AuPAMAM sample and the D2O vapor dosed sample is observed (see Fig. 2). In this particular experiment change in the reflectivity is directly related to the change in the SLD of the sample and, respectively, the amount of sorbed D2O. The reflectivity increases very fast in the first 10 min indicating fast adsorption of the D2O vapors. The sorption equilibrium is established after about 3 h.
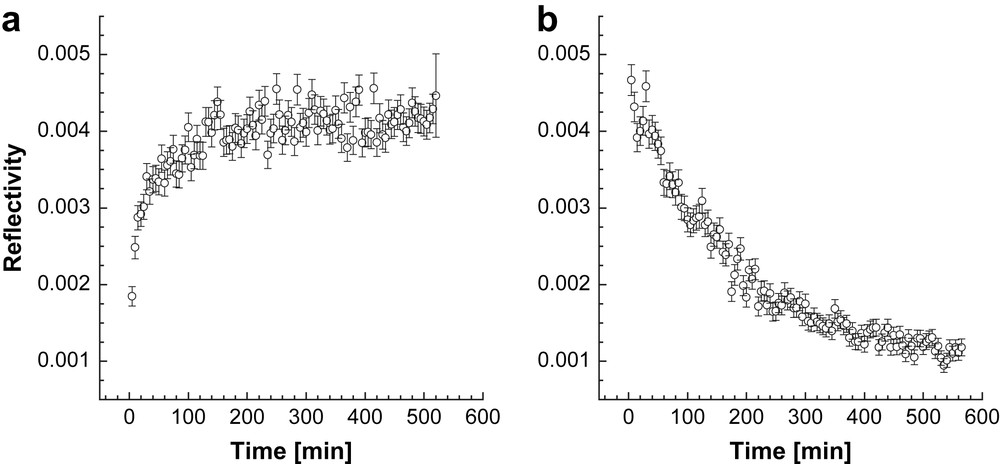
Time dependence of the neutron reflectivity at a fixed Q = 0.027 Å−1 from an AuPAMAM film when exposed to D2O vapors. Panel a) shows the experiment upon dosing with D2O vapors (adsorption) and panel b) presents the process of desorption when the sample was exposed again to dry N2.
The adsorption experiment was followed by a desorption one. In this case the sample was exposed to dry N2. The desorption process also takes about 3 h until reaching equilibrium, but it is not so fast in the first 10 min of the experiment compared to the adsorption process. This experiment shows a fast and completely reversible adsorption/desorption process. This observation correlates with previous results which show that these Audendrimer composite materials can be used as fast responsive vapor sensors [6,7].
3.2 Toluene dosing experiments
We chose toluene as an alternative to water as a solvent with well pronounced hydrophobic character. The experiments were performed with perdeuterated toluene in order to get high contrast between the different layers in the studied system. Strong change in the reflectivity compared to that of the dry sample was observed. The Kiessig fringes become more pronounced and their width decreases (see Fig. 2).
The data for the AuPAMAM and AuPPI films were fitted with two-layer models, in which each layer had a constant scattering length density. There is a good agreement between the experimental data and the model predictions (solid lines in Fig. 2), which indicates that the film structure is reasonably described by this model. The calculated SLD profiles are summarized in Fig. 5 for both samples. The exposure of the films to toluene leads to the formation of two well distinguishable regions. The thickness and SLD of the inner layer near the substrate are equal to those of the dry film within experimental error, indicating that no significant adsorption of toluene in the bulk and no film swelling take place. The second layer at the film/vapor phase interface has a SLD that is higher than that of the inner layer and of the dry sample, but only about half of the SLD of the pure toluene-d8. We assume that this layer resembles a polymer layer enriched on toluene at the film surface.
3.3 Methanol dosing experiments
We used perdeuterated methanol as a solvent with amphiphilic character. Dosing experiments with MeOH-d4 were performed only with the AuPPI sample, since we expect the highest influence of methanol sorption in the film comprising the amphiphilic PPI polymer. The results show a strong difference in the experimental reflectivity curves of the dry and the vapor dosed sample (Fig. 2). The fine structure of the R(Q) curve is lost and the characteristic Kiessig fringes become almost indistinguishable.
The SLD profile of the “wet” film obtained after fitting the R(Q) data with a two box model is shown in Fig. 6. The SLD profile of the dry film is also presented for comparison. The thickness and the SLD become much higher than that of the dry sample showing strong swelling and adsorption of MeOH-d4 in the AuPPI film. Two regions with different SLD were distinguished. The first one with a thickness of 35.8 nm, close to the glass substrate, represents the bulk of the film. The SLD of this layer is almost twice higher than that of the dry film and approaches the SLD of the glass substrate. This results in a decrease in the contrast between the substrate and the AuPPI layer and may explain the observed smearing out of the fine details in the R(Q) curve in presence of MeOH-d4. A thinner second layer is located at the sample/vapor phase interface on top of the first layer. Its SLD of 5.20 × 10⁻⁶ Å−2 is close to that of the pure MeOH-d4 (), indicating that it consists mainly of pure solvent. We guess that this is a wetting layer of MeOH-d4 condensing on top of the film. The formation of such a wetting layer should be facilitated by the similar polarity of the alcohol soaked AuPPI film and the MeOH solvent. Further experiments will be required to quantify this assumption.
Based on the obtained experimental results, the following picture of the interaction between the Au-nanoparticle/dendrimer films and the solvent vapors as external stimuli can be drawn.
Both films have well expressed affinity to water. A significant amount of D2O is absorbed in the bulk of the film. The difference in the absolute amount of sorbed water correlates with the chemical structure of the two dendrimers. The more hydrophilic PAMAM adsorbs about 3 times more water than the more hydrophobic PPI. The D2O concentration varies across the film thickness, showing that the analyte is not evenly distributed in the bulk of the film. A layer of lower water content is formed at the film/vapor phase interface in both cases, indicating an existence of less densely packed organic layer at the film surface. This correlates with the fact that both AuPAMAM and AuPPI films are terminated by dendrimer molecules which may entangle toward the gas phase and may account for the more hydrophobic character of this interface.
In contrast to water dosed films, the profile of the toluene-d8-dosed films shows that the diffusion of this analyte is limited to a thin region near the film/gas phase interface. Outside the interfacial region no significant diffusion of toluene molecules occurs in the bulk. The formation of a layer with a high scattering length density is attributed to a thin toluene-d8 reach layer at the film/gas interface.
Methanol as a solvent with transitional hydrophilicity shows intermediate behavior when interacting with the studied films. A large amount of MeOH is adsorbed within the bulk of the amphiphilic AuPPI film. In addition, a MeOH rich layer is formed at the film/vapor phase interface. Similar behavior is expected in the case of MeOH/AuPAMAM system due to the similarity in the chemical composition of the two dendritic polymers.
4 Conclusions
In the present study we report on the film structure and analyte distribution in AuPAMAM and AuPPI films on glass substrates studied by the NR technique. We selected these systems because of their ability to measurably respond to vapor dosing with analytes that span a broad polarity range, varying from non-polar toluene to polar water. PAMAM and PPI dendrimers used as organic film component are especially suitable for establishing a quantitative correlation between the solubility properties of the dendrimer and the polarity of the solvent. NR was used to get a clearer insight into the distribution of the vapor molecules across the film thickness. This was achieved by utilizing the higher contrast difference between the protonated polymer matrix and the vapors of the deuterated analytes.
The interaction between the film and the vapor is mainly governed by the chemical nature of the organic film component. The PAMAM and PPI dendrimers contain a great number of polar amide and tertiary amine groups interconnected via short aliphatic segments. These groups can act as receptor sites, which are capable of forming hydrogen bonds with proton-donating molecules like water. The more amphiphilic character of PPI is caused by the higher fraction of propylene chains in its molecule. The latter is responsible for the observed strong affinity to methanol. At the same time, the fraction of aliphatic segments in the PAMAM and PPI molecules is insufficient to enable strong interactions with non-polar molecules like toluene.
Since this work is largely based on neutron reflectometry we would like also to address the advantages of this technique compared to easier accessible ones like optical reflectometry or ellipsometry. The contrast change by these optical techniques relies on refractive index variation which is typically less than 10% for the studied systems. The neutron scattering length density, however, varies by more than a factor of 3, and therefore could make use of the higher scattering contrast. Also, as we show in Figs. 5 and 6, neutron scattering yields high local resolution along the surface normal, which is not achievable by ellipsometry or optical reflectometry. Hence, although we and others make generally use of the combination of techniques the salient features of neutron reflectometry has been highly beneficial resolving details of film response to vapors. These are very important to understand the mechanism of conductance change in Au-nanoparticle/dendrimer films used as chemiresistive vapor sensors.
Acknowledgement
BENSC at Helmholtz Centre Berlin for Materials and Energy (former Hahn-Meitner Institute, Berlin) is acknowledged for the allocated beam time at the instrument V6 to perform the neutron reflectometry experiments. Tobias Vossmeyer and Akio Yasuda are acknowledged for the helpful discussions.
Appendix
Best fit parameters to the experimental reflectivity data of the Au/PAMAM film in dry nitrogen, and saturated D2O and toluene-d8 vapors
| Environment | Model | Thickness, nm | SLD, 10−6 Å−2 | σfilm/gas phase, nm | σfilm/substrate, nm |
| Dry N2 | One layer | 36.6 ± 0.8 | 1.56 × 10⁻⁶ | 5.9 | 1.5 |
| D2O | Three layer | 4.3 ± 0.2 | 3.02 × 10⁻⁶ | 1.9 | – |
| 24.1 ± 0.5 | 3.97 × 10⁻⁶ (exp. decay) | – | – | ||
| 8.0 ± 0.7 | 3.22 × 10⁻⁶ | – | 1.5 | ||
| Toluene-d8 | Two layer | 4.9 ± 0.2 | 3.38 × 10⁻⁶ | 2.5 | – |
| 35.6 ± 0.5 | 1.80 × 10⁻⁶ | – | 3.5 |
Best fit parameters to the experimental reflectivity data of the Au/PPI film in dry nitrogen, and saturated D2O, toluene-d8 and MeOH-d4 vapors
| Environment | Model | Thickness, nm | SLD, 10−6 Å−2 | σfilm/gas phase, nm | σfilm/substrate, nm |
| Dry N2 | One layer | 27.8 | 1.7 | 3.6 | 1.1 |
| D2O | Two layer | 25.1 | 2.3 | – | 7.4 |
| 6.7 | 1.2 | 3.6 | – | ||
| Toluene-d8 | Two layer | 28.1 | 1.5 | – | 1.0 |
| 3.4 | 3.8 | 2.0 | – | ||
| MeOH-d4 | Two layer | 35.8 | 3.6 | – | 4.9 |
| 17.9 | 5.2 | 3.1 | – |