

1 Introduction
Titanium dioxide TiO2 is a strategic material in many fields of materials chemistry [1]. Owing to its large refractive index (nD = 2.7 and 2.55 at 590 nm for rutile and anatase polymorphs respectively), it is widely used for making white pigments [2] or high-refractive-index coatings on silica glasses [3]. With its well-sized band gap (Eg = 3.1–3.2 eV) [4], it may be used in the photoelectrolysis of water [5] and leads to economically credible photocatalysts [6], gas sensors [7] or photovoltaic devices [8]. Moreover, upon UV irradiation TiO2-containing materials may become superhydrophilic leading to self-cleaning materials [9]. When mixed with an alkaline earth oxide (MgO, CaO, SrO, BaO), TiO2 leads to a wide array of ferroelectric [10], piezoelectric [11] and pyroelectric [12] high-tech ceramics for electronic applications. Finally, if mixed with polymers, original organic–inorganic hybrid materials may be readily obtained, combining in a single phase important properties such as high transparency (glasslike), low temperature processing (polymer-like) and sufficient thermal stability (ceramic-like) [13]. In all the above applications, the starting molecular precursors of titanium oxide are usually titanium tetra-alkoxides mixed with various chemical additives in order to finely tune the hydrolytic behavior of these highly reactive species and the final processing of the resulting sol or gel phase [1]. The pioneer work of J. Livage's group in this domain is worth noticing and was initiated by suggestion from André Vioux about the use of acetic acid in order to monitor and control the hydrolysis and condensation of titanium(IV) alkoxides in order to obtain monolithic TiO2 gels under reproducible conditions [14]. Thanks to the top-level expertise of J. Livage's group in spectroscopy, it was then quickly demonstrated through the use of ESR [15], IR [16], XANES/EXAFS [17] and 13C CPMAS NMR [18] that a change of coordination number from 4 or 5 in Ti(OR)4 up to 6 in TiOx(OR)y(OAc)z derivatives was the key point allowing orientation of the polycondensation process leading to TiOTi bonds towards a gel instead of a precipitate. With the use of acetic acid as a gelling agent, it was thus possible to synthesize not only homogenously Cr3+ and Al3+-doped TiO2 photoanodes for the photoelectrolysis of water [19] but also to initiate a very fundamental research through the establishment of a Partial Charge Model (PCM) putting onto a quantitative basis some crucial ideas concerning the nature of the chemical bond along the lines suggested by L. Pauling or R.T. Sanderson [20–23]. It is worth noting that this PCM approach of chemical reactivity has been validated by other groups in the case of antimonates, phosphates, molybdates, ferrates or stannates [24], silicates [25], aluminates [26] but seems to fail in the case of alkoxides bearing a lone pair such as tellurium alkoxides Te(OR)4 [27]. With the help of this PCM, it was thus possible to rationalize the solution and sol–gel chemistry of most metallic species in both aqueous and non-aqueous solvents based on the sole knowledge of stoichiometric coefficients. On one hand, this was a great advantage, as in most cases, the detailed molecular structure in solution or the gel state remains unknown. On the other hand, it was soon realized by working at low hydrolysis ratios (h = H2O/Ti < 1) that single-crystals could be easily grown from solutions allowing a much better understanding of the structural chemistry involved during the very first steps of a titania-based sol–gel process. The original PCM approach, unable to take into account the detailed molecular structure was thus regarded with more and more scepticism, more particularly by people deeply involved in NMR spectroscopy or in ab initio calculations. A survey of the literature devoted to NMR studies of crystalline titanium(IV) oxo-alkoxides show that four types of nuclei have been studied: 1H, 13C, 17O and 47,49Ti. Very few results have been reported concerning 47Ti and 49Ti NMR owing to the rather large quadrupolar moment of these two nuclei. This comes from the fact that TiO6 or TiO5 polyhedra are usually strongly distorted relative to their corresponding ideal regular geometry leading to large electrical field gradients at the titanium center and thus to very broad signals. Consequently, titanium NMR is limited to symmetric tetrahedral species, such as TiCl4 (NMR reference) or Ti(OiC3H7)4 and Ti(OCH2tC4H9)4, characterized by δ(49Ti) = −854 ppm and δ(47Ti) = −1120 ppm [28]. Owing to the fast exchange between terminal and bridging positions, 17O NMR is not very informative for non-hydrolyzed titanium alkoxides that are just characterized by a deshielding of about 250 ppm from the parent alcohol [29–30]. This is no more true for titanium oxo-alkoxides where a very clear differentiation between oxo groups is usually observed: δ(OTi2) = 650–850 ppm, δ(OTi3) = 450–650 ppm and δ(OTi4,OTi5) = 250–450 ppm [31,32]. These characteristic signatures may thus be used to follow the start of these oxo cores during the design and synthesis of hybrid organic–inorganic materials [32]. However, a severe limitation of the technique comes from the fact that only a few signals are usually observed and that natural abundance 17O NMR can be performed only on non-viscous solutions. For gels or xerogels where solid state NMR is required, isotope enrichment is mandatory, preventing tone performing routine analysis on these compounds. 1H NMR techniques are also not very convenient owing to the very limited chemical shift range and to large dipolar couplings in the solid state. In solution one usually get either quite deceptive spectra in the fast exchange limit (0.5–0.7 ppm deshielding relative to the parent alcohol for TiOCHx protons) or very complex spectra in the slow exchange limit owing to the numerous scalar couplings. Consequently, with its one-half spin associated to a large chemical shift range and dilute spin situation, the best nucleus remains 13C owing to the easy routine access to high-resolution spectra both in solution and in the solid state. A survey of literature shows that if well resolved 13C NMR spectra are very often reported for titanium oxo-alkoxides a complete attribution of the observed signals is rarely given. This comes from the fact that these polynuclear crystalline complexes are quite sensitive to moisture and usually obtained with very small yields, preventing one to perform detailed NMR studies. With this background in mind, the aims of this contribution written to celebrate the 70th anniversary of J. Livage are the following.
Perform a full spectroscopic study of a tetranuclear Ti(IV) complex absorbing in the visible part of the electromagnetic spectrum that may be routinely obtained with large yields and displaying very good hydrolytic stability [33]. One of the main application for such a molecular precursor would be to dispose of a stable {Ti4O16} inorganic core that could be used (with or without further functionalization) in hybrid organic–inorganic devices relying of the well-known properties associated with the existence of TiOTi bonds. Accordingly, by shifting the edge of light absorption from the UV range towards the visible range, a considerable enhancement of the quantum yield for the conversion of light into electricity or of the photocatalytic properties may be anticipated. Moreover, being perfectly stable and inert towards moisture, this precursor could be used in any kind of sol–gel process in big contrast with more reactive and labile titanium(IV) (oxo)-alkoxides.
Another aim of this paper is to show that the PCM approach, 20 years after its first introduction in close collaboration with J. Livage, has been considerably improved to a level where prediction of 13C NMR shifts directly from the knowledge of the molecular structure becomes possible. Accordingly, computation of 13C NMR shifts is a considerable scientific challenge owing to the well-known extraordinary sensitivity of this nucleus to any change of the structure. The ability to reproduce experimental shifts is thus a very stringent test of the validity and quality of the partial charges distributions computed from an electronegativity equalization principle. In order to perform such a demonstration, we must dispose of a stable polynuclear Ti(IV) complex giving rise to a large number of 13C NMR lines. The molecular structure of titanium(IV) alkoxides in solution is also a major concern in sol–gel chemistry and we will show how to handle this difficult problem with the PACHA approach using a rigorous statistical thermodynamic approach.
2 Materials and methods
2.1 Synthesis
In order to get reproducible NMR spectra, the synthesis of a previously reported [33] titanium(IV) oxo-aryloxide (1) has been optimized:
| 4 Ti(OEt)4 + 6 H3bhmpc + 2 H2O + 2 C4H8O2 → 14 EtOH + {[Ti2O(bhmpc)(Hbhmpc)(H2bhmpc)].C4H8O2.EtOH}2 (1) |
First, a solution made from 15 ml of 1,4-dioxane and 5 ml of ethanol and containing 0.8 g (4.76 mmol) of 2,6-bis(hydroxymethyl)-p-cresol (H3bhmpc, 4.76 mmol) and 0.021 mL (1.20 mmol) of water was prepared. After complete dissolution of the ligand, 0.5 ml (2.38 mmol) of Ti(OEt)4 were added under a nitrogen atmosphere in a plastic bag. The resulting orange solution was magnetically stirred for 10 minutes and then left overnight leading to an abundant precipitation of orange-colored rod-shaped crystals. Fig. 1 (top left) shows that (1) is a centro-symmetric molecule built from a planar {Ti4(μ3-O)2}assembly of four TiO6 octahedra sharing edges and surrounded by three pairs of aromatic ligands. The overall shape of (1) may be described as a doubly fused calix[3]arene (Fig. 1, bottom left) where the organic joints have been replaced by Ti-atoms. Owing to the existence of these two divergent cavities and to the fact that aromatic ligands are found under three different protonation states (bhmpc, Hbhmpc and H2bhmpc), solvent molecules (dioxane and ethanol) are found to be associated through hydrogen bonds to the complex (Fig. 1, right). The complete energetic characterization of both the intra- and intermolecular H-bonding scheme in this kind of complex has been studied elsewhere [1,33]. It is worth noticing that another structure may be obtained after recrystallization of (1) in CHCl3, where CHCl3 molecules are trapped instead of EtOH [33]. This structure exhibits two non-equivalent complexes per unit cell, differing essentially by their interactions with solvent molecules, but with the same molecular structure, identical to the molecular entity found in the as-synthesized compound. As explained above, the correlation between the electronic densities derived from the crystalline structure of (1) in the solid state and the NMR parameters measured when (1) in dissolved in CDCl3 will also be studied. Thus, it was assumed that the presence of the interaction between the complex and EtOH (in the solid) or its absence (when the complex is surrounded by CDCl3 molecules in solution) does not influence too much electronic densities at C-sites, so that calculations based on solid-state structures can be reasonably correlated to 13C parameters of the complex in solution. As will be discussed below, this rough assumption appears to be valid for the majority of the complex C sites, as few of them are under strong influence of the solvent molecules in any case.

Molecular structure of {[Ti2O(bhmpc)(Hbhmpc)(H2bhmpc)].C4H8O2.EtOH}2 (1) where H3bhmpc would stand for 1,3-bis(hydroxymethyl)-p-cresol. Top: Association of four TiO6 octahedral units and coordination of the ligands. Bottom: double calix shape of the complex. Middle: only one ligand of each type is represented to show hydrogen bonding between Hbhmpc (yellow) and dioxane and between H2bhmpc (red) and ethanol. Oxygen atoms of solvents are blue colored. Also shown intramolecular hydrogen bonding between H2bhmpc (red) and Hbhmpc (yellow), H2bhmpc and bhmpc (green).
Orange-colored crystalline powders may also be obtained by adding to a solution of 6 mL of Ti(OPri)4 in 5 mL of isopropanol, a solution of 0.67 g of H3bhmpc dissolved in 15 mL of 1,4-dioxane and 3.17 μL of water. The same protocol using 6 g of Ti(OBun)4 in 5 mL of butanol-1 and 0.59 g of H3bhmpc has also led to orange-colored crystalline powders. In all cases, these crystals were found to be too small for performing a structure determination through single-crystal X-ray diffraction.
2.2 U.V.-Vis. spectroscopy
Spectra of the free ligand and of the complex after dissolution in CHCl3 have been recorded on a Varian Multicell Block for Cary 1/3 spectrophotometer at a concentration of 7·10−4 M.
2.3 IR and Raman spectroscopy
FT-IR spectra were recorded on KBr pellets between 400–4000 cm−1 on a Perkin-Elmer 1600 spectrometer. Micro-Raman measurements have been made on a Renishaw microscope, Ramascope model, equipped with 200 mW Ar+ blue laser (λ = 488 nm). The best resolution (1 cm−1) was obtained by recording four spectra (0–4000 cm−1) using each time a 1000 cm−1 range. Signals below 200 cm−1 were filtered with the Rayleigh line and were not observed. Calibration of the microscope for the 0–1000 cm−1 range was made on a silicon wafer (520.1 cm−1 line). Microcrystalline powders were observed (×50 magnification) without any special preparation after deposition on a glass wafer. For each powder, acquisition of the spectra was made on at least four different crystallites with acquisition times within a 5–60 s range.
2.4 NMR
17O NMR spectra were recorded on a Bruker spectrometer operating at 400 MHz for 1H and 44.2 MHz for 17O after dissolution of 26 mg of (1) in CDCl3 (3.2 g). Owing to the low solubility of (1) in CDCl3, the solution has been filtered before filling the 10 mm NMR tube preventing the computation of the real concentration. Acquisition time was 12 h for 221,694 scans using a 0.1 s repetition time.
1H MAS and 13C{1H} CPMAS NMR measurements were performed using a Bruker Avance-300 spectrometer, operating at 300.33 MHz for 1H and 75.52 MHz for 13C (spectra 1 and 2 on Figs. 6 and 7), or a Bruker Avance-500 spectrometer, operating at 500.03 MHz for 1H and 125.73 MHz for 13C (spectra 3 to 5 on Figs. 6 and 7), both equipped with 4 mm H-X probes. The samples were rotated at, respectively, νR = 10 kHz with corresponding CPMAS magnetization transfer conditions νRF(1H) = 32.5 kHz and νRF(13C) = 42.5 kHz or rotated at 13 kHz with νRF(1H) = 45.7 kHz and νRF(13C) = 32.7 kHz, using a 2.5 ms contact time in both cases. 1H decoupling composite pulse sequences used were spinal64 for measurements performed on Avance-300 and tppm180 on Avance-500 spectrometers. Other acquisition parameters were typically eight scans using a 10 s repetition time for 1H MAS and for 13C{1H} CPMAS, 1024 to 2048 scans using a 5 s repetition time.

13C CPMAS NMR spectra recorded at 75 MHz (1,2) or 125 MHz (3-5), (see experimental section for details), for different crystals obtained after mixing in 1,4-dioxane, H3bhmpc and Ti(OR)4 using R = Et (spectra 1-4) or R = Pri, Bun (spectrum 5). Spectra 1, 3 and 5 have been recorded on as synthesized crystals. Spectrum 4 corresponds to crystals obtained after recrystallization in CHCl3 (starting from spectrum 1 - crystals). Spectrum 2 is obtained after drying spectrum 1 - crystals. Phenolic CO region is shown at the left while PhCH3 is displayed at the right. The decomposition of some parts of spectra, obtained with Dmfit software analysis, is shown (dark grey: individual components; light grey: simulated sum-spectrum). See D. Massiot, F. Fayon, M. Capron, I. King, S. Le Calvé, B. Alonso, J-O. Durand, B. Bujoli, Z. Gan, G. Hoatson, Magn. Reson. Chem., 40 (2002) 70 for details.
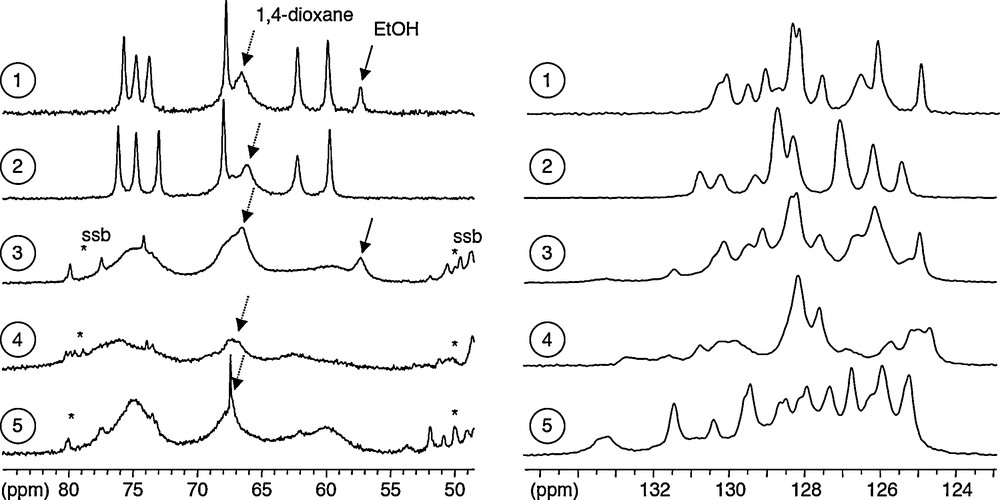
13C CPMAS NMR spectra recorded at 75 or 125 MHz for the same crystalline powders analyzed in Fig. 6. Aromatic carbon region is shown at the left while methylene region is displayed at the right. Stars denote groups of spinning sidebands (νR = 10 kHz for 1,2 and νR = 13 kHz for 3-5).
All 1H and 13C solution NMR measurements were performed at room temperature on a solution of (1) (5 mg) in CDCl3 (0.6 mL) using a Bruker Avance-500 spectrometer, operating at 500.13 MHz for 1H and 125.7 MHz for 13C, equipped with a 1H/13C 5 mm gradient-probe. We used a gradient selected version (gs-) for each type of 1D and 2D pulse sequence except for ROESY. The solvent signal was taken as a secondary reference for 1H and 13C chemical shift (7.26 ppm for C1HCl3 residue and 77 ppm for 13CDCl3, relative to TMS). In addition to classical 1D 1H and 13C {1H} spectra, four types of 2D spectra were collected: a 1H1H scalar correlation spectrum, recorded using a gs-DQFCOSY pulse sequence, two scans, 2.5 s as repetition time, and 512 increments for indirect dimension; a 1H1H dipolar correlation spectrum, recorded with a ROESY pulse sequence, 16 scans, 2.5 s as repetition time, 512 increments for indirect dimension and a total mixing spin-lock duration of 300 ms suitable for the correlation time one can expect, considering the size of the molecular entity under study; a 1H13C via 1JCH scalar correlation spectrum, acquired with a gs-HSQC pulse sequence, eight scans, 2 s as repetition time, 1024 increments in 13C dimension and a delay 1/4J = 1.56 ms corresponding to mean 1JCH = 160 Hz; a 1H13C long range scalar correlation spectrum, obtained with a gs-HMBC pulse sequence, eight scans, 2 s as repetition time, 1024 increments in 13C dimension and a delay 1/2J = 3.12 ms corresponding to mean 1JCH = 160 Hz. 1H and 13C {1H} T1 measurements involved a classical inversion-recovery sequence, with 1H decoupling in the case of 13C. We adopted a 10 s repetition time with two scans for 1H and 5 s with 1024 scans for 13C.
2.5 Electron density modeling
All calculations were made using the homemade PACHA software [34,35]. This software was designed for retrieving a partial charge distribution from the molecular or crystalline structure without the introduction of empirical parameters. Briefly stated, these charges are recovered after application of the electronegativity equalization principle that is known to have a firm quantum-mechanical basis and a deep thermodynamic significance as a measure of the electronic chemical potential. The transformation of a set of atomic coordinates into a partial charges distribution is performed using an atomic parameterization resting on two non-empirical parameters per atom: an electronic chemical potential measured by a spectroscopic electronegativity (Allen's scale) and an atomic radius measured by the most diffuse principal maxima in the radial distribution function r2ψ2(r), computed using relativistic wavefunction solutions of the Dirac equations. Interested readers should refer to the original papers for more details [34,35]. In the present case, the original CIF file cannot be used as such, owing to missing H-atom coordinates and to large uncertainties in the position of H-atoms and/or solvent molecules (here dioxane and ethanol). Consequently, in order to get electronic densities that reflects the averaged topology observed in solution and not the various metrical errors coming from the crystal structure determination in the solid state, the structure has been standardized in the following way.
All bonds involving H-atoms were first scaled to some standard values (see [36] for a compilation). In this study, OH, CarH, CH bonds in methylene and CH bonds in methyl groups have all been set equal to 97, 108, 109 and 106 pm respectively. Similarly all HCH bond angles in methylene and methyl groups have been set equal to their ideal tetrahedral value (110°). For methylene groups, standard torsion angles ±120° were assumed, whereas for the methyl group, one torsion angle was arbitrarily varied, the two other ones being fixed at ±120°. For the hydrogen bridge between Hbhmpc and H2bhmpc ligands (see Fig. 2), the H41O3C7O6 torsion angle was fixed to 0° to avoid divergence in the charge distribution. For the three remaining hydrogen bonds the corresponding torsion angle was arbitrarily varied.
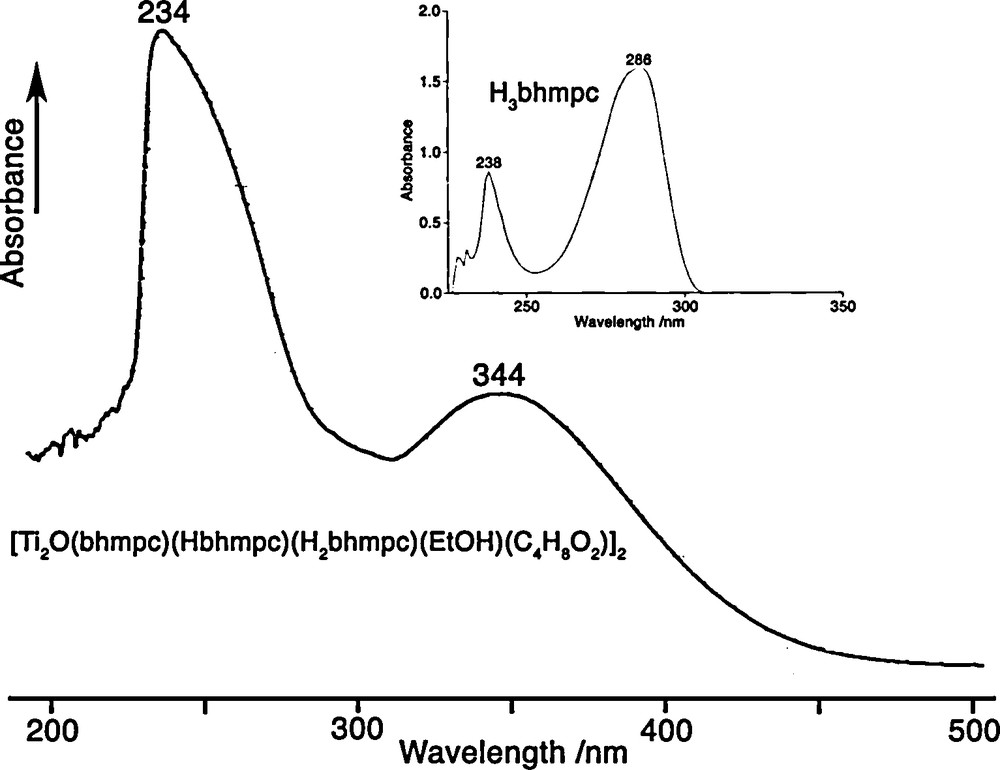
U.V.-Vis. spectra for the free ligand H3bhmpc and for the crystals {[Ti2O(bhmpc)(Hbhmpc)(H2bhmpc)].C4H8O2.EtOH}2 dissolved in CHCl3.
The atomic coordinates for dioxane and ethanol were recomputed starting from one oxygen atom (labeled O11 for dioxane and O13 for ethanol in the CIF file) using 143 and 153 pm for CO and CC bond lengths. Among the 10 and four angles needed to fix in space the dioxane and ethanol molecules, respectively, (3 + 3) were arbitrarily varied, the other ones (7 for dioxane and 1 for ethanol) being fixed at 110° (OCC and COC bond angles) and ±60° (torsion angles). This procedure allows one to conserve the overall “chair shape” identified for the dioxane molecule in the original X-ray data file and avoids the large metrical distortions observed in this CIF file.
After this parameterization, there remained 13 arbitrary angles associated to the mobile part of the complex that are CH2OH and CH3 groups or dioxane and ethanol orientation in the two divergent cavities. A reasonable structural model for describing the solution behavior is then derived by applying a two-step non-empirical energy minimization technique. In a first step involving the 13 variable angles, we have looked for the geometry corresponding to a minimum in steric energy by using short-range repulsive potentials derived from the Gordon–Kim electron gas model [37]. These non-empirical potentials are known to correlate extremely well with experimental van der Waals or non-bonded radii and were successfully used in a previous work [38]. In a second step, all H-atoms positions (7 arbitrary angles) were deduced after minimization of the electrostatic lattice energy using the non-empirical PACHA scheme [34,35,39]. It was found to be very close to the experimental one concerning the O-atom and C-atom coordinates and now contains all H-atoms in their most favorable position (both from a steric and electrostatic viewpoint) with ideal bond lengths and almost perfect tetrahedral bond angles.
2.6 Correlation of electron densities with NMR shifts
Previous studies have shown that the electron densities retrieved from the PACHA software were very useful for interpretation of chemical shifts variations [40–46]. Referring to an absolute scale (σref = 185.4 ppm) [47], the chemical shift δ of a13C nucleus bearing a partial charge q and submitted to an average excitation energy ΔE with an electronic population unbalance in p-orbitals Pu may be expressed as [45,46]:
| (1) |
In this relationship, the diamagnetic contribution σdia(q) may be evaluated from Hartree–Fock–Slater wave functions using the procedure of Saxena and Narasimhan [48] while the effect of partial charge q on the electron–nucleus distance r averaged over 2p-orbitals may be modeled as < (a0/r)3>2p = R°·(1 − f·q), where R° = 1.23 a.u. is the value applying to a free neutral carbon atom [49] and f a dimensionless factor close to unity. Molecular orbital theory is usually applied for recovering the charge distribution and bond order matrix Pij (i, j = x, y or z) governing the Pu-term [50,51] as well as the average excitation energy ΔE. These treatments, being in any case very approximate, we prefer to assume equal sharing of the electronic density among the three p-orbitals: Pxx = Pyy = Pzz = P, Pxy = Pyx = Pxz = Pzx = Pyz = Pxy = 0. With Pss, the population of the carbon 2s-orbital charge conservation leads to Pss + 3P = 4 – q, i.e. P = (1 – q/3) if Pss ≈ 1, leading to Pu = 3/2(1 – q2/9). The average excitation energy ΔE was evaluated by inversion of Eq. (1) using an average chemical shift computed from a set of NMR resonances characterized by the same first coordination sphere and from the corresponding averaged partial charges and diamagnetic shifts. Values less than 1 eV or much larger than 20 eV usually indicate wrong scaling in the charge dependence of the < (a0/r)3>2p = R°·(1 − f·q) term.
2.7 Thermodynamic modelization
In addition of bringing considerable help in the spectroscopic characterization of sol–gel precursors and in the quantification of ionic characters for any kind of molecular interactions, the PACHA approach may also be used to discuss chemical reactions from a thermodynamic viewpoint. This was already the case with the original partial charge model developed in collaboration with J. Livage [20–23], but with the ability of taking now into account the detailed molecular structures of the precursors it is now possible to perform a fully quantitative treatment of both enthalpic and entropic contributions. As far as enthalpy is concerned, PACHA relies onto the Hellman–Feynman theorem allowing one to introduce a unique partition of the molecular internal energy into a SE-term accounting for inter-atomic contributions, and a F-term accounting for intra-atomic electronic contributions independent of nuclear coordinates (see [35] for a rigorous quantum-mechanical treatment). Assuming that the variations of the F-term are well accounted by the choice of the Allen's absolute electronegativity scale used to derive equilibrium partial charges distributions and using the spherical charge approximation, it is possible to identify the SE-term with the internal energy U of the system. Using the common assumption that U ≈ H for condensed phases, it comes that the enthalpy variation ΔH should scale like the ΔSE variation.
Concerning entropy variations PACHA is able to estimate rotational entropies Srot at temperature T for a given molecular structure by computing its three principal moments of inertia (IA, IB, IC) and assuming that all rotational energetic levels are accessible at room temperature, leading to [52]:
| (2) |
In this relation, kB is Boltzman's, e is Neper's constant, is reduced Planck's constant, R is the ideal gas constant and σ is the number of indistinguishable orientations of the molecule (symmetry number equal to the order of the rotational sub-group of the molecular point-group). If such an approximation is obviously not justified for very small molecules, it should work quite well for sol–gel precursors that are precisely not small molecules. It is worth stressing that (2) applies only to rigid rotators having no flexible parts. For molecules having flexible parts, such as freely rotating methyl groups, for instance, an additional contribution of about 15 J.mol−1.K−1 per methyl group should be added to (2) [53]. Besides free rotation around its three principal inertia axes, PACHA also consider the experimental IR and Raman frequencies νi associated to the 3N-5 (linear molecule) or 3N-6 (non-linear molecules) vibration modes using the following computational scheme [53]:
| (3) |
Finally, besides this internal entropy Sint = Srot + Svib, PACHA also computes a standard partial molar entropy (molar scale, SI units) S° using a classical partition function derived by Powell and Latimer [54]:
| (4) |
In this relation, Sint = Srot + Svib is the internal contribution, VS is the molar volume of the solvent expressed in L.mol−1, M is the molar weight of the solute expressed in g.mol−1, NA is Avogadro's number, h is the Planck's constant while e, R and kB have the same meaning as in Eq. (2). The rotational entropy of (1) and H3bhmpc have thus been estimated from the knowledge of their crystalline structure ([33] and CSD code MUGNAD respectively) assuming free rotation of the methyl group and from the IR/Raman data given in Tables 1 and 2. Two geometries were considered for H3bhmpc: one with two intramolecular H-bonds after SE-minimization and one with intermolecular H-bonds observed in the solid-state structure. Vibrational entropy of H3bhmpc has been computed using the experimental IR and Raman spectra available on Sigma–Aldrich's web site. Structural models for other compounds have been generated by minimization of repulsive energy using short-range repulsive potentials derived from the Gordon–Kim electron gas model [37] and assuming perfectly tetrahedral bond angles with CC distances of 153 pm, CO distances of 142 pm, CH distances of 108 pm and OH distances of 97 pm. Ideal structural models have been thus generated using the above standard structural parameters for 1,4-dioxane (VS = 0.0853 L.mol−1), EtOH and iPrOH with free rotation of methyl groups, while the best ab initio molecular geometry [55] has been considered for the water molecule. Vibrational entropies of 1,4-dioxane, EtOH and iPrOH have been computed using the experimental IR and Raman spectra available at the SDBS database [56]. Concerning titanium alkoxides precursors, the {Ti4O16} core of [Ti4(OMe)16] [57] has been used for building a molecular model of tetrameric [Ti4(OEt)16] known to exist in the solid state [58], while XANES/EXAFS data [59] have been used for trimeric [Ti3(OEt)12]. Owing to the unknown status of free rotation of the methyl groups in these structures, they were all considered as rigid rotators with no flexible parts. For monomeric [Ti(OPri)4], it was found that the SE-energy was highly sensitive to the choice of the TiO distance. Using the 1.77 Å TiO distance measured on pure titanium isopropoxide [59] leads to SE = −4548 kJ.mol−1, a much too low value leading to abnormally highly endothermic reactions even with water. Using the 1.82 ± 0.02 Å TiO distance measured also by EXAFS on titanium isopropoxide dissolved in toluene [60] leads to SE = −3732 ± 234 kJ.mol−1, a value more compatible with known Ti(OPri)4 chemistry. For this study performed in dioxane/alcohol mixtures where H-bonding may readily occur, the upper uncertainty limit (TiO = 1.84 Å) has been selected accounting for a possible additional extension due to H-bonding interactions that are absent in toluene. As in the case of titanium ethoxide, Ti(OPri)4 has been considered as a rigid rotator with no flexible parts (fully hindered rotation of methyl groups). Vibrational entropies for these titanium(IV) alkoxides have been computed using their experimental IR and Raman spectra available on Sigma–Aldrich's web site [61] (Table 3).
Attribution of the IR spectrum shown in Fig. 1. Greek letters ν,δ,π,ϕ,ρw and ρr refer to stretching, scissoring, out-of-plane deformation, aromatic ring breathing, wagging and rocking vibrations respectively. Harmonic vibrations and ring breathing of 1,4-dioxane are noted “harm” and “ring” respectively.
| Vibration | H3bhmpc | 1,4-dioxane | Complex | Δν1 | Δν2 |
| νOH | 3396, 3313, 3173 | - | 3440 (400) | +44 | - |
| νPhH | - | - | 3003 | New | −2 |
| νaCH2(O) | 2962 | 2964 | 2962 | 0 | −2 |
| νaCH3 | 2925 | - | 2948 | +23 | - |
| νaCH2(C) | 2911 | 2914 | 2911 | 0 | −3 |
| νsCH2(O) | 2869 | 2889 | 2883 | +14 | −6 |
| νsCH2(C) | 2854 | 2856 | 2853 | +1 | −3 |
| Harm. | - | 2754 | 2738 | - | −16 |
| Harm. | - | 2694 | 2685 | - | −9 |
| νarCC | 1606 | - | 1636 | +30 | - |
| νarCC | - | - | 1603, 1586 | New | - |
| δaCH3 | 1485 | - | 1473 | −12 | - |
| δCH2(O) | 1453 | 1454 | - | - | - |
| δCH2(C) | 1447 | 1446 | 1444 | −3 | +2 |
| δSCH3 | 1418 | - | 1418 | 0 | - |
| πCH2(O) | 1372 | 1366 | 1397 | +25 | +31 |
| ρwCH2 | 1320 | 1324 | 1323 | +3 | +4 |
| πCH2(C) | 1266 | 1289 | - | - | - |
| Ring | - | 1254 | 1256 | - | +2 |
| δCOH | 1247 | - | 1244 | -3 | - |
| νarCO | 1206 | - | 1219 | +13 | - |
| νaCO | 1155 | - | 1160 | +5 | - |
| νaCO | - | 1122 | 1119 | - | −3 |
| νSCO | 1063 | 1083 | 1078 | +15 | −5 |
| νCO(Ti) | - | - | 1046 | New | - |
| δPhH | 1016 | - | 1016 | 0 | - |
| ϕCC | 1006,619,593,560 | - | -,633,-,578 | +14…+18 | - |
| Ring | - | 1049,889,874 | 1046,889,871 | - | 0…−3 |
| πPhH | 997,976,867,662 | - | 998,-,862,673 | −5…+11 | - |
| νPhC | 960 | - | 960 | 0 | - |
| μ3-OTi | - | - | 840,826 | New | - |
| δTiOC | - | - | 703 | New | - |
| ρrCH2 | 766,746,740 | - | 774,754,- | +8 | - |
| μ3-OTi | - | - | 502,458 | New | - |
Attribution of the Raman spectrum shown in Fig. 2. Greek letters ν,δ,π,ϕ and ρw and refer to stretching, scissoring, out-of-plane deformation, aromatic ring breathing, and wagging vibrations respectively. Ring breathing of 1,4-dioxane is noted “ring”.
| Vibration | H3bhmpc | 1,4-dioxane | Complex | Δν1 | Δν2 |
| νPhH | 3012 | - | 2997 | −15 | - |
| νaCH2(O) | 2955 | 2967 | 2962 | +7 | −5 |
| νaCH3 | 2921 | - | 2930 | +9 | - |
| νaCH2(C) | 2912 | - | - | - | - |
| νsCH2(O) | 2879 | 2890 | - | - | - |
| νsCH2(C) | - | 2858 | - | - | - |
| νarCC | 1618 | - | 1644 | +26 | - |
| νarCC | 1606 | - | - | - | - |
| νarCC | - | - | 1504 | New | - |
| δaCH3 | 1485 | - | 1483 | −2 | - |
| δCH2(O) | 1471 | 1457 | - | - | - |
| δCH2(C) | 1446 | 1443 | - | - | - |
| δSCH3 | 1380 | - | 1378 | −2 | - |
| ρwCH2 | 1346 | 1331 | 1327 | −19 | −4 |
| πCH2 | 1318 | 1304 | 1296 | −22 | −8 |
| πCH2 | - | - | 1281 | New | - |
| Ring | - | 1215 | - | - | - |
| νCO(Ti) | - | - | 1242 | New | - |
| νarPhC | 1198 | - | 1221 | +23 | - |
| νCC | 1160 | - | 1162 | +2 | - |
| δPhH | 1020 | - | - | - | - |
| Ring | - | 1014 | - | - | - |
| ϕCC | 995 | - | 996 | +1 | - |
| νPhC | 965 | - | 949 | −16 | - |
| Ring/μ3-O | - | 835 | 835 | - | 0 |
| νarcycle | 795 | - | - | - | - |
| νarcycle | 671 | - | - | - | - |
| νTiO | - | - | 628,597 | New | - |
| ϕCC | 577 | - | 585 | +8 | - |
| ϕCC | 519 | - | 532 | +13 | - |
| δCC | 474 | 485 | 489 | +15 | +4 |
| νTiO | - | - | 448 | New | - |
| ϕCC, δCC | 414 | 432 | 432 | +18 | 0 |
| δCC | 380 | - | 390 | +10 | - |
| δCC | 357 | - | 346 | −11 | - |
Partial charges distribution calculated from crystal data, experimental chemical shifts and NMR assignment to crystal sites for hydrogen atoms contained in (1). See Fig. 8 for XRD data libeling and Figs. 9–11 for NMR signals labeling.
| Chemical type | XRD label (neighbors) | Charge q | Shift/ppm | NMR label |
| Dioxane C4H8O2 | H31(C28) | +0.0251 | 3.664 | |
| H30(C28) | +0.0422 | 3.664 | ||
| H35(C30) | +0.0462 | 3.664 | ||
| H32(C31) | +0.0511 | 3.664 | ||
| H34(C30) | +0.0550 | 3.664 | ||
| H28(C29) | +0.0550 | 3.664 | ||
| H33(C31) | +0.0585 | 3.664 | ||
| H29(C29) | +0.0654 | 3.664 | ||
| CH3CH2OH | H40(C33) | +0.0435 | 1.146 | |
| CH3CH2OH | H38(C33) | +0.0504 | 1.146 | |
| CH3CH2OH | H37(C32) | +0.0507 | 3.615 | |
| CH3CH2OH | H39(C33) | +0.0638 | 1.146 | |
| CH3CH2OH | H36(C32) | +0.0649 | 3.615 | |
| Methyle CH3 | H22(C17) | +0.0483 | 2.197 | H2 |
| H24(C17) | +0.0487 | 2.197 | H2 | |
| H23(C17) | +0.0579 | 2.197 | H2 | |
| H19(C8) | +0.0506 | 2.226 | H3 | |
| H21(C8) | +0.0537 | 2.226 | H3 | |
| H20(C8) | +0.0574 | 2.226 | H3 | |
| H25(C26) | +0.0519 | 2.166 | H1 | |
| H26(C26) | +0.0534 | 2.166 | H1 | |
| H27(C26) | +0.0669 | 2.166 | H1 | |
| Methylene CH2 | H17(C19) | +0.0191 | 5.608 | H12 |
| H18(C19) | +0.0502 | 4.868 | H9 | |
| H15(C27) | +0.0299 | 5.909 | H15 | |
| H16(C27) | +0.0611 | 4.805 | H7 | |
| H7(C7) | +0.0301 | 5.826 | H14 | |
| H8(C7) | +0.0623 | 5.672 | H13 | |
| H14(C10) | +0.0308 | 5.338 | H11 | |
| H13(C10) | +0.0385 | 4.818 | H8 | |
| H10(C9) | +0.0519 | 4.744 | H6 | |
| H9(C9) | +0.0534 | 4.172 | H5 | |
| H12(C18) | +0.0538 | 4.050 | H4 | |
| H11(C18) | +0.0618 | 5.035 | H10 | |
| Aromatic CH | H5(C21) | +0.0493 | 6.709 | H16 |
| H1(C3) | +0.0516 | 6.947 | H21 | |
| H4(C14) | +0.0523 | 6.929 | H20 | |
| H2(C5) | +0.0548 | 6.788 | H17 | |
| H6(C23) | +0.0558 | 6.799 | H18 | |
| H3(C12) | +0.0596 | 6.823 | H19 | |
| ArCH2(OH)Ti | H41(O3) | +0.1879 | - | |
| ArCH2(OH)…EtOH | H42(O4) | +0.1882 | - | |
| ArCH2(OH)…O2C4H8 | H43(O6) | +0.2016 | - | |
| CH3CH2OH | H44(O13) | +0.2085 | - |
3 Results
3.1 U.V.-vis. spectroscopy
One of the most remarkable features of the complex is its deep orange color, a not so common situation for TiIV-based complexes. Fig. 2 compares the U.V.-Vis. spectra of the complex with that of the free ligand. The high energy band of the free ligand assigned to π→π* transitions within the aromatic ring is characterized by λmax = 238 nm (ɛ = 1200) and undergoes a slight hypsochromic shift, λmax = 234 nm, associated to a significant intensity increase (ɛ = 18700) after binding to Ti(IV)-centers. The low energy band of the free ligand assigned to n→π* transitions between O-atom lone pairs and the anti-bonding orbitals of the aromatic ring is characterized by λmax = 286 nm (ɛ = 2300) and undergoes a large bathochromic shift, λmax = 344 nm, with a significant intensity increase (ɛ = 8000) after binding to Ti(IV)-centers. This last band is responsible for the orange-color of the complex owing to its considerable width (ca. 100 nm at half-height) that may be assigned to charge transfers between the lone pairs of phenolic O-atoms and the empty 3d-orbitals on Ti-atoms.
3.2 IR spectroscopy
Attribution of the spectrum (Fig. 3) has been made (Table 1) by comparison with the IR spectra of the free ligand H3bhmpc [61] and of 1,4-dioxane [62]. Upon complexation, the three νOH bands found in the H3bhmpc ligand are replaced by a single large band centered at 3440 cm−1 (Δν1/2 = 400 cm−1). It is thus not possible to differentiate between the three kinds of intramolecular H-bonds existing in the crystal. Complexation has also the effect of rendering visible νarCH and νarCC vibrations that are not observed in the free H3bhmpc ligand. For the other bands, the global effect of complexation is an increase in frequency of at most 30 cm−1 except for δaCH3, δCH2, δCOH vibrations and one πPhH component showing a decrease in frequency of at most –12 cm−1. A few bands νaCH2, δSCH3, δPhH, νPhC are also observed at the same frequency in the free ligand or in the complex. On the other hand, it is observed that encapsulation of 1,4-dioxane within the two cavities has the global effect of decreasing vibrations frequencies by at most –16 cm−1 except for δCH2(C), πCH2(O), ρwCH2 and one type of ring breathing vibrations showing small increase in frequency except for the πCH2(O) vibration that appears to be strongly affected. This detailed attribution has allowed detection of the vibration bands associated to the formation of TiO bonds. The frequency found for the νCO(Ti) band is within the expected 1000–1170 cm−1 range for TiOC bonds while that proposed for the μ3-oxo bridge are close to what is observed in the rutile structure showing similar bridges: 811 cm−1 (A2u, longitudinal), 806 cm−1 (A2u, longitudinal), 500 cm−1 (Eu, transverse) and 458 cm−1 (Eu, longitudinal) [63]. The assignment of the 703 cm−1 band with δTiOC is tentative and should not be considered as firmly established.
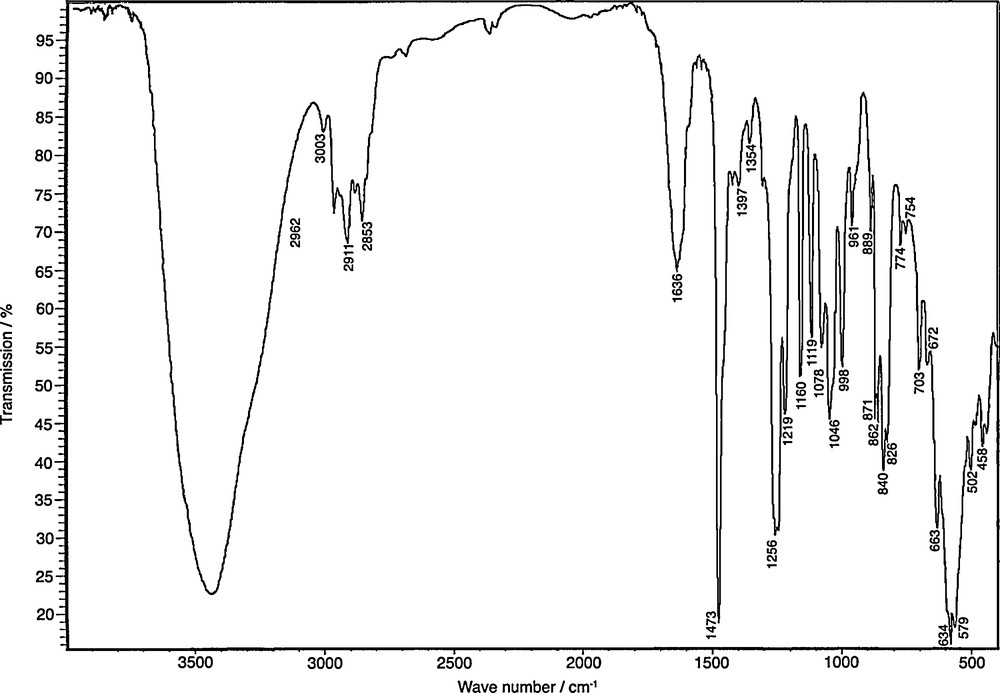
Infrared spectrum of {[Ti2O(bhmpc)(Hbhmpc)(H2bhmpc)].C4H8O2}2 crystals dispersed in KBr pellets. See Table 1 for the assignment.
3.3 Raman spectroscopy
Attribution of the spectrum (Fig. 4) has been made (Table 2) by comparison with the Raman spectra of the free ligand H3bhmpc [61] and of 1,4-dioxane [64]. The spectrum is dominated by the aromatic doublet at (1644, 1504) cm−1 and by the breathing of the dioxane ring at 835 cm−1. As already observed in the IR spectrum, the global effect of complexation is an increase in frequency of at most 26 cm−1 except for δaCH3, δSCH3, ρwCH2, πCH2 vibrations and one νCC component showing rather a decrease in frequency of at most –22 cm−1. It is also again observed that encapsulation of 1,4-dioxane within the two cavities has the global effect of decreasing vibration frequencies of at most –8 cm−1 except for one δCC component showing a slight increase in frequency and two vibrations (ring breathing and δCC) being unaffected. This detailed attribution has allowed detection of vibration bands associated to the formation of TiO bonds. The frequency found for the νCO(Ti) band is slightly higher than the 1160–1180 cm−1 range for observed for aliphatic TiOC bonds [65]. This increase in frequency may well reflect the fact that we are dealing here with an aryloxide and not with an alkoxide. The attribution proposed for the νTiO and μ3-oxo bonds is in agreement with what is observed in the rutile structure showing similar bridges: 826 cm−1 (B2g), 612 cm−1 (A1g) and 447 cm−1 (Eg) [63] or in the Raman spectra of titanium alkoxides [65].

Raman spectrum of {[Ti2O(bhmpc)(Hbhmpc)(H2bhmpc)].C4H8O2}2 microcrystalline powders after deposition on a glass wafer. See Table 2 for the assignment.
3.4 17O NMR spectroscopy
Fig. 5 shows the 44.2 MHz 17O NMR spectrum of complex (1) dissolved in CDCl3. As expected, only one signal is observed at 455 ppm falling within the 450–650 ppm range expected for μ3-OTi3 bridges [31–32].
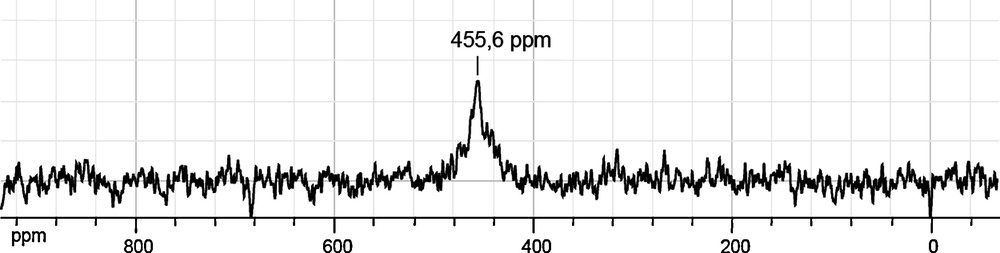
Natural abundance 17O NMR spectrum recorded at 44.2 MHz after partial dissolution of {[Ti2O(bhmpc)(Hbhmpc)(H2bhmpc)].C4H8O2.EtOH}2 crystals in CDCl3.
3.5 13C solid state CPMAS NMR
Fig. 6 shows the different 13C CPMAS NMR spectra recorded at 75 or 125 MHz for different crystals obtained after mixing in 1,4-dioxane, H3bhmpc and Ti(OR)4 using R = Et (spectra 1-4) or R = Pri, Bun (spectrum 5). According to the two single-crystal X-ray structures available for the R = Et compounds [33], three signals corresponding to bhmpc, Hbhmpc and H2bhmpc ligands are expected for phenolic CO(Ti) and PhCH3 sites in the as synthesized crystals, while six signals should be obtained after recrystallization in CHCl3 owing to the existence of two non-equivalents complexes in the unit-cell of this last compound. Spectra 1, 2 and 4 are in good agreement with this analysis. The two spectra recorded on samples 1 and 2 illustrate the effect of drying the crystals at room temperature under ambient atmosphere. In the phenolic CO(Ti) region (left of Fig. 6), drying essentially affects the chemical shift of the central resonance which moves from 157.0 ppm (sample 1) to 156.5 ppm (sample 2), the two outer resonances at 159.4 and 153.7 ppm being almost unaffected (159.6 et 153.7 ppm in sample 2). In the methyl region (right of Fig. 6), the number of signals changes from 4 to 3 with a change in chemical shifts for all resonances, reflecting the fact that ethanol molecules are no more present in the structure (while dioxane is still trapped as can be seen on Fig. 7). The spectrum of sample 3 in Fig. 6 points out the existence of at least two polymorphs in the as synthesized crystalline powders of the R = Et system. A pure single phase (1) is usually produced but, in spite of identical working conditions, obtaining a mixture similar to sample 3 is not rare. As will be discussed below, this mixture appears to contain two polymorphs. Spectrum 3 can actually be fitted as a sum of a spectrum identical to 1 (major component) and a second spectrum which appears to be identical to 5. Spectrum 5 is the reproducible signature of orange crystalline powders obtained when either Ti(OPri)4 or Ti(OBun)4 are used as sources of titanium instead of Ti(OEt)4. In these cases, no alcohol or alkoxy signals are present on spectra that are the same for both sources of titanium, but in each case 1,4-dioxane molecules are detected. In the phenolic CO(Ti) region of the spectrum, six components can be identified at 159.7, 159.5, 157.1, 156.9, 153.0 and 152.7 ppm. This can be compared to the case of sample 4, obtained by recrystallization in CHCl3 for which six signals are also found, shifted, at 159.7, 159.4, 159.0, 158.4, 153.5 and 153.0 ppm. This similarity suggests a single-phase composition for samples giving rise to spectrum #5, corresponding to a polymorph with two non-equivalent molecules in the unit-cell as was observed with the recrystallized sample 4. Unfortunately all attempts to determine this new crystalline structure suggested by 13C CPMAS measurements have failed owing to the very small size of the crystals, not suitable for a single-crystal X-ray study. Fig. 7 shows the two other regions of interest in these 13C CPMAS spectra that are either too complex to be analyzed in details (aromatic carbons zone at the left) or sometimes showing a bad resolution (methylene zone at the right for spectra 3 to 5). Despite this lack of resolution, it is worth noticing the absence of ethanol signals in samples 2, 4 and 5 in good agreement with the above discussion. It is also worth noting that 1,4-dioxane is detected in all cases as a large signal at 66–67 ppm. For sample 4, identifying the signal due to included CHCl3 molecules on the 13C CPMAS spectrum is not straightforward because of superimposed large signals but the presence of these molecules could be clearly evidenced by comparison with 13C{1H} MAS spectrum and on the 1H MAS spectrum (not shown).
3.6 1H and 13C solution NMR spectroscopy
It was observed that all samples studied by 13C CPMAS NMR gave rise to exactly the same 1H or 13C spectra after dissolution in CDCl3. This shows that if the nature of the R group used for the synthesis has a subtle effect upon the stacking of such molecules in the solid state, it plays absolutely no role in the building of the molecular unit in solution. Consequently, three different kinds of signals coming from aromatic ligands: bhmpc, Hbhmpc and H2bhmpc are expected if the centro-symmetric structure of the complex is conserved upon dissolution. For discussion we have labeled each peak on 1H and 13C spectra starting from low frequencies and ignoring solvent molecules. Fig. 8 shows the numbering scheme derived from X-ray crystallography, while Fig. 9 gives the final 1H and 13C NMR assignment.
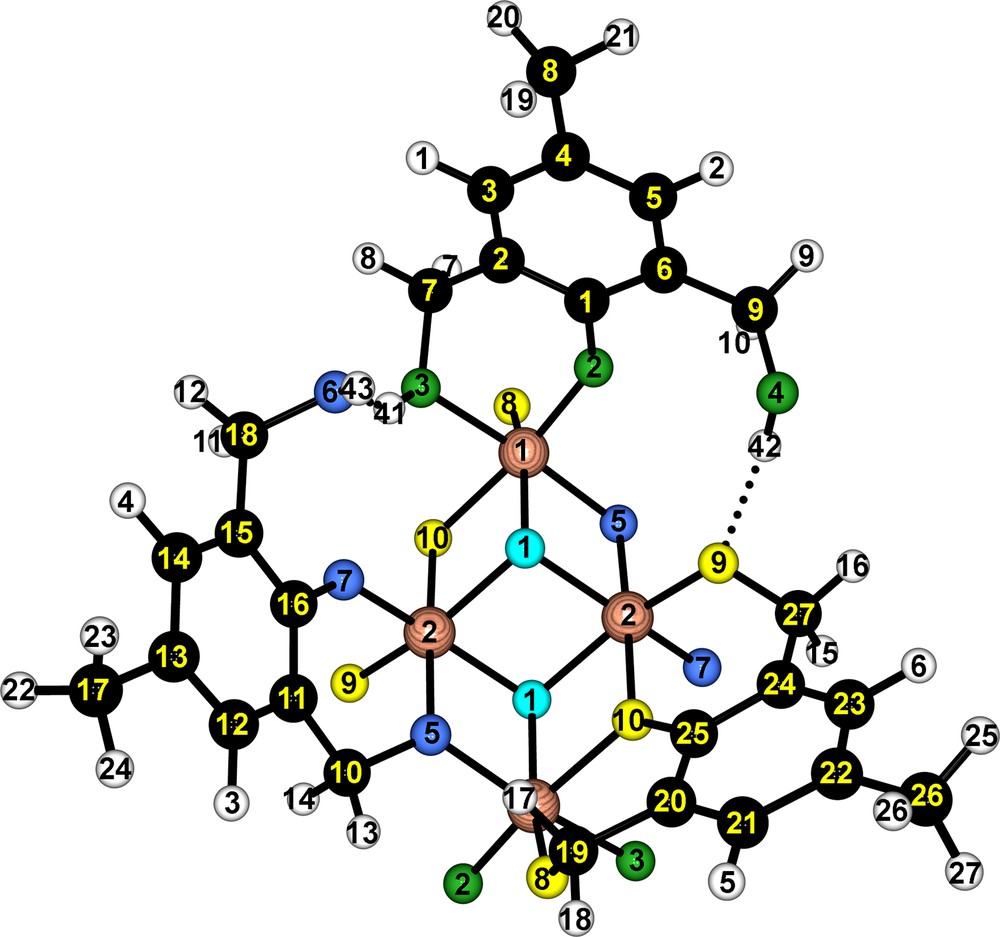
Atomic labels for (1) in the optimized X-ray crystal structure reported as a CIF file in the supplementary material. See Tables 7 and 8 for the complete charge distribution and NMR assignments. Only one ligand of each type is represented.

Atomic labels for (1) resulting from the assignment of NMR 1H and 13C NMR signals to molecular sites. Only one ligand of each type is represented.
Fig. 10 shows the 1H spectrum of a sample of (1) dissolved in CDCl3, (5 mg/0.6 mL). Dioxane and ethanol are readily identified by a singlet at 3.66 ppm (OCH2CH2O), a quadruplet at 3.61 ppm (CH3CH2OH) and a triplet at 1.15 ppm (CH3CH2OH) respectively. Some free H3bhmpc is also detected by the occurrence of three signals at 6.62 ppm (aromatic CH), 4.45 ppm (OCH2Ar) and 2.19 ppm (ArCH3). Other signals may be attributed to the three different kinds of ligands. No signal is detected from any hydroxy proton, clearly due to exchange processes. The methyl groups of the cresol moiety lead to three well-resolved signals (1:1:1) between 2.1 and 2.3 ppm. Between 4 and 6 ppm, 12 doublets of equal integral are observed showing the existence of six inequivalent methylene groups, each bearing two inequivalent protons. Four measured 2J values are significantly different (11.1, 11.8, 13.55, 14.5 Hz) and lead to pair some signals corresponding to different CH2 groups, respectively, (H5,H6), (H4,H10), (H13,H14) and (H9,H12). 2J values measured for the doublets H7, H8, H11 and H15 are too close and distributed (13.33, 13.38, 13.31, 13.25) to show pairs unambiguously. According to the second order coupling figures, one can nevertheless pair 1H signals the following way: (H11,H7 or H8) and (H15, H7 or H8). Finally, between 6.7 and 7 ppm, six doublets (4J∼1.6 Hz) of equal integral are observed corresponding to the two aromatic protons of the three kind of ligands. Detailed 1H chemical shift values can be found Table 1.
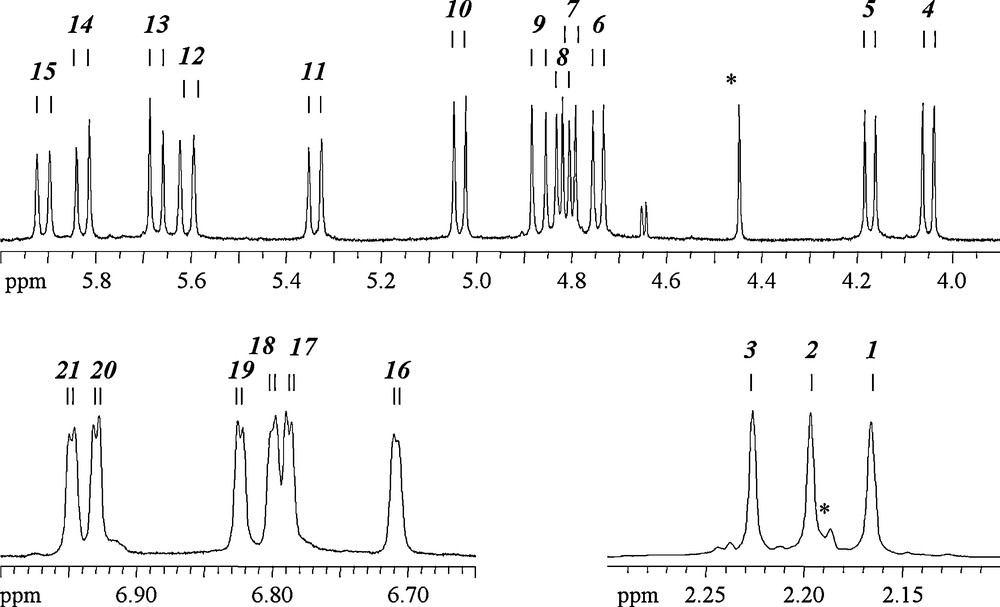
1H NMR spectrum of (1) dissolved in CDCl3 (0.5 mg/0.6 mL). Signals due to the complex have been arbitrarily labeled from low to high chemical shift values. Signals from residual free ligand H3bhmpc are marked with an asterisk (see text).
Fig. 11 shows the 13C {1H} spectrum on the same sample. As before, dioxane and ethanol are detected by three signals at 67.1 ppm (OCH2CH2O), 58.4 ppm (CH3CH2OH) and 18.3 ppm (CH3CH2OH). Signals attributed to the complex are: three signals observed at 20–21 ppm (ArCH3), six signals at 60–75 ppm (OCH2Ar), 14 signals at 123–131 ppm for 15 aromatic C-atoms, two signals being superimposed as demonstrated by the HMBC experiment, see Fig. 14a and three signals at 152–159 ppm (phenolic COTi). Detailed 13C chemical shift values can be found Table 4. One may thus safely conclude that the structure observed in the solid state is conserved in solution and that the complex is rigid enough to keep the quite low P-1 symmetry of the crystal. These well-resolved spectra (21 1H and 26 13C signals) also call for an attribution linking each NMR signal to its corresponding crystallographic site in the structure. Thus, a set of 2D NMR experiments was performed in order to identify on 1H and 13C spectra three groups of labels corresponding to the three ligand forms: bhmpc, Hbhmpc and H2bhmpc.
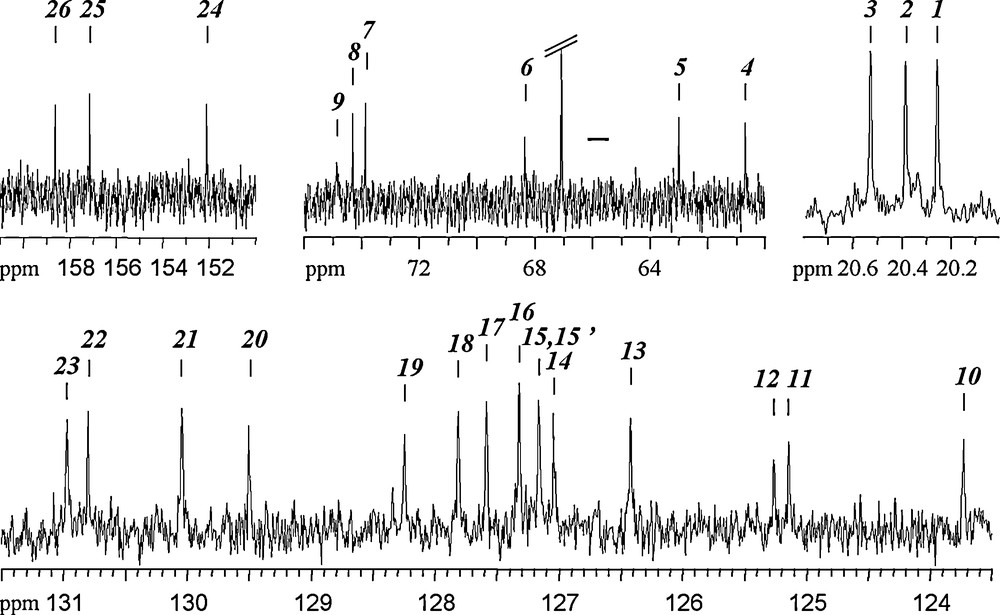
13C {1H} NMR spectrum of (1) dissolved in CDCl3 (0.5 mg/0.6 mL). Signals due to the complex have been arbitrarily labeled from low to high chemical shift values.
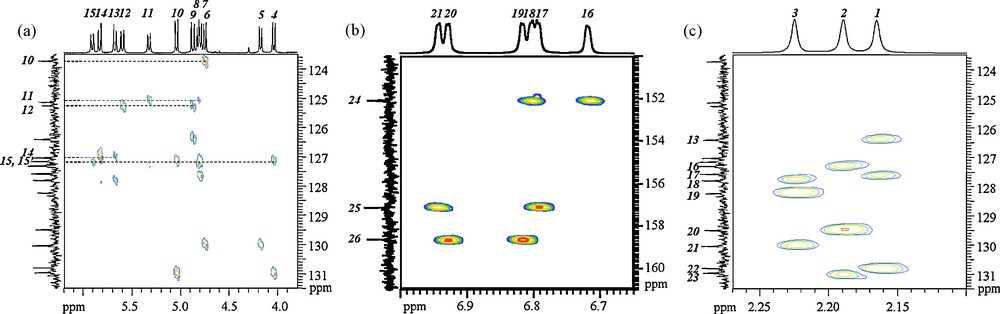
HMBC spectrum of (1) dissolved in CDCl3, (a) CH2C and CH2CCH correlation part, (b) CHCCOTi correlation part, (c) CH3C and CH3CCH correlation part.
Partial charges distribution calculated from crystal data, experimental chemical shifts and NMR assignment to crystal sites for heavy atoms contained in (1). See Fig. 8 for XRD data labeling, Figs. 9–11 for NMR signals labeling.
| Chemical type | XRD label (neighbors) | Charge q | Shift/ppm | NMR label |
| O atoms | O1(Ti1,Ti2,Ti2) | −0.8711 | - | - |
| O5(Ti1,Ti2,C10) | −0.6666 | - | - | |
| O10(Ti2,C25,Ti1) | −0.6296 | - | - | |
| O2(Ti1,C1) | −0.5400 | - | - | |
| O8(Ti1,C19) | −0.5398 | - | - | |
| O3(Ti1,C7,H41) | −0.5164 | - | - | |
| O9(Ti2,C27) | −0.5084 | - | - | |
| O7(Ti2,C16) | −0.5039 | - | - | |
| O6(C18,H43) | −0.3536 | - | - | |
| O4(C9,H42) | −0.3439 | - | - | |
| CH3CH2OH | O13(C32,H44) | −0.3420 | - | |
| CH3CH2OH | C33(C32,H38,H39,H40) | −0.1181 | 18.33 | |
| CH3CH2OH | C32(O13,C33,H36,H37) | −0.0112 | 58.37 | |
| Dioxane C4H8O2 | O12(C29,C30) | −0.2804 | - | |
| O11(C28,C31) | −0.2757 | - | ||
| C31(O11,C30,H32,H33) | −0.0098 | 67.06 | ||
| C30(O12,C31,H34,H35) | −0.0072 | 67.06 | ||
| C29(C28,O12,H28,H29) | −0.0062 | 67.06 | ||
| C28(O11,C29,H30,H31) | −0.0023 | 67.06 | ||
| Methyle CH3 | C26(C22,H25,H26,H27) | −0.1245 | 20.26 | C1 |
| C8(C4,H19,H20,H21) | −0.1239 | 20.39 | C2 | |
| C17(C13,H22,H23,H24) | −0.1237 | 20.53 | C3 | |
| Aromatic CH | C12(C11,C13,H3) | −0.0525 | 127.32 | C16 |
| C5(C4,C6,H2) | −0.0524 | 130.04 | C21 | |
| C14(C13,C15,H4) | −0.0512 | 130.97 | C23 | |
| C21(C20,C22,H5) | −0.0504 | 126.42 | C13 | |
| C3(C2,C4,H1) | −0.0474 | 127.81 | C18 | |
| C23(C24,H6,C22) | −0.0458 | 127.58 | C17 | |
| Methylene CH2 | C10(O5,C11,H13,H14) | −0.0539 | 68.34 | C6 |
| C7(C2,O3,H7,H8) | −0.0448 | 74.32 | C8 | |
| C27(C24,O9,H15,H16) | −0.0366 | 74.88 | C9 | |
| C19(O8,C20,H17,H18) | −0.0307 | 73.87 | C7 | |
| C9(C6,O4,H9,H10) | −0.0134 | 62.98 | C5 | |
| C18(C15,O6,H11,H12) | −0.0118 | 60.68 | C4 | |
| Aromatic CCH2O(Ti,H) | C20(C19,C21,C25) | −0.0379 | 125.26 | C12 |
| C11(C10,C12,C16) | −0.0330 | 125.14 | C11 | |
| C2(C1,C3,C7) | −0.0312 | 127.04 | C14 | |
| C24(C23,C25,C27) | −0.0251 | 127.16 | C15 | |
| C6(C1,C5,C9) | −0.0130 | 123.73 | C10 | |
| C15(C14,C16,C18) | −0.0123 | 127.16 | C15’ | |
| Aromatic CCH3 | C4(C3,C5,C8) | −0.0149 | 128.25 | C19 |
| C13(C12,C14,C17) | −0.0142 | 129.50 | C20 | |
| C22(C21,C26,C23) | −0.0100 | 130.80 | C22 | |
| Phenolic COTi | C25(C24,O10,C20) | +0.0193 | 152.09 | C24 |
| C1(O2,C2,C6) | +0.0407 | 157.13 | C25 | |
| C16(C11,C15,O7) | +0.0461 | 158.63 | C26 | |
| Ti atoms | Ti2(O1,O5,O7,O9,O10,O1) | +2.1752 | - | - |
| Ti1(O1,O2,O3,O5,O8,O10) | +2.4864 | - | - |
On the COSY spectrum (Fig. 12), correlation peaks among the methylene signals (HCH correlation part, not shown) confirm and complete the pairing started, relying on J values on the 1D spectrum: (H4,H10), (H5,H6), (H9,H12), (H13,H14), (H11,H8) and (H15,H7). This information is also available on the C H2 correlation part of the HSQC spectrum, Fig. 13a, where 1H and 13C signals of directly bonded C and H atoms of the six non equivalent CH2 groups are identified: (C4,H4,H10), (C5,H5,H6), (C6,H8,H11), (C7,H9,H12), (C8,H13,H14) and (C9,H7,H15).

(a) CHCH3 correlation part of the COSY spectrum of (1) dissolved in CDCl3, (b) CHCH2 correlation part of the ROESY spectrum of (1) dissolved in CDCl3.

HSQC spectrum of (1) dissolved in CDCl3, (a) C H2 correlation part, (b) CH correlation part, (c) C H3 correlation part.
The CHCH3 correlation part of the COSY spectrum given in Fig. 12a evidences three subsets of 1H signals corresponding to aromatic CH and CH3 groups on each of the three ligand types: (H1,H16,H18), (H2,H19,H20) and (H3,H17,H21). Then HSQC CH and C H3 correlation parts Fig. 13b and c respectively lead to group CH3 and CH 13C and 1H signals the following way : (C1,H1; C13,H16; C17,H18), (C2,H3; C21,H17; C18,H21), (C3,H2; C16,H19; C23,H20).
The CH2CH correlation part of the COSY spectrum (not shown) does not help to identify CH and CH2 neighbors readily because of long range couplings 6J between distant CH and CH2 in addition to 4J couplings between close CH and CH2 on the same ligand. Running a ROESY experiment allows one to investigate 1H1H dipolar interactions and correlates the following pairs of signals: (H4,H20), (H5,H17), (H7,H18), (H8,H17), (H9,H16), (H13,H21), see Fig. 12b. This leads to assign NMR signal labels to CH3, CH2 and CH neighbors on the three different ligands. Furthermore each H site of one given CH2 group can be labeled according to its distance to the neighboring CH given by XRD, see Figs. 8 and 9, making the assumption that the molecular structure is rigid enough, due to intra-molecular H-bonds, to compare that way atoms proximity in solution and in the solid state.
We are then left with the assignment of C-atoms bearing no protons, for which the HMBC spectrum, showing long-range CH J couplings, has been recorded, see Fig. 14. Among CH3C and CH3CCH correlation peaks, Fig. 14c, (H1,C22), (H2,C23), (H3,C21) peaks identify the signals corresponding to the C atoms of each CH3C fragment. The CHCC OTi correlation peaks, Fig. 14b, allows one to label phenolic COTi sites, showing (H16,H18,C24), (H17,H21,C25), (H19,H20,C26) vicinities. Finally, from the CH2C and CH2CCH correlation part, Fig. 14a, we get (H6,C10), (H8,H11,C11), (H9,H12,C12), (H13,H14,C14), (H4,H7,H10,H15,C15,C15’) associations, where the last one can be expressed as (H7,H15,C15), (H4,H10,C15’), according to the known assignment for the CH2 protons.
We have thus defined three unambiguous sets of labels for three different ligands:
[C1,H1; C22; (C13,H16; C12; C7,H9,H12); (C17,H18; C15; C9,H7,H15); C24]
[C2,H3; C19; (C21,H17; C10; C5,H5,H6); (C18,H21; C14; C8,H13,H14); C25]
[C3,H2; C20; (C16,H19; C11; C6,H8,H11); (C23,H20; C15’; C4,H4,H10); C26].
At this point, no conclusion has been drawn about the assignment of each of these sets to one specific type of ligand, three protonation states being possible: bhmpc, Hbhmpc and H2bhmpc. For that, we can first propose an assignment based on chemical shift arguments and start by considering the six 13C signals corresponding to the methylene moieties (labeled C4 to C9 on Fig. 9). From the chemical shift of these moieties in the free ligand H3bhmpc dissolved in CDCl3 (1 mg / 0.6 mL, spectrum not shown), δ = 63.65 ppm, we propose to assign the two low frequency peaks (δC4 = 60.68 ppm and δC5 = 63.00 ppm) to arms that are not coordinated to Ti-atoms. Then it follows that the two sets containing C4 and C5 should correspond to either Hbhmpc or H2bhpmc, leaving the last set containing C7 and C9 for bhmpc. Yet another assignment for the bhmpc ligand is possible by looking at the three 13C signals in the phenolic region (labeled C24, C25 and C26 on Fig. 9) where one signal (C24) appears to be clearly separated from the two other (C26 and C27). Referring to the molecular structure of the complex, it appears that the phenolic O-atoms are in the chelating position for Hbhmpc and H2bhmpc ligands and in the bridging position for bhmpc. This strongly suggests to assign C24 to bhmpc, leading to assign the same set of signals as before to this ligand : [C1,H1; C22; (C13,H16; C12; C7,H9,H12); (C17,H18; C15; C9,H7,H15); C24]. Assuming this attribution is correct, an oriented assignment has to be proposed for this bhmpc ligand. One can notice that one of its OCH2 arm is engaged into an intramolecular hydrogen bond with a HOCH2 arm of a H2bhmpc ligand (Fig. 8). If we look for the available protons around this H-bonded arm in the molecular structure, we found at a distance less than 320 pm one OH bond and three CH bonds. The situation is completely different for the other arm where it comes six CH bonds (four from CH groups and two from CH2 groups). Noticing the broadness of the C9 signal compared to the C7 one particularly, it is tempting to assign C9 to the H-bonded arm, for which H-bond might well lead to chemical shift distribution and/or shorter transversal relaxation time T2, and C7 to the non H-bonded one. A complete assignment is then proposed for the bhmpc ligand.
The two remaining sets are still to be assigned either to Hbhmpc or H2bhmpc. The Ti-bonded OCH2 zone in the 13C NMR spectrum shows three rather close peaks (C7,C8, C9), separated from a single peak (C6). In the molecular structure, two situations also appear: three similar TiOCH2Ar arms (two in bhmpc, one in H2bhmpc) and the (Ti)2OCH2Ar arm belonging to the Hbhmpc form. Then, C6 can be assigned to the Hbhmpc form, leaving C8 for the H2bhmpc one, as C7 and C9 are already supposed to belong to bhmpc. Considering the identified sets of signals, it follows that C4 belongs to the free arm of Hbhmpc and C5 to the free arm of H2bhmpc. Then we have reached a complete assignment of the 13C NMR spectra, inducing a complete assignment of the 1H NMR spectra as well.
In order to validate these assignments, we have also measured the longitudinal relaxation times T1 of both 1H and 13C nuclei in our complex. For the 13C nuclei, we found that relaxation times were ruled by the first coordination sphere as all values for a given type of chemical group are very similar (standard deviation is given in brackets): T1(CH2) = 0.135(14) s, T1(CC2H) = 0.22(3) s, T1(CH3) = 0.81(7) s, T1(CC3) = 0.83(13) s and T1(CC2O) = 1.24(17) s, with no significant differences observed among the three protonation states. The situation was very similar concerning 1H relaxation times of methyl T1(CH3) = 0.822(6) s or aromatic CH groups T1(CH) = 1.34(6) s, but not with methylene groups where significant differences were observed T1(CH2) = 0.401(34) s, see Table 5. Two protons belonging to the same methylene group are expected to reveal similar T1 values if mobility allows them to explore a same mean environment. On the contrary, if their mobility is restrained, different sensed environments will lead to significantly different relaxation times. When comparing the two relaxation times measured for each proton belonging to the same methylene group (identified below by its C atom NMR label), three cases may be encountered:
- • almost no differentiation: ΔT1(C5) = 1 ms and ΔT1(C7) = 8 ms;
- • moderate differentiation: ΔT1(C4) = 37 ms and ΔT1(C8) = 57 ms;
- • strong differentiation: ΔT1(C9) = 94 ms and ΔT1(C6) = 112 ms.
13C {1H} and 1H T1-values measured for CH2 fragments, displayed according to our assignment of signals to the three different ligands. Standard deviation is given in brackets.
| Ligand | NMR label | 13C T1 (ms) | NMR label | 1H T1 (ms) |
| bhmpc | C7 | 148(27) | H9 | 406(3) |
| H12 | 414(3) | |||
| C9 | 126(31) | H7 | 353(4) | |
| H15 | 447(3) | |||
| Hbhmpc | C4 | 156(18) | H4 | 421(3) |
| H10 | 384(2) | |||
| C6 | 116(30) | H8 | 332(5) | |
| H11 | 444(5) | |||
| H2bhmpc | C5 | 125(10) | H5 | 396(24) |
| H6 | 397(2) | |||
| C8 | 140(13) | H13 | 381(8) | |
| H14 | 438(4) |
A large ΔT1 being associated to a high rigidity of the CH2 arm, we can assign the largest ΔT1 (protons on C6) to the most constrained μ2-CH2OTi2 bridge occurring in the Hbhmpc ligand. This single observation is enough to validate in an independent way the previously derived assignment. It also explains the satisfactory correlation shown in Fig. 15 concerning the relationship between observed 1H T1-values and (Σ 1/r6)−1 values computed according to the proposed NMR assignment using the available structural data (H-atoms neighbors at less than r = 300 pm distance).
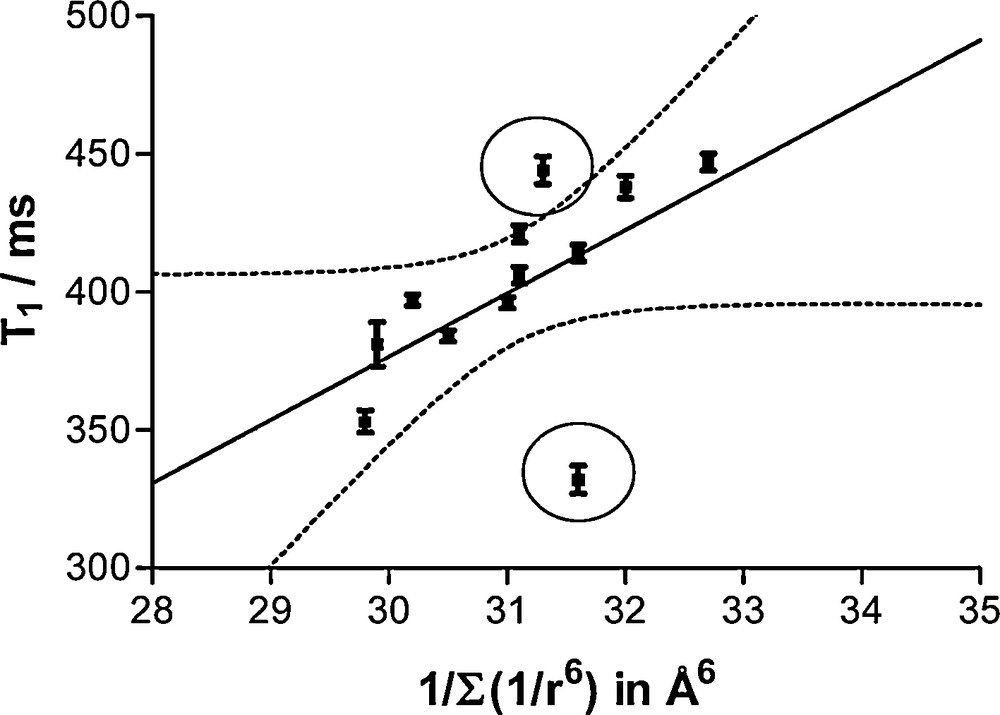
Correlation between 1H nuclei longitudinal relaxation times of methylene groups and the inverse of the sum over H-neighbors located at less than 300 pm from the concerned nucleus of the inverse of sixth power of H…H distance. NMR Assignment of Fig. 9 and distances extracted from XRD data (Fig. 8) has been used to produce this plot. See discussion for the two points falling outside the 95% confidence hyperbolae (dotted lines).
3.7 Assignment directly from crystal structures
The above results show how it was possible to establish on a purely experimental basis a link between the solid-state molecular structure of a sol–gel precursor and its associated high-resolution 1H and 13C NMR solution spectra. The problem is that such a full assignment is quite expensive in terms of NMR-recording time and the question is now asked if such an assignment could be made directly from available crystalline data. The principal motivation for such a theoretical analysis is the high-quality partial charges derived from the PACHA algorithm [34] and the fact that two crystal structures are available for the same structural motif differing only by the kind of solvent molecules filling the holes in the lattice [33]. Through the aid of Eq. (1), it becomes then possible to quantify in terms of chemical shifts the effect of replacing ethanol by chloroform, thereby allowing diving more deeply into the origin of these 13C chemical shifts.
As explained in the theoretical section, the first job is to fix reasonable values for the two critical parameters of the model, the f-factor ruling the charge dependence of the inverse electron–nucleus cubed distance r averaged over 2p-orbitals < (a0/r)3>2p = R°·(1 − f·q) and average excitation energy ΔE. As the partial charges given by the PACHA software are of ab initio quality [34], we have set f = 1 as suggested by computations based on Hartree–Fock–Slater-type orbitals [48,66]. The only adjustable parameter in the modeling was thus the average excitation energy, whose value is generally ruled by the nature of the first coordination sphere of the 13C nucleus. In the present case, the experimentally observed 13C resonances have been grouped into five (free ligand) and six (tetranuclear complex) different sets differing by the nature and number of atoms within the first coordination sphere of the carbon-atom (Table 6). For each set, an average chemical shift was computed, leading after inversion of equation (1) to an associated ΔE-value also indicated in Table 6. Furthermore, a comparison between the ΔE-values deduced from the structure of the free ligand (H3bhmpc, MUGNAD code in the Cambridge Structural Database) and that of the two complexes shows, as expected, a pretty good constancy for all C-sites not linked to oxygen atoms. For the two carbon sites linked to OTi moieties, a significant ΔE-decrease is observed relative to the ligand, responsible for the observed deshielding of the associated resonances in the NMR spectrum. Another point of interest of this table lies in the easy identification of the phenolic “CCO” groups as the least affected set of resonances by the substitution EtOH → CHCl3, owing to the perfect invariance of the corresponding ΔE-values. With Table 6, it is now possible by direct application of Eq. (1) to transform the partial charges given by the PACHA algorithm into 13C NMR chemical shifts.
Average 13C NMR chemical shifts and associated average excitation energy ΔE computed for each kind of first coordination sphere observed for carbon atoms in H3bhmpc and (1) allowing prediction of 13C NMR chemical shifts directly from the crystalline structure.
| Average shift /ppm | ΔE/eV | |
| Free ligand | ||
| CCO | 149.88 | 7.67 |
| CCH | 126.79 | 7.51 |
| CCC | 128.11 | 7.77 |
| C(OH)HH | 59.78 | 11.09 |
| PhHHH | 20.85 | 13.19 |
| Complex | ||
| CC(OTi) | 155.95 | 7.25 (7.25) |
| CCH | 128.36 | 7.49 (7.37) |
| CCC | 127.10 | 7.68 (7.78) |
| C(OTi)HH | 72.85 | 9.95 (9.69) |
| C(OH)HH | 61.83 | 10.95 (10.63) |
| PhHHH | 20.39 | 13.08 (12.32) |
Table 7 shows the NMR shifts predicted for the ethanol solvate structure while Table 8 refers to the chloroform solvate structure. Owing to the quite low polarities of these highly covalent bonds (−0.18 < qC < +0.05), the population unbalance contribution Pu is clearly not the dominant factor for explaining the observed chemical shift variations. For the same reason, the diamagnetic contribution σdia, remains stuck around 284 ppm (absolute shielding scale). It may thus be concluded, in agreement with more sophisticated approaches, that the dominant contribution to the 13C chemical shifts is due to the variation of the paramagnetic term either through the average excitation energy for C-sites differing in their first coordination sphere or through the inverse electron–nucleus cubed distance r averaged over 2p-orbitals < (a0/r)3>2p for C-sites sharing the same first coordination sphere. The high quality of our charge modeling is again well reflected by looking at the predicted values for C2CO sites deduced from the crystal data concerning ethanol and chloroform solvates. In both cases, the observed experimental ordering δ(H-bhmpc) > δ(H2bhpmc) >> δ(bhmpc) is quantitatively reproduced with less than 0.3 ppm and 0.7 ppm errors for the ethanol and chloroform cases, respectively. This right assignment based on two different crystal data rules completely out the possibility of a by-chance result. Obviously, such an agreement with solution NMR data for these C2CO sites comes from the fact that they are deeply buried in the most rigid part of the complex and are thus not under the influence of moving solvent molecules. Consequently, the next step is to look at aromatic C2CC sites that are also expected to be least affected by the presence of solvent molecules. The observed experimental ordering δ(bhmpc) > δ(Hbhpmc) > δ(H2bhmpc) for the three H3CPh sites (C22, C20 and C19 resonances) is here also quantitatively reproduced with errors less than 0.5 ppm for C20 (Hbhmpc) and C22 resonance (bhmpc) in the ethanol and chloroform cases, respectively. Interestingly enough, the least rigid H2bhmpc ligand (C19 resonance) is characterized by a larger error (1.6 ppm) in EtOH than in CDCl3 (1.0 ppm). This slightly larger error does not affect the predicted assignment, nor the fact that the H3CPh resonances should all be deshielded relative to PhCCH2O resonances. For these last signals, the agreement between calculated and experimental positions is found to be acceptable (errors less than 1.5 ppm) for C11, C12, C14, C15 resonances (Table 7) in the case of the ethanol solvate and for C12, C15, C15’ resonances (Table 8) in the case of the chloroform solvate. Most interesting is the large 3 ppm error in the position of the C15’ resonance, experimentally assigned to the PhCCH2(OH)…H arm of a Hbhmpc ligand, in the ethanol solvate case that is reduced down to 0.4 ppm in the chloroform solvate case. It may then be deduced that the H-bonded structure in which the ethanol molecule is engaged in the ethanol solvate is most probably broken after dissolution of the crystals in CDCl3. It is worth noticing that for the other coordinated PhCCH2(OTi2) arm of this Hbhmpc ligand (C11 resonance), the error is lower in the ethanol solvate case (0.5 ppm) relative to the chloroform case (1.4 ppm). This would suggest that we have not a complete ethanol-chloroform substitution upon dissolution, but just a significant rearrangement of the H-bond pattern in order to accommodate both ethanol and chloroform around the structure. As expected, the prediction for the C15 and C12 resonances assigned respectively to PhCCH2(OTi)…H and PhCCH2(OTi) arms of a bhmpc ligand are quite good in both cases (errors less than 1 ppm) while that concerning the C10 and C14 resonances assigned to the two arms of H2bhmpc ligands are the worst ones with errors larger than 1 ppm. For the C10 resonance associated to the uncoordinated PhCCH2(OH)…H arm, a large error is systematically observed. It is, however, logically smaller for the CDCl3 case (4.4 ppm) relative to the EtOH case (6.6 ppm). As already observed in the Hbhmpc case, errors are reversed concerning the other coordinated PhCCH2(OH)Ti arm (C14 resonance) with a better agreement (about 1 ppm error) for the ethanol solvate compared to the chloroform solvate (about 3 ppm error). Here also, a rearrangement of the H-bond pattern around the H2bhmpc ligands specific to the solution is probably responsible for the difficulty to reproduce the observed chemical shifts using crystalline data alone.
Prediction of 13C NMR chemical shifts from the ethanol solvate structure using Table 6.
| Site | Type | Charge q | σdia/ppm | <(a0/r)3> /au | Pu | δcalc/ppm | δexp/ppm |
| C26 | CCO | +0.04610 | 283.84 | 1.28670 | 1.49965 | 158.67 | 158.63 |
| C25 | CCO | +0.04067 | 283.89 | 1.28002 | 1.49972 | 157.30 | 157.13 |
| C24 | CCO | +0.01926 | 284.09 | 1.25369 | 1.49994 | 151.88 | 152.09 |
| C23 | CCH | −0.05120 | 284.21 | 1.16703 | 1.49956 | 126.80 | 130.97 |
| C21 | CCH | −0.05240 | 284.20 | 1.16555 | 1.49954 | 126.51 | 130.04 |
| C18 | CCH | −0.04740 | 284.21 | 1.17170 | 1.49963 | 127.71 | 127.81 |
| C17 | CCH | −0.04580 | 284.21 | 1.17367 | 1.49965 | 128.09 | 127.58 |
| C16 | CCH | −0.05252 | 284.20 | 1.16541 | 1.49954 | 126.49 | 127.32 |
| C13 | CCH | −0.05042 | 284.21 | 1.16798 | 1.49958 | 126.99 | 126.42 |
| C22 | CCC | −0.00996 | 284.25 | 1.21775 | 1.49998 | 130.99 | 130.80 |
| C20 | CCC | −0.01419 | 284.24 | 1.21255 | 1.49997 | 130.01 | 129.50 |
| C19 | CCC | −0.01493 | 284.24 | 1.21164 | 1.49996 | 129.84 | 128.25 |
| C15 | CCC | −0.02509 | 284.23 | 1.19913 | 1.49990 | 127.48 | 127.16 |
| C15’ | CCC | −0.01232 | 284.25 | 1.21485 | 1.49997 | 130.44 | 127.16 |
| C14 | CCC | −0.03119 | 284.23 | 1.19164 | 1.49984 | 126.06 | 127.04 |
| C12 | CCC | −0.03794 | 284.22 | 1.18333 | 1.49976 | 124.49 | 125.26 |
| C11 | CCC | −0.03296 | 284.22 | 1.18946 | 1.49982 | 125.65 | 125.14 |
| C10 | CCC | −0.01301 | 284.24 | 1.21400 | 1.49997 | 130.28 | 123.73 |
| C9 | COHH | −0.03661 | 284.22 | 1.18497 | 1.49978 | 73.73 | 74.88 |
| C8 | COHH | −0.04479 | 284.21 | 1.17491 | 1.49967 | 72.26 | 74.32 |
| C7 | COHH | −0.03072 | 284.23 | 1.19221 | 1.49984 | 74.79 | 73.87 |
| C6 | COHH | −0.05387 | 284.20 | 1.16374 | 1.49952 | 70.63 | 68.34 |
| C5 | COHH | −0.01339 | 284.24 | 1.21353 | 1.49997 | 61.70 | 62.98 |
| C4 | COHH | −0.01182 | 284.25 | 1.21546 | 1.49998 | 61.96 | 60.68 |
| C3 | CHHH | −0.12369 | 284.13 | 1.07786 | 1.49745 | 20.44 | 20.53 |
| C2 | CHHH | −0.12392 | 284.13 | 1.07757 | 1.49744 | 20.41 | 20.39 |
| C1 | CHHH | −0.12449 | 284.13 | 1.07688 | 1.49742 | 20.33 | 20.26 |
Prediction of 13C NMR chemical shifts from the chloroform solvate structure using Table 6.
| Site | Type | Charge q | σdia/ppm | <(a0/r)3>/au | Pu | δcalc/ppm | δexp/ppm |
| C26 | CCO | +0.04308 | 283.96 | 1.28298 | 1.49969 | 157.94 | 158.63 |
| C25 | CCO | +0.04153 | 283.89 | 1.28109 | 1.49971 | 157.55 | 157.13 |
| C24 | CCO | +0.02103 | 284.07 | 1.25587 | 1.49993 | 152.36 | 152.09 |
| C23 | CCH | −0.06504 | 284.19 | 1.15001 | 1.49930 | 127.12 | 130.97 |
| C21 | CCH | −0.06305 | 284.19 | 1.15245 | 1.49934 | 127.61 | 130.04 |
| C18 | CCH | −0.05434 | 284.20 | 1.15856 | 1.49944 | 128.82 | 127.81 |
| C17 | CCH | −0.05268 | 284.20 | 1.16316 | 1.49951 | 129.73 | 127.58 |
| C16 | CCH | −0.06243 | 284.19 | 1.15321 | 1.49935 | 127.76 | 127.32 |
| C13 | CCH | −0.05677 | 284.20 | 1.16018 | 1.49947 | 129.14 | 126.42 |
| C22 | CCC | 0.00309 | 284.23 | 1.23380 | 1.50000 | 130.87 | 130.80 |
| C20 | CCC | −0.00249 | 284.26 | 1.22694 | 1.50000 | 129.43 | 129.57 |
| C19 | CCC | −0.00431 | 284.25 | 1.22471 | 1.50000 | 129.16 | 128.25 |
| C15 | CCC | −0.01635 | 284.25 | 1.20990 | 1.49995 | 126.40 | 127.16 |
| C15’ | CCC | −0.01111 | 284.25 | 1.21634 | 1.49998 | 127.60 | 127.16 |
| C14 | CCC | −0.02615 | 284.23 | 1.19784 | 1.49994 | 124.16 | 127.04 |
| C12 | CCC | −0.02544 | 284.23 | 1.19872 | 1.49994 | 124.32 | 125.26 |
| C11 | CCC | −0.02790 | 284.23 | 1.19569 | 1.49987 | 123.76 | 125.14 |
| C10 | CCC | −0.00901 | 284.25 | 1.21892 | 1.49999 | 128.08 | 123.73 |
| C9 | COHH | −0.06249 | 284.19 | 1.15314 | 1.49935 | 73.56 | 74.88 |
| C8 | COHH | −0.07103 | 284.19 | 1.14264 | 1.49916 | 71.98 | 74.32 |
| C7 | COHH | −0.06151 | 284.20 | 1.15435 | 1.49937 | 73.74 | 73.87 |
| C6 | COHH | −0.07019 | 284.19 | 1.14367 | 1.49918 | 72.13 | 68.34 |
| C5 | COHH | −0.03686 | 284.22 | 1.18467 | 1.49977 | 62.63 | 62.98 |
| C4 | COHH | −0.04632 | 284.21 | 1.17303 | 1.49964 | 61.04 | 60.68 |
| C3 | CHHH | −0.17742 | 284.07 | 1.01178 | 1.49476 | 19.93 | 20.53 |
| C2 | CHHH | −0.17380 | 284.07 | 1.01623 | 1.49497 | 20.46 | 20.39 |
| C1 | CHHH | −0.17153 | 284.08 | 1.01902 | 1.49510 | 20.80 | 20.26 |
Up to now, focus has been put on C-atoms bearing no protons because these atomic sites were expected to be the least affected by dissolving the crystals in CDCl3, whereas protonated sites such as methine, methylene and methyl groups are expected to be in direct van der Waals contact with solvent molecules. For these groups, there is thus no a priori reason to expect a correlation between NMR data recorded in solution and structural data derived from single-crystal X-ray diffraction. Nevertheless, if such correlations are observed for some selected sites of the molecule, it could be concluded that the solvent is very probably excluded from the considered region. Obvious reasons for such an exclusion could be either an unfavourable steric interaction or even an entropic factor linked to the existence of very particular H-bonding scheme involving several kinds of small molecules. This is precisely the case here, with ethanol, dioxane and chloroform competing for the solvatation of the same double-calix shaped complex. The aromatic methine groups being the most buried sites, it is thus not surprising to find that using the ethanol solvate structure (Table 7), the relative positions of four resonances (C13, C16, C17, C18) among six possibilities are correctly predicted with less than 1 ppm error. Interestingly enough, these four sites are precisely those having in ortho position a Ti-coordinated arm: C13(bhmpc) = HCPhCH2OTi, C16(Hbhmpc) = HCPhCH2OTi2, C17(bhmpc) = HCPhCH2(OTi)…H and C18(H2bhmpc) = HCPhCH2(OH)Ti. Comparison with the chloroform solvate case (Table 8) then shows that the position of only two resonances (C16 and C18) are predicted with less than 1 ppm error. In this case, the two methine resonances associated to the bhmpc ligand (C13 and C17) are strongly affected (error of 2.7 and 2.3 ppm respectively). It may thus be concluded that, in solution, chloroform molecules are most probably excluded from the neighborhood of the bhmpc ligand, interacting more selectively with the less rigid Hbhmpc and H2bhmpc regions. Large errors (more than 2 ppm) are observed in both solvates for the two other sites, C21(H2bhmpc) and C23(Hbhmpc), having in ortho position an uncoordinated HCPhCH2(OH)…H arm, evidencing as before a specific reorganisation of the intramolecular H-bond pattern in solution. In strong contrast with methine groups, errors larger than 1 ppm are systematically observed (Table 7) for the six resonances of the methylene groups using ethanol solvate crystal data. On the other hand, three very good predictions with errors less than 0.5 ppm can be observed: C7(bhmpc) = PhCH2(OTi), C5(H2bhmpc) = PhCH2(OH)…O and C4(Hbhmpc) = PhCH2(OH)…O, for the chloroform solvate case (Table 8). This observation strongly suggests that chloroform molecules should have a good affinity for such sites and is in perfect coherence with the errors larger than 1 ppm observed for the three other methylene sites that are much more crowded and thus less accessible to CDCl3: C9(bhmpc) = PhCH2(OTi)…H, C8(H2bhmpc) = PhCH2(OH)Ti…O and C6(Hbhmpc) = PhCH2(OTi2). At last, it was possible to predict with an error less than 0.5 ppm, the relative positions of the three resonances arising from the H3CPh sites, using the ethanol solvate crystal data. Corresponding errors being one order of magnitude larger using the chloroform solvate data, it may be safely concluded that ethanol molecules are most probably selectively located in the neighbourhood of these methyl groups, thus preventing the approach of the solvent molecules.
4 Discussion
Sol–gel precursors containing Ti(IV) centers are usually colorless and highly reactive compounds towards moisture showing a variable degree of association dependent on the solvent used. This is not the case of the orange-red compound studied here that displays a quite rigid tetrameric brucite-type core (named “brucitane” hereafter) that is perfectly stable under ambient atmosphere. Being self-assembled in large yields at room temperature from any kind of commercial Ti(OR)4 alkoxide after reaction with H3bhmpc using 1,4-dioxane as a solvent, we think that (1) should be a perfect molecular precursor for building hybrid oganic–inorganic nanoporous TiO2-based materials displaying a significant absorption I the visible part of the electromagnetic spectrum. This is the reason why a complete spectroscopic characterization of this important precursor has been presented that should be very useful for future sol–gel synthesis involving it. 13C CPMAS NMR measurements have shown that upon drying ethanol molecules can be removed from the crystals without destroying the molecular structure of the complex. This demonstrates the good stability of this complex under ambient atmosphere, conditions under which most Ti(IV) precursors are irreversibly hydrolyzed to white powders. NMR studies has also shown that if the synthetic pathway leads in a highly reproducible way to the same molecular unit, stacking of this unit in the solid state to yield a crystal was a rather subtle process leading to at least four crystalline polymorphs. Last, but not least, 2D NMR techniques has also allowed us to propose a complete assignment of both solution 1H and 13C spectra that has been used to check the capabilities of the PACHA approach in predicting 13C NMR chemical shifts directly from the molecular structure, a notable difficult problem. The high quality of the partial charges distribution computed for the ethanol and chloroform solvates (Tables 7 and 8) is illustrated by the very reasonable ΔE-values derived from the knowledge of the average chemical shift. Moreover, the order found ΔE(sp2, π→π*) < ΔE(sp3, n→σ*) < ΔE(sp3, σ→σ*) was well in line with results that would have been deduced from qualitative molecular orbital theory. The ΔE-decrease relative to the free ligand observed for the two carbon sites linked to OTi moieties is also well in line with qualitative MO-theory that would place the d-empty d-orbitals of Ti-atoms far above the (n,σ,π)-HOMOs and slightly below the (σ*,π*)-LUMOs. One may be tempted to correlate the ΔE-values derived in Table 6 with the U.V.-Vis. absorption bands of the free ligand or the complex (Fig. 2) that corresponds to HOMO-LUMO energies of 5.3, 4.4 and 3.6 eV. The fact that both sets of values are different within a factor of 2 should not be surprising as optical transitions are rule by electric dipole selection rules, whereas chemical shifts are ruled by magnetic dipole selection rules.
Yet another way to use our partial charges consists in summing individual atomic charges according to the stoichiometry of meaningful moieties in the structure. For instance, in the case of the ethanol solvate structure the following global charge distribution is obtained:
| [{Ti2O}+3.79(H2bhmpc)−0.86(Hbhmpc)−1.18(bhmpc)−1.58.(C4H8O2)−0.18.(EtOH)+0.01]2 |
This allows discussing on a quantitative basis ionic characters for each moiety by making reference to a perfectly ionic situation derived by considering standard oxidation numbers: [{Ti2O}+6(H2bhmpc)−1(Hbhmpc)−2(bhmpc)−3.(C4H8O2)0.(EtOH)0]2. Comparison of these two formulas thus nicely explains why ethanol molecules are readily eliminated from the structure under ambient atmosphere owing to their almost zero slightly positive charge. This also explains why 1,4-dioxane molecules are not eliminated from the two cavities under similar conditions owing to a significant overall negative charge easily attracted by the strong positive charge on {Ti2O} moieties. This excess small negative charge on 1,4-dioxane is also probably responsible for the overall weakening of the vibration bands of this molecule observed through IR and Raman spectroscopies. Referring to the fully ionic situation {Ti2O}+6, one may say that the ionic character of the titanium oxo core is about 63%. This value should be compared to the ionic character found in TiO2 polymorphs, using the same PACHA algorithm, that are either 39% (TiO2R and TiO2H), 41% (rutile, anatase, brookite, TiO2B, TiO2II) or 44% (TiO2III) [1]. This increase in ionicity is quite logical as it merely means that oxide O2− anions are much better electron donors than H2bhmpc−, Hbhmpc2− or bhmpc3− anions. Associated ionic characters for these three ligands are found to decrease in the order H2bhmpc− (86%) > Hbhmpc2− (59%) > bhmpc3− (53%), reflecting again their different electron donor abilities. It may be worth comparing these ionic characters to those found in crystalline H3bhmpc (CSD code MUGNAD): H2bhmpc− (23%) > Hbhmpc2− (22%) = bhmpc3− (22%). This illustrates the strong electron donor ability of Ti-atoms relative to H-atoms. The same analysis may also be performed for the two non-equivalent tetramers found in the unit-cell of the chloroform solvate:
| [{Ti2O}+3.78(H2bhmpc)−0.67(Hbhmpc)−1.04(bhmpc)−1.42.(C4H8O2)−0.12.(CHCl3)−0.28]2 |
| [{Ti2O}+3.76(H2bhmpc)−0.76(Hbhmpc)−1.03(bhmpc)−1.44.(C4H8O2)−0.10.(CHCl3)−0.32]2.(CHCl3)−0.35 |
This shows that replacing ethanol by chloroform has no effect on the ionic character of the titanium oxo core (63%) but reduces significantly the excess negative charge on 1,4-dioxane molecules as well as the ionic characters of the ligands: H2bhmpc− (67–76%) > Hbhmpc2− (52%) > bhmpc3− (47–48%).
Fig. 16 shows the generated geometries and their associated self-energies and standard entropies for the thermodynamic modeling of the complexation of titanium alkoxides by H3bhmpc ligands in 1,4-dioxane/ROH mixtures. The case of Ti(OPri)4 will be considered first as all spectroscopic studies and molecular weight measurements agree with the tetrahedral monomeric nature of this precursor. The only incertitude thus concerns the structure adopted in solution by the H3bhmpc ligand able to form two stable intramolecular hydrogen bonds. Assuming that dioxane inclusion comes after formation of the complex, we may consider the following stoichiometric equation:
| 4 Ti(OPri)4 + 6 H3bhmpc (intra) + 2 H2O → 16 iPrOH + {[Ti2O(bhmpc)(Hbhmpc)(H2bhmpc)]}2 |

Self-energies and standard entropies for reactants and products according to the PACHA formalism. Color code: titanium atoms in wood, oxygen atoms in red, carbon atoms in black and hydrogen atoms in grey. Dotted lines refer to hydrogen bonds. The thermodynamic parameters for a complex not solvated by ethanol molecules {[Ti2O(bhmpc)(Hbhmpc)(H2bhmpc)].C4H8O2}2 are SE = 14232 kJ.mol−1 and S° = 561 J.mol−1.K−1. Removal of the two dioxane molecules from the cavities to form {[Ti2O(bhmpc)(Hbhmpc)(H2bhmpc)]}2 leads to SE = 14028 kJ.mol−1 and S° = 557 J.mol−1.K−1.
Using the thermodynamic data given in Fig. 16, it comes ΔH = + 1100 kJ.mol−1 and ΔS = +1223 J.mol−1.K−1 leading to ΔG300K = +733 kJ.mol−1. Considering the simultaneous dioxane inclusion within the two divergent cavities leads to a slightly less endothermic process (ΔH = +1030 kJ.mol−1) but leads also to a large drop in entropy (ΔS = +673 J.mol−1.K−1) owing to the loss of both rotational and solution entropies of these two molecules. The large positive value, ΔG300K = +828 kJ.mol−1 entirely due to the highly endothermic enthalpic term shows that reactants are too stabilized to react. In order to destabilize the precursors, one may thus either increase the TiO bond length in Ti(OPri)4 or break the two intramolecular H-bonds assumed to occur in the H3bhmpc ligand. As the TiO bond length has already been elongated (1.84 Å in solution against 1.77 Å in the pure liquid), its seems logical to investigate the effect of H-bonds breaking:
| 4 Ti(OPri)4 + 6 H3bhmpc (inter) + 2 H2O → 16 iPrOH + {[Ti2O(bhmpc)(Hbhmpc)(H2bhmpc)]}2 |
Owing to the destabilization of the ligand that has a negligible effect on the entropy term, the reaction is now significantly less endothermic with ΔH = +314 kJ.mol−1 leading to a favorable free energy decrease: ΔG300K = −53 kJ.mol−1. Considering as before the simultaneous dioxane inclusion within the two divergent cavities leads ΔH = +244 kJ.mol−1, i.e. to ΔG300K = +42 kJ.mol−1. It may thus faithfully be concluded that the complexation of Ti(OPri)4 by H3bhmpc is a completely entropy-driven reaction and that solvents allowing this complexation are those that are able to prevent formation of intramolecular H-bonds between the OH moieties of the H3bhmpc ligand that is obviously the case for alcohols/dioxane mixtures.
The case of Ti(OEt)4 is more difficult to handle owing to the controversies existing in literature concerning its molecular structure known to be a tetramer in the solid state [58] and a trimer in ultra-dry benzene [67,68]. Considering that (1) and [Ti4(OEt)16] share the same characteristic brucitane {Ti4O16} core in the solid state and that H3bhmpc reacts under a non-H-bonded structure, let us first assume that the reaction proceeds along the following equation:
| [Ti4(OEt)16] + 6 H3bhmpc (intra) + 2 H2O + 2 C4H8O2 → 14 EtOH + {[Ti2O(bhmpc)(Hbhmpc)(H2bhmpc)].C4H8O2.EtOH}2 |
From the data given in Fig. 16, we get ΔH = +184 kJ.mol−1 and ΔS = +657 J.mol−1.K−1 leading to ΔG300K = −13.1 kJ.mol−1. In contrast with the Ti(OPri)4 case and despite being an overall endothermic process, there is enough entropy to bind with the complex two dioxane and ethanol molecules in agreement with the solid state structure. Let us then consider the case of a complex not solvated by ethanol molecules:
| [Ti4(OEt)16] + 6 H3bhmpc (inter) + 2 H2O + 2 C4H8O2 → 16 EtOH + {[Ti2O(bhmpc)(Hbhmpc)(H2bhmpc)].C4H8O2}2 |
From Fig. 16, it comes: ΔH = + 244 kJ.mol−1 leading with ΔS = +1203 J.mol−1.K−1 to ΔG300K = −117 kJ.mol−1. This shows that the enthalpy destabilization coming from the breaking of the two H-bonds is more than compensated by the entropic stabilization gained by the liberation of two ethanol molecules. Considering the effect of further removal of the two dioxane molecules comes ΔH = +314 kJ.mol−1 leading, with ΔS = +1757 J.mol−1.K−1 to ΔG300K = −213 kJ.mol−1. This shows that encapsulation of dioxane molecules is by itself not a favorable process being significantly endothermic and having a rather high entropic cost. It may nevertheless readily occur at room temperature owing to its coupling with the liberation in solution of all the ethoxy groups linked to Ti-atoms procuring a very large entropy gain.
The above conclusions were based on the assumption of the existence in solution of a {Ti4O16} core for titanium ethoxide. There is some experimental evidence in literature supporting such an assumption as corresponding equilibrium constants have been published [69]:
| 2 Ti(OEt)4 ⇆ [Ti2(OEt)8]K2(C6H6) = 100 and K2(dioxane) = 20 |
| [Ti2(OEt)8] + Ti(OEt)4 ⇆ [Ti3(OEt)12]K3(C6H6) = 110 et K3(dioxane) = 88 |
| [Ti3(OEt)12] + Ti(OEt)4 ⇆ [Ti4(OEt)16]K4(C6H6) = K4(dioxane) = 200 |
It was also shown through 1H [68] and 13C NMR [70] that the [Ti3(OEt)12] trimer was unstable below –20 °C transforming most probably into the [Ti4(OEt)16] tetramer known to exist in the solid state [58]. This interpretation has, however, been immediately criticized on the ground that a water concentration in benzene as low as 4 × 10⁻³ m was enough to explain any condensation degree above 3 [71]. In contradiction with the above values, it was shown that the condensation degree of titanium ethoxide was 2.82 in ultra-dry benzene being independent of concentration [71]. There are also some unresolved controversies about the molecular structure of such a trimer in solution. Based on XANES/EXAFS data, J. Livage's group has brought some experimental evidence for a non-centrosymmetric cyclic structure with all Ti-atoms in five-fold-coordination (named 555-isomer hereafter) in the pure liquid [59]. However, according to group theory, one would then expect in this case eight TiO vibrations modes of E’ symmetry that are both active in IR and Raman in contradiction with IR and Raman spectra [67]. Moreover, the molecular anisotropy of Ti(OEt)4 in cyclohexane or CCl4 was also measured leading γ2 = 1.11 × 10−46 cm6, a value equal to that predicted (γ2 = 1.12 × 10−46 cm6) for a centro-symmetric structure having one Ti-atom in octahedral coordination flanked by two outer fivefold coordinated Ti-atoms (named 565-isomer hereafter) [67]. The calculated molecular anisotropy of the 555-isomer being one order of magnitude larger (γ2 = 1.4 × 10−47 cm6) is thus also not supported by these light scattering data, while the presence of an inversion center in the 565-isomer readily explains the lack of common bands in IR and Raman spectra. Finally, existence of the 555-isomer in benzene solutions was also not supported by recent XANES/EXAFS measurements favoring the 565-isomer [60].
With these results in mind, let the self-energy data given in Fig. 16 be applied to the equilibrium (3/4) [Ti4(OEt)16] <-> [Ti3(OEt)12] showing that this entropy-driven depolymerization (ΔS = +94–95 J.mol−1.K−1) should be an endothermic process characterized by ΔH = +92 kJ.mol−1 for transformation of the tetramer into the 565-trimer against ΔH = +2350 kJ.mol−1 for transformation into the 555-trimer. Considering that four ethoxy bridges are broken on going from the tetramer towards the 565-trimer, the enthalpy content of a TiOEtTi bridge may be estimated as −ΔH/4 = −23 kJ.mol−1 in good agreement with the value −21 kJ.mol−1 derived from latent heat vaporization measurements [72] or the value −23 kJ.mol−1 derived from 1H NMR data [73]. The same value derived from the 555-isomer being in complete disagreement with available experimental data, the existence of this structure in solution may be ruled out beyond any doubt on thermodynamic grounds. It is also worth noting that taking into account the entropy contribution, we still have ΔG253K = +70 kJ.mol−1 for [Ti4(OEt)16] depolymerization at T = −20 °C. The easy destruction of the tetramer observed through 1H NMR at this temperature means that another source of entropy is needed to account for this spontaneous depolymerization. As the entropy values given in Fig. 16 were derived for completely rigid structures, the additional entropy released by the free rotation of the 12 methyl groups in the 565-trimer would lead to ΔS = 275 J.mol−1.K−1, i.e. to a predicted depolymerization temperature T* = 92000/275 = 335 K not too far from the observed value T* = 253 K. A slight shortening of TiO distances, or a difference in vibrational entropies (assumed here to be the same for the tetramer and the trimer) would easily account for the 82 K difference between theory and experiment. Consequently, in order to study the reaction of [Ti3(OEt)12] with H3bhmpc we will consider the following equation:
| (4/3) [Ti3(OEt)12] (565) + 6 H3bhmpc (inter) + 2 H2O + 2 C4H8O2 → 14 EtOH + {[Ti2O(bhmpc)(Hbhmpc)(H2bhmpc)].C4H8O2.EtOH}2 |
From the data given in Fig. 16, comes ΔH = +61 kJ.mol−1 and ΔS = +676 J.mol−1.K−1 leading to ΔG300K = −142 kJ.mol−1, showing as expected that the linear [Ti3(OEt)12] trimer is more reactive than the brucitane-type [Ti4(OEt)16] tetramer.
5 Conclusions
In summary, we have shown that by using a combination of X-ray diffraction, multidimensional NMR techniques and electronic density modeling, it was possible to propose a complete assignment for 13C and 1H solution NMR spectra of a titanium(IV) oxo-aryloxide. More specifically, it was observed that experimental X-ray diffraction data was not accurate enough to yield a direct and faithful interpretation of 13C NMR data in solution. Useful correlation between a crystal structure and a solution 13C NMR spectrum emerges only after some kind of averaging of metrical errors arising from the refinement process. As shown here, the PACHA formalism [34,35] may be used in conjunction with ab initio short-range repulsive potentials to perform this kind of averaging. Obviously, another approach would have been to use a full ab initio approach allowing one to perform in a single step both the necessary geometrical optimization and the evaluation of the corresponding NMR chemical shift tensors. As far as sol–gel precursors are concerned, we do prefer the PACHA approach owing to its ability to treat quickly very large systems (with several hundreds of constituent atoms) that are well beyond the scope of full ab initio methods. The approach used in this paper does not suffer from such limitations as it involves a combination of experimental measurements analyzed in terms of a non-empirical and quite rigorous theoretical formalism that may be easily applied even for very large unit cells. In this mixed approach, experimental data may be used to check the validity of theoretical conclusions, whereas by reciprocity the theoretical model may help to handle satisfactorily and quickly quite complex experimental situations. Another big advantage of the above approach is that it allows considering on the same theoretical grounds either isolated molecules displaying ideal geometry, either whole crystalline networks as shown here (see [74–76] for other examples related to microporous compounds). This last point is obviously of crucial importance if one is interested in assigning high-resolution solid-state 13C CPMAS NMR spectra of such sol–gel precursors that very often display a very large number of well-resolved signals. Yet another nice feature of the presented approach is the possibility to perform a full thermodynamic analysis of the chemical modification of alkoxides precursors putting on a quantitative basis the link between molecular structure in solution and chemical reactivity. This triple treatment of sol–gel precursors based on powerful spectroscopic measurements, electronic density modeling and rigorous statistical thermodynamic considerations was initiated about 25 five years ago under the scientific supervision of J. Livage and the Strasbourg's group is very happy to honor him by this contribution for his 70th birthday.