

1 Introduction
Scanning electrochemical microscopy (SECM) is a scanning probe technique that allows probing electrochemical reactivity of a wide range of sample surfaces and phases [1–3]. In recent years, new attempts were made to apply SECM to applied problems and to overcome some typical limitations including difficult probe handling, limited range of media suitable for SECM experiments and limited range of sample area to be scanned [4–7]. Furthermore, an important progress has been achieved on SECM applications to study structures and processes at the nanoscale [8,9]. This has been realized by the improvement of nanoelectrode fabrication [10–13], development of new modes of the SECM operation [14,15], and selection of nanoscale systems suitable for SECM experiments [16].
SECM can be operated in different working modes [1] but the highest lateral resolution is obtained by the feedback mode to which we restrict the discussion in this article. Please note the potentionally confusing (yet established) use of the term “feedback” in the context of SECM. The SECM feedback mode refers to a way by which electrochemical reactions at the probe and at the sample are coupled. Additionally, any distance control mechanisms uses an electronic setup to provide a feedback control, i.e. a mechanism similar to other scanning probe techniques in which the distance response of the electrode is maintained at a set-point by varying the extension of an actuator. Both concepts are important in this communication and we will distinguish between them by referring to the coupling of reactions as “SECM feedback”.
In the SECM feedback mode, a mediator compound is electrolyzed at the probe electrode with the radius of the active electrode rT and the total radius including the glass sheath rglass (Fig. 1). The product of this reaction diffuses to the sample where it can react back to the original form. From the sample the mediator diffuses back to the probe where it increases the current depending on the distance d between probe and sample, the diffusion coefficient D of the mediator and the effective heterogeneous rate constant keff [cm s−1] at the sample. The data can be plotted in normalized form IT = f(L), where L = d/rT is the normalized distance and IT is the measured current iT at distance d divided by the current in the bulk solution iT,∞. For extended samples approach curves, i.e. IT = f(L) overlap if the RG = rglass/rT and a normalized rate constant κ = keff rT/D is constant.
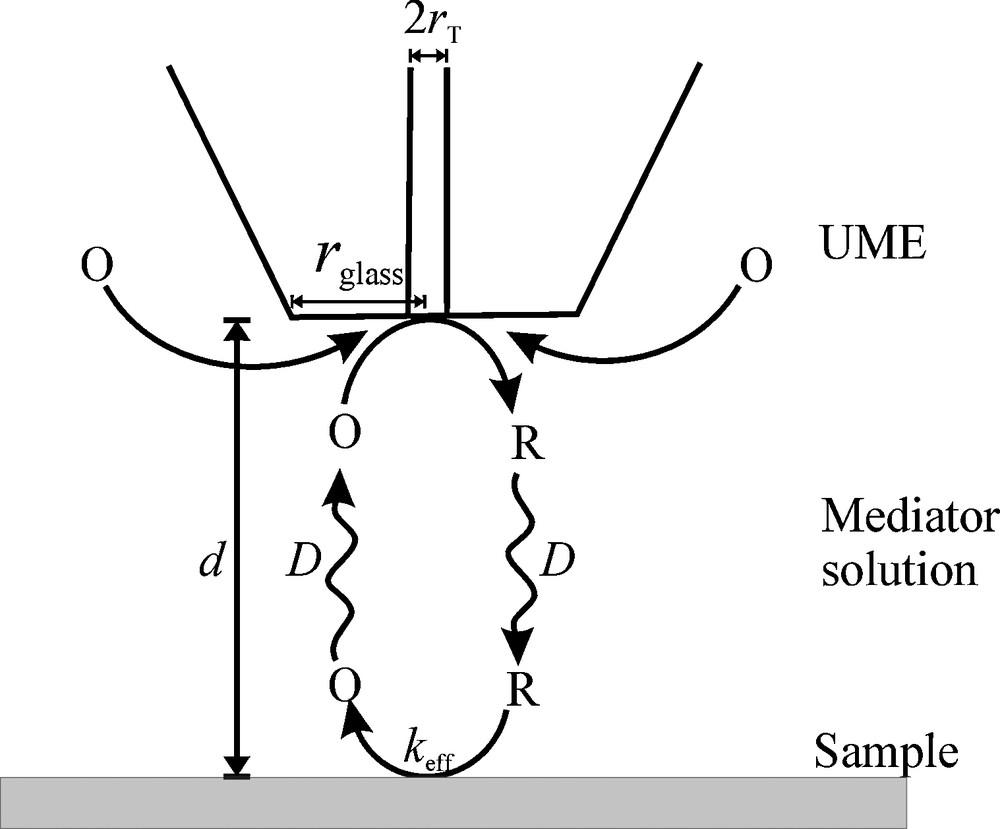
Schematic of SECM feedback mode. O and R are generic symbols of the oxidized and reduced form of a redox couple, respectively. In this example the O is [Ru(NH3)6]3+ and R is [Ru(NH3)6]2+.
SECM imaging with nanoelectrodes is challenging due to the difficulty to retain a constant L. This follows because a decrease of rT requires a proportional decrease of d to maintain the same L and therefore the same relative contrast. In constant-height mode, the probability of probe damage due to collisions with the sample increases with decreasing absolute distance d. Several methods have been demonstrated in order to maintain a constant d. These include the use of a shear force distance control [17–22], integrating SECM probes in AFM cantilevers where the geometry of the cantilever or the imaging in a lift-off mode provides the constant working distance [23–25], intermittent contact (IC) SECM [26], and the combination of SECM with scanning ion conductance microscopy (SICM) [8,27]. Mirkin et al. [28] reported a more extensive review on developments in high resolution SECM imaging.
The SECM-AFM method was reported as the most suitable to resolve surface topography effects from reactivity on nanoscale imaging. However, the imperfect shape of steady-state voltammograms obtained by such probes (which is not good for quantitative electrochemical experiments) [29,30] and imperfect electrochemical responses (AFM images usually appeared better than current maps) were realized [31–33]. Shear force distance control employs a feedback signal based on hydrodynamic forces to maintain a constant probe-substrate separation. Several types of shear force detection system have been reported in the literature such as optical [17,34], and non-optical [20,35,36] systems. Schuhmann and co-workers [37,38] introduced the non-optical shear force detection system for SECM following the procedure developed by Brunner et al. [39]. The method involves nanoelectrode fastened to two piezoelectric plates. They are used as stimulator at one of the mechanical resonance frequencies of the probe (rather than at the resonance of a tuning fork) and detector of lateral probe vibrations. We used a similar setup [20] and combined it with a commercial proportional-integral-differential (PID) feedback system. In our system, shear force is controlled independent from the SECM software. In this contribution, we report quantitative details of shear force detection distance for SECM and provide selected applications in the simultaneous imaging of topography and reactivity. Furthermore, the intrinsic limitations of sample kinetics on image resolution in quantitative SECM feedback measurements were discussed.
2 Experimental
2.1 Materials and chemicals
Ruthenium hexamine chloride [Ru(NH3)6]Cl3 was used as mediator and obtained from Sigma-Aldrich. Potassium nitrate KNO3 (Sigma-Aldrich) was used as a supporting electrolyte. A 4 mM [Ru(NH3)6]Cl3 + 0.1 M KNO3 aqueous solution was used for all experiments. The model surface for imaging and approach curve comprised parallel gold bands on a glass slide. To obtain topographic information of the gold bands, atomic force microscopy (AFM) in tapping mode on a Nanoscope IIIa instrument (Veeco Instruments Inc., Plainview, NY, USA) and confocal laser scanning microscope (CLSM) (TCS SP2 AOBS, Leica Microsystems GmbH, Wetzlar, Germany) in reflection mode were used. The scanning electron microscopy (SEM) measurements of nanoprobe size were performed with a Hitachi S-3200 N (Scientific Instruments, Nissei Sangyo GmbH, Ratingen, Germany).
2.2 Fabrication of nanoelectrodes
The Pt nanoelectrodes were fabricated using a laser pipette puller as described earlier [40,41]. Briefly, a pre-cleaned 1 cm long 25 μm diameter Pt wire was inserted in the middle of a pre-cleaned 10 cm long quartz glass capillary (inner diameter 0.3 mm, outer diameter 0.9 mm) (Goodfellow GmbH, Bad Nauheim; Germany). It was placed exactly at the middle of the laser heating chamber of a laser pipette puller (P-2000, Sutter Instrument Co., Novato, CA). The capillary was evacuated before and during heating by connecting its two ends via a Y-shape silicon tube. A two-step sealing-pulling procedure was utilized that follows the recommendation of Ballesteros Katemann et al. [38]. The program parameters had to be adapted to our particular instrument and require periodic readjustment. The following set is a typical example: heat = 640, filament = 4, velocity = 100, delay = 100 and pull = 1 is used to seal the Pt wire and glass capillary together by a cycle of 15 seconds heating and 20 seconds cooling. The procedure is repeated five times while a specially designed clamp prevents a pulling process by holding the fixing screws of capillary holder of the laser puller. After a well-sealed capillary is obtained, the clamp is removed and the final hard pulling was made with parameters heat = 640, filament = 2, velocity = 100, delay = 100 and pull = 220. The nanoelectrodes produced have smooth surfaces and long tapers. All electrodes were polished at a 90° angle with a home-made rotary stage on a micropolishing cloth with suspension of 0.05 μm alumina particles.
2.3 Instrumentation
Fig. 2 shows schematically the home-made SECM with shear force distance control. The shear force unit consists of two piezoelectric plates, which are used to stimulate and detect the lateral oscillation of the SECM probe. The two piezoelectric plates were fixed to the nanoelectrode body at approximately 45° relative to each other [20]. The shear force regulation consisted of a DS4L controller with SXM software version 0.19f (Anfatec Instruments AG, Oelsnitz, Germany), and excitation, detection and lock-in amplification of the vibration. The control SXM software runs on an independent personal computer (PC). The vertical position control signal was fed into the piezo controller/amplifier E-662 (Physik Instrumente, Karlsruhe, Germany). The E-662 was operated in open loop. This controller drove a linear piezo stage P-780.20 with a translation range of 80 μm and an internal position sensor (Physik Instrumente, Karlsruhe, Germany).
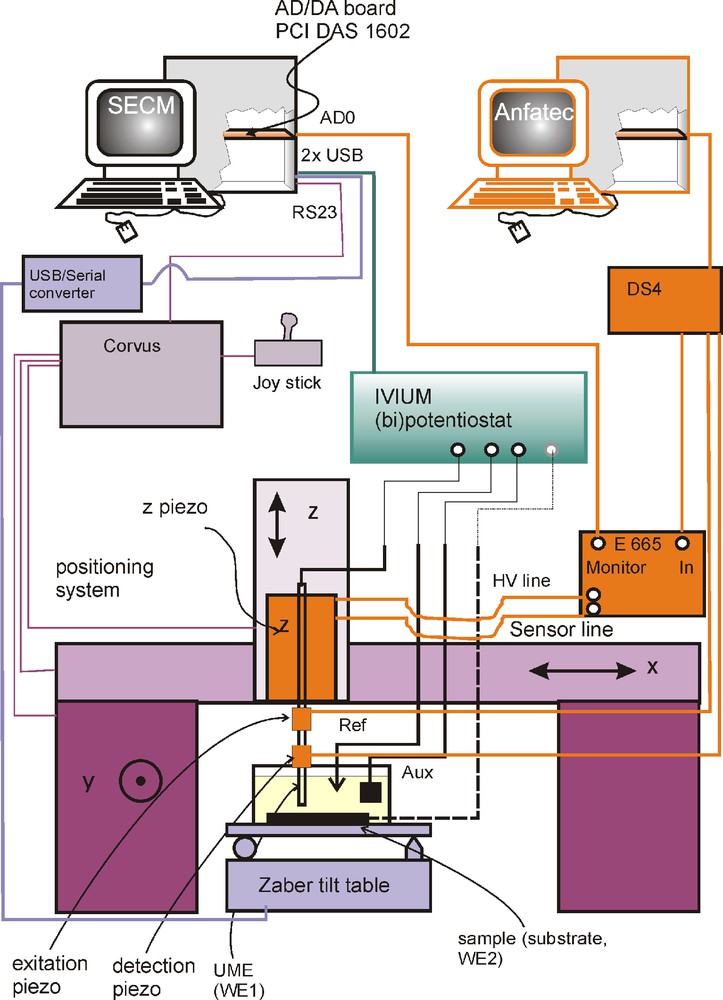
Experimental setup for shear force SECM system. Shear force excitation is according to Ballesteros Katemann et al. [38]. Shear force detection and distance regulation is performed by a commercial unit integrated in the SECMx setup.
The basic SECM system consisted of a positioning system (Märzhäuser GmbH & Co KG, Wetzlar, Germany) and a custom-made analog bipotentiostat (M. Schramm, University of Düsseldorf, Germany) interfaced to the PC via an analog-digital/digital-analog board (PCI-DAS 1602/16, Plug-In Electronic GmbH, Eichenau, Germany). The measurements were made in a three-electrode configuration with a Pt auxiliary electrode and a Ag wire as quasi-reference electrode (Ag-QRE). The signal from the position sensor of the linear piezo stage was also read by the analog-digital board and used to construct a topographical image. This instrument is operated with the in-house developed control software SECMx [42]. Data are processed with the in-house developed software MIRA [43].
3 Results and discussion
3.1 Characterization of nanoelectrodes
The shape of the microelectrodes can be determined by scanning electron microscopy (SEM). According to a procedure by Arimoto et al. [44], the ultramicroelectrode was wetted by a room temperature ionic liquid (RTIL) (1-ethyl-3-methylimidazolium bis(trifluoromethyl)imide) to provide conductivity for imaging the composite of the wire inside an insulating quartz glass matrix. This avoids the use of gold or carbon sputtering that would otherwise modify the electrode. Fig. 3a, b and c shows SEM images of the prepared nanoelectrodes. A very smooth Pt nanodisk located at the center of the probe suggests the successfulness of the method used. The diameters of the glass shield rglass and of the active electrode tip rT, and RG = rglass/rT of the three nanoelectrodes are given in Table 1.

SEM image of a shear force SECM probe tip made from a laser pulled quartz glass capillary with a Pt wire inside. A typical steady-state CV response of a Pt nanoelectrode probe in a solution of 4 mM [Ru(NH3)6]3+ and 0.1 M KNO3.
The rglass, rT and RG of nanoelectrodes as determined from SEM and calculate from the steady-state cyclic voltammograms.
| Electrode | rglass/μma | rT/nma | rT/nmb | RG = rglass/rTa |
| a | 20 | 610 | 206 | 32 |
| b | 11 | 418 | 96 | 26 |
| c | 9 | 348 | 53 | 25 |
a From SEM image.
b From rT = iT,∞/4nFDc*.
To verify the functioning and stability of probe electrodes over sufficiently long time, steady-state cyclic voltammetry was carried out in aqueous solution of 4 mM [Ru(NH3)6]3+ + 0.1 M KNO3. The cyclic voltammograms (CVs) obtained are shown in Fig. 3d. Sigmoidal CVs were obtained. The measured diffusion-limited steady-state tip currents showed stable and consistent values over a repeated cycling. The diffusion-limited steady-state current allows determination of probe geometry and size. The electrode radius can be computed from the diffusion-limited ultramicroelectrode (UME)-currents using equation, rT = iT,∞/4FDc*, where D = 7.4 × 10⁻⁶ cm2 s−1 is the diffusion coefficient of [Ru(NH3)6]3+ measured from chronoamperometry in the electrolyte used, F is Faraday's constant and c* = 4 × 10⁻⁶ mol cm−3 is the bulk concentration of [Ru(NH3)6]3+. For smaller size probes, the calculated and optically determined dimension can deviate very significantly. This might be due to slightly recessed electrodes often obtained by pulling or polishing. This would lead to an rT smaller than measured microscopically. On the other hand, small metal structures sealed in insulating matrices appear larger due to charging effects. Although the use of an ionic liquid limits this effect, it is still present here.
3.2 Experimental evaluation of SECM kinetic window
SECM imaging can provide reaction rate imaging if the current response follows the regime of finite kinetics at the sample [45,46], i.e., if the response at the working distance (e.g. d = rT) can be clearly distinguished from the prediction of an insulating, inert sample [47,48] and from diffusion-controlled mediator recycling. The finite kinetics is described by a normalized dimensionless heterogeneous rate constant κ. If we assume that a response with κ = 0.03 can just be distinguished from the case of κ = 0 and κ = 3.6 can be separated from κ = ∞ (Fig. 4a). We call the range 0.03 ≤ κ ≤ 3.6 the “kinetic window” in which reaction rate imaging is possible. A zone diagram is obtained by plotting keff vs. rT with lines for κ = 0.03 and κ = 3.6 (Fig. 4b). It illustrates clearly that smaller probe electrodes (desirable for high resolution) require increasing reaction rates [1,49]. The normalized rate constant can be increased by decreasing D but this requires slower imaging to maintain a steady-state situation [16]. These relations have also been verified experimentally [29]. Fig. 4c illustrates the situation of a quasi-infinitely large uniform sample. Taking into account the dependence of the signal on the sample size, further limitations are imposed as shown in Fig. 4c. If the radius of active sample regions rS < 0.05 rT, the chemical flux generated by them becomes too small for detection [49]. This corresponds to the uncolored transparent regions in Fig. 4c. On the other hand, if rS > rT + 1.5 d, the sample behaves like an infinitely large sample (red, green, blue volumes in Fig. 4c) where a kinetic investigation based on popular analytical approximations of simulation results is possible [45]. In between those regions, there is transition region (olive in Fig. 4c), in which imaging might be possible under favorable conditions but a quantitative analysis would require specific simulations for the sample under study.
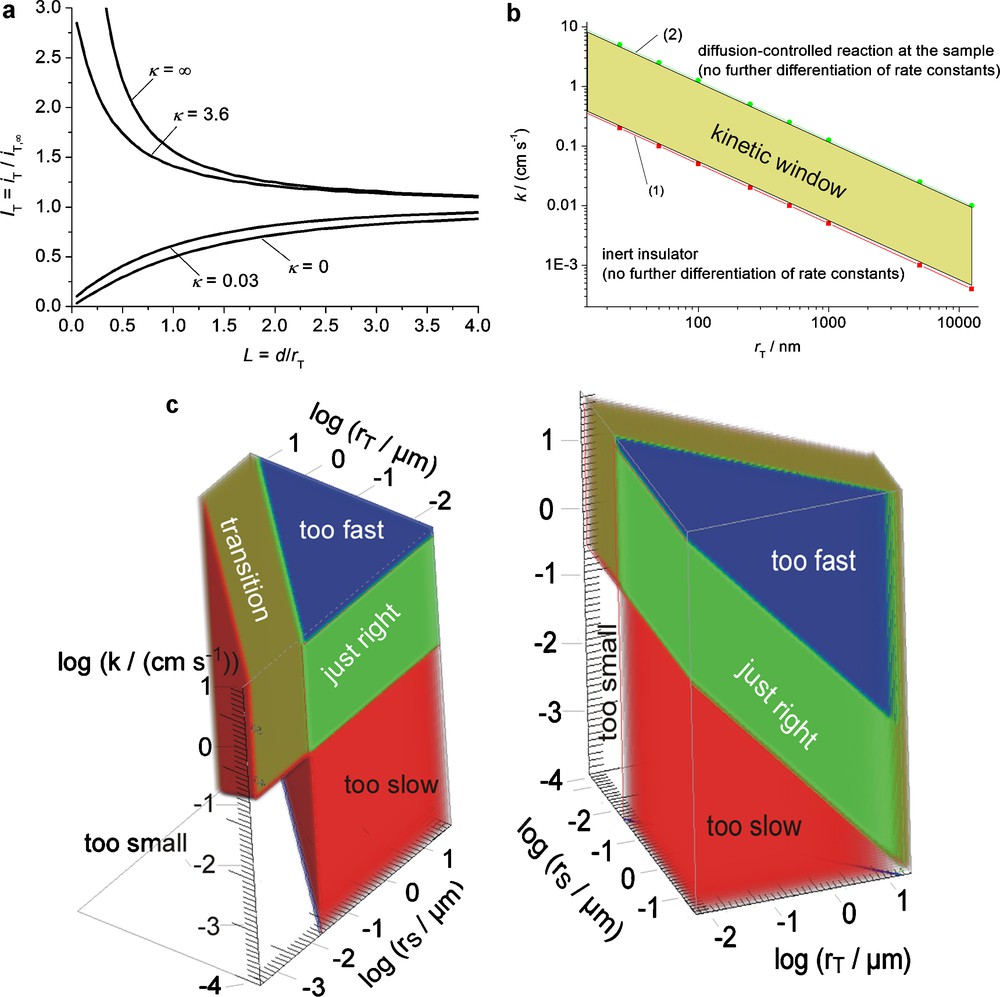
a: calculated approach curves [45] for feedback mode for a disk of rT = 12.5 μm, RG = 10; b: plot of kinetic window defining the regions of finite kinetics of substrate reaction on quasi-infinitely large substrates, diffusion-controlled response and hindered diffusion regime; c: SECM working regimes for finite kinetics and finite substrate sizes for d = rT and RG = 10.
3.3 Characterization of UME vibration properties
The vibration spectra of an oscillating nanoelectrode between 100 kHz and 300 kHz is shown in Fig. SI-1 and was recorded at the applied bias of 2 V in solution with a piezo-stimulator and detector fastened to the UME body at 45°. By comparing the amplitude damping at different positions, the electrode is excited at one of the detected frequencies. Fig. 5 depicts a typical amplitude change as a function of probe-substrate separation. The approach of the probe is made with the stepper motor (having the vertical position z1), while the distance control feedback loop at the DS4L is on. This leads to a movement of the piezo motor (having the vertical position z2) to the most extended position as long as the surface is not found. As the stepper motor brings the vibrating probe within about 1 μm of the sample surface, damping of the vibration is detected and the piezo motor retracts while the stepper motor is still moving towards the sample (Δz1 = −Δz2). The movement is interrupted by the user if the piezo is approximately at the midpoint of its movement range. The subsequent lateral scans are made with a fixed position z1 of the z-stepper motor leaving the z-piezo motor to maintain a constant distance over tilted and rough samples.
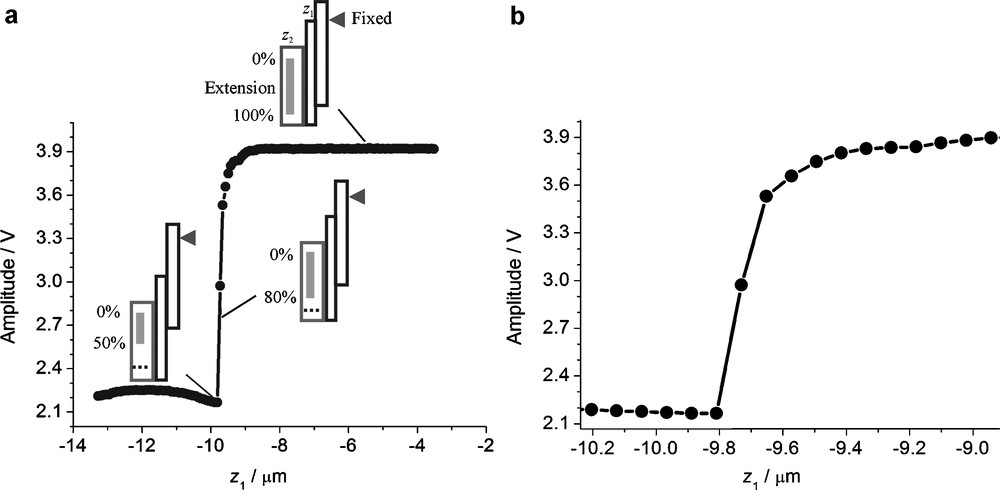
a: amplitude change of the oscillating probe as a function of the stepper motor displacement; b: zoom-in at the region of amplitude change in (a). Parameters: detected frequency = 270 kHz, speed = 0.2 μm s−1, step size = 0.1 μm.
Evaluating the amplitude and/or phase change provides the input for a distance control system. The amplitude and phase signals can be displayed on an oscilloscope which is a useful control for the correct operation of the system (Fig. 6). If the UME is far away from the surface, the amplitude and phase signal appeared as noisy and irregular (Fig. 6a). When the probe touches the surface, the oscilloscope signal becomes deformed (Fig. 6b). If the probe is at the shear force detection limit, the amplitude and phase signal are constant with spikes representing the error signal to which the distance regulation feedback loop is responding (Fig. 6c, d). The deviation from the set-point is immediately counteracted. The fast response of the signal is a pre-requisite to achieve sufficiently high lateral scan rates while maintaining distance regulation.
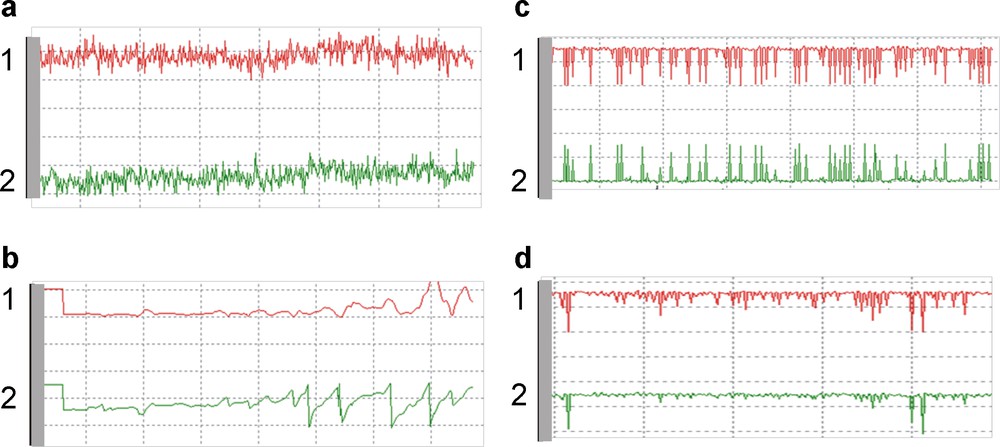
Oscilloscope output from the shear force system for probe-substrate distance control. (1) Amplitude (mV) (upper trace) and (2) phase (°) (lower trace) at the resonance frequency of the microelectrode recorded when the UME is immersed in solution and (a) far away (> 700 nm) from the substrate (b) UME touching the surface, (c) and (d) when the UME is in the proximity of the substrate (500–700 nm). Parameters of vibration: detected frequency = 270 kHz, amplitude = 370 mV.
Setting a pre-defined distance can be done in the following way. The electrode is approached with the shear force regulation switched-on until the surface is found. The positions z1,0 and z2,0 are recorded. Then the shear force regulation is switched off by setting the integral gain ki to zero in the SXM software. Either with the stepper motor (nominal resolution 50 nm) or the piezo actuator the electrode is retracted to the desired distance. For instance in order to initiate the recording of an approach curve that starts within a reasonable distance from the surface (i.e. 15 rT). The shear force distance regulation is switched-on again by setting ki to values in the optimum range of 200–250. This range has been empirically determined. At too low ki the surface is not followed accurately, while too high ki leads to strong noise in topographical data. To separate such noise from topographical features, we always record forward and backward scans as in conventional scanning force microscopy. It can then be observed at which distance from the surface (taken at the position z1,0 + z2,0) the distance regulation will maintain the electrode position for a given set-point. The set-point is given as ratio of the amplitude to the amplitude in solution (optimum range 90–98%). Several experiments showed that a stable distance regulation indicated by an oscilloscope response as in Fig. 6c, d is obtained only in a narrow absolute distance range of 500–700 nm. This has important implications for the size of the active electrode area rT that can be used with this shear force system.
The vibration of the microelectrode has a clear influence on the current response. We observe that iT,∞ increases under vibration and the increase of the vibration is changing from electrode to electrode as well as between different mountings of the same electrode. This is expected as the amplitude at the end of the probe varies with frequency and excitation amplitude (selected to obtain optimized response of the distance regulation, typically 350 mV). When normalizing approach curves of the same probe electrode with and without vibrations, small differences remain between the two curves indicating that qualitative imaging is well possible but quantitative studies are discouraged.
3.4 Examples of simultaneous topographic and reactivity imaging
In order to demonstrate the imaging capability, the topography and electrochemical reactivity of gold micro bands on a glass substrate was imaged in aqueous solution of 4 mM [Ru(NH3)6]Cl3 in 0.1 M KNO3 (Fig. 7). The potential of the nanoelectrode was −0.6 V (Ag-QRE). From the topography image, the height and width of gold structures were found to be 180 nm and 50 μm, respectively (Fig. 7b), which is in a good agreement with CLSM data (Fig. 7a) and AFM (Supporting Information Fig. SI-2). When the nanoelectrode moved above the gold band, the current signal increased due to positive feedback resulting from redox cycling (Fig. 7b). The currents in normalized quantities change from IT = 0.8 over glass to IT = 2.3 over gold bands (Fig. 7b). With iT,∞ = −130 nA, this corresponds to iT = −100 pA over glass and iT = −300 pA over gold. A two-dimensional scan shows that the tilt seen in the topographic image (Fig. 7c) is compensated (Fig. 7d) and that fine structures in the topography as well as the current response are visible.
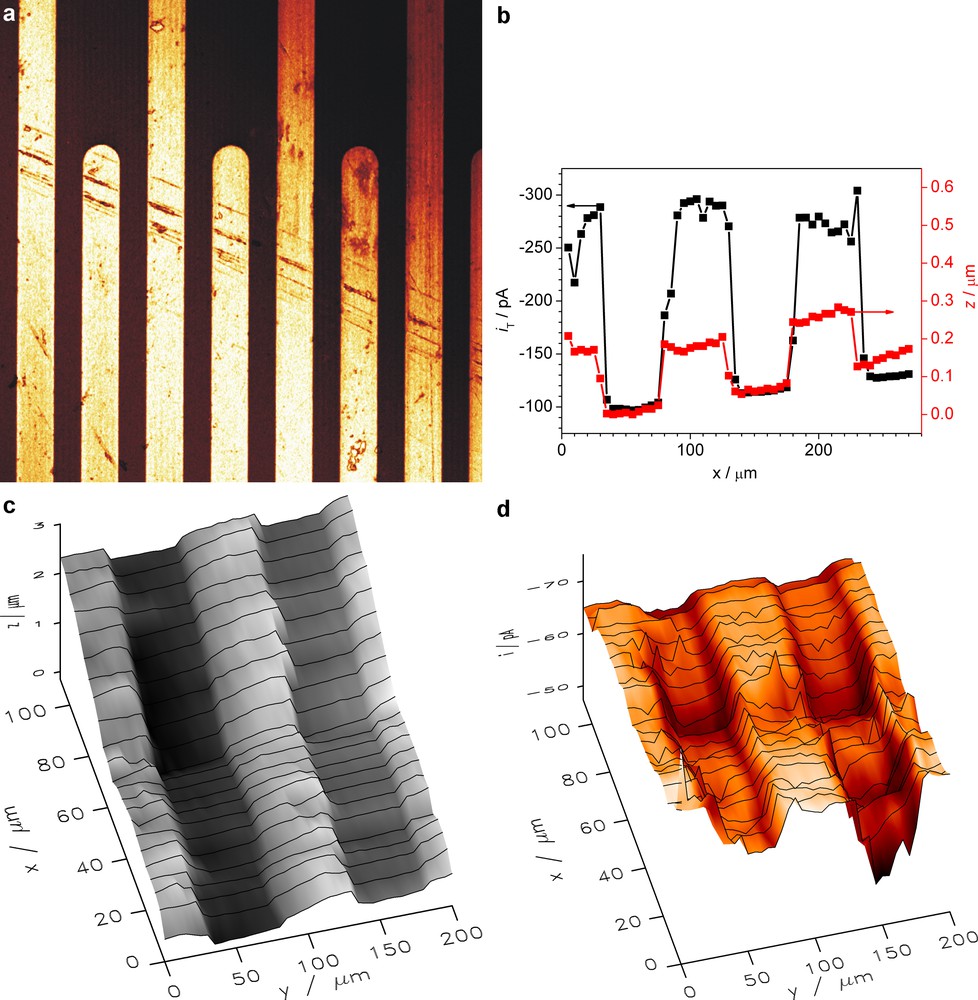
a: CLSM reflection image. b: line scan of topography and reactivity simultaneously; c: topography image; d: SECM feedback image with the shear force mode. Working solution: 4 mM [Ru(NH3)6]Cl3 + 0.1 M KNO3; ET = −0.6 V (vs. Ag-QRE), scan rate 20 μm s−1, step size 5 μm, rT = 350 nm, amplitude = 370 mV, detected frequency = 270 kHz.
4 Conclusion
The kinetics of the sample to be investigated dictates a minimum size of the probe electrode if the SECM feedback mode is to be employed. This is often desirable because of the high lateral resolution (in comparison to other SECM modes) and because of the well-established theory. A shear force detection system with a commercial electronic feedback controller is suitable for operating electrodes with radius of around 300 nm in constant distance mode. The absolute working distance for which stable responses are obtained is in the range of 500–700 nm. The use of even smaller electrodes requires higher sample kinetics (not often found in practical samples) and a distance regulation mechanism that can maintain smaller absolute working distances. However, such electrodes may still be employed in the sample-generation/tip-collection (SG/TC) mode if the low absolute currents can be handled. This is increasingly possible as commercial potentiostats for low current application improve. However, the SG/TC mode has an inherently lower lateral resolution which is determined by the size of the diffusion layer above the sample (if the probe is smaller than that size).
Acknowledgment
U.M.T. thanks for a grant of German Academic Exchange Service (DAAD) and the Max Buchner Foundation.