

1 Introduction
Alloying of metals is a way of developing new materials that have better technological usefulness than their parent metals. The most important examples of bimetallic alloy nanoparticles are Ag-Au, Ag-Ti, Pd-Pt, Au-Pd and Ag-Cu. Alloy nanoscale materials show different structural and physical properties than bulk samples [1,2]. Increase in the solubility of alloy components with decreasing particle size is one of the prominent effects. It has been theoretically and experimentally shown that the enhancement of solid solubility in nanoparticles is possible in systems where equilibrium bulk solid solubility limit is very small [3,4]. Bimetallic nanoparticles are more attractive over monometallic nanocrystals because they exhibit improved electronic, optical and catalytic properties [4,5]. Moreover, the change in composition of metals provides another dimension in tailoring the properties of bimetallic nanoparticles besides the usual size and shape manipulation.
Bimetallic nanoparticles may have random, cluster-in-cluster, core shell and alloy structures. In a random structure, atoms in bimetallic nanoparticles are arranged haphazardly. In cluster-in-cluster structures, one element forms nanoclusters and the other acts as a binder. In bulk metals, two kinds of metal elements often provide an alloy structure. If the atomic sizes of two elements are similar to each other, then they will form a random alloy while elements with different atomic sizes form an intermetallic alloy. In fact, we have found that bimetallic nanoparticles between precious metals and light transition metals have intermetallic alloy-like structures.
Among metal fillers, Ag flakes are most widely used because Ag has the highest electrical conductivity and, unlike many other metals, its oxides are also relatively better conductors [6]. However, there have been some concerns on the electromigration of Ag ions in the Ag filled adhesives in the presence of high humidity and electrical bias. Thus, another cost effective metal i.e., copper has been proposed as alternate conductive filler in electrically conductive polymer composites, due to its high electrical conductivity, low electrical migration and high compatibility with the next generation of Cu related technology. However, the existence of pure copper is difficult due to its facile oxidation. Additionally the generation of copper from its salts requires complete inertness. Alloying of Cu with Ag is an effective approach to improving its electrical performance.
Among a variety of bimetallic nanoparticles, Ag-Au nanoparticles have been investigated as a candidate material for electrode designing and interconnection lines in flexible electronics, since Ag films have a lower resistivity (1.63 Ω) and melting point (962 °C) than other metal films. Nevertheless, pure Ag lines are liable to induce system failure due to electromigration of ions. It has been reported that the alloying of Cu with Ag reduces the electromigration [7,8]. Interconnection lines composed of Ag-Cu alloy nanoparticles fabricated on poly ether sulfone (PES) substrates can be successfully prepared and their electrical characteristics can be investigated with and without optical heating. Bimetallic alloy nanoparticles embedded in surfaces regions of glass are of great interest because of their potential applications [9,10]. Specific linear and nonlinear optical properties have already been achieved for Ag-Cu alloy nanoparticles in silica glasses [11]. As the resulting macroscopic properties of alloy nanoparticles are based on a surface plasmon resonance and the frequency of which strongly depends on composition so Ag-Cu alloy nanoparticles were prepared in different ratios.
Chemical reduction and physical methods are commonly used to synthesize bimetallic nanoparticles. Sayed and Murphy used chemical reduction method for the formation of Ag/Au alloy nanoparticles with largest diameter of 18 and 10 nm respectively [12,13]. Yeh and Simard used laser irradiation of silver-gold colloidal mixture to synthesize Ag/Au alloy nanoparticles [14]. Although this physical method is prefered for higher yield it is not suitable for the production of small particles with a narrow distribution of size. We preferred the chemical reduction method (Polyol method) for the preparation of finely divided Ag-Cu alloy nanoparticles and employed UV-Visible, fluorescence and X-ray diffraction spectroscopy for their characterization.
2 Experimental
2.1 Method
In the Polyol method [15] ethylene glycol acts as a solvent and reducing agent. Polyvinylpyrilidone (PVP) is used as a surfactant and stabilizer due to its ability to successfully prevent the self aggregation of Ag+ and Cu2+. Three millilitres of 1 mM copper acetate hydrate (CH3COO)2Cu.H2O and 3 mL silver nitrate AgNO3 (1 mM) were mixed in a 25 mL beaker. 3 mL of 1 mM PVP was added to the sample. The solution was purged with nitrogen for 30 min. The sample was kept at 175 °C in oven for 20 min. The appearance of the blackish brown color indicated the completion of the reaction. The formation of Ag and Cu nanoparticles was ascertained from their λmax at 410 and 537 nm, respectively. The formation of these nanoparticles was aimed at comparing their UV-Visible spectra to Ag-Cu alloy nanoparticles of various compositions. For the preparation of Ag-Cu alloy nanoparticles, 3 mL of 1 mM copper acetate hydrate was added with 3 mL of 1 mM PVP. The solution was purged with nitrogen for 30 min. The mixture was kept in oven at 175 °C for 20 min. Just after removal from the oven, a UV-Visible spectrum was taken which showed no absorption peak pointing to the fact that no Cu nanoparticles have been prepared. Three millilitres of 1 mM AgNO3 was poured into the mixture. The reaction started immediately and color of the solution turned black and then changed to reddish brown in five minutes. Thus Ag-Cu alloy nanoparticles of composition 1:1 showing λmax at 466 nm were prepared. For the preparation of alloy nanoparticles of different compositions the same method was used. However, the ratio of copper acetate hydrate and silver nitrate were different. The amount of PVP used was half of the mixture volume. Heating and purging time were also different. The ratio of the chemicals used, time of purging and heating at constant temperature for various samples have been listed in the Table 1.
Chemicals and conditions required for preparation of various composition of Ag-Cu alloy nanoparticles.
| S. No. | Composition Ag-Cu | Volume/ml AgNO3 | Volume/ml (CH3COO)2Cu.H2O | PVP/ml | Time of Purging/min | Heating time 175 °C/min |
| 1 | 4:1 | 4 | 1 | 3 | 30 | 20 |
| 2 | 3:1 | 6 | 2 | 4 | 35 | 30 |
| 3 | 2:1 | 4 | 2 | 3 | 30 | 20 |
| 4 | 1:1 | 3 | 3 | 3 | 30 | 20 |
| 5 | 1:2 | 2 | 4 | 3 | 40 | 20 |
| 6 | 1:3 | 2 | 6 | 4 | 45 | 30 |
| 7 | 1:4 | 1 | 4 | 3 | 40 | 20 |
All the samples prepared were centrifuged at 6000 rpm for 30 min and kept in oven for drying overnight at 25 °C. In this way powdered alloy nanoparticles were prepared which were washed several times with acetone for the complete removal of PVP. The powder was then scratched from the tubes for XRD studies.
2.2 Chemicals
Analytical grade reagents were used with details given in Table 2.
Details of the chemicals used.
| S. No. | Compounds | Molecular mass/g | Solubility in ethylene glycol | Purity (%) | Purchased from |
| 1 | AgNO3 | 169.87 | Soluble | 99.95 | Fluka |
| 2 | (CH3COO)2Cu.H2O | 199.65 | Soluble | 98.00 | Merk |
| 3 | Poly(n-vinyl) pyrolidon | 40,000 | Soluble | 88.00 | Amresco |
| 4 | Ethyleneglycol | 62 | Soluble | 99.00 | Sigma-aldrich |
2.3 Instruments
UV-Visible Spectrophotometer Shimadzu 1601 was used for the determination of λmax and extinction coefficient
3 Results and discussion
Bimetallic alloy nanoparticles of Ag and Cu of various compositions were synthesized. Pure Ag and Cu nanoparticles were also synthesized for reference. XRD techniques, UV-Visible and fluorescence spectroscopy were used for their characterization.
3.1 UV-Visible spectroscopy
3.1.1 Effect of composition on λmax
The UV-Visible spectra of pure Ag and Cu nanoparticles have been shown in Figs. 1 and 2. It can be observed from the spectra that pure Ag and Cu exhibit a single peak each with maximum absorption at 412 and 541 nm, respectively. The values are comparable to their literature reported λmax values of 410 and 544 nm [16]. UV-Visible spectra of Ag-Cu alloy nanoparticles with various ratios of Ag and Cu have been depicted in Fig. 3. The spectra reflect that as composition of Cu increases λmax shows a shift towards longer wavelength. This experimental evidence can be linked to the formation of Ag-Cu alloy nanoparticles. The figure further demonstrates that none of the sample shows the peak corresponding to pure Ag or Cu thus offering evidence for the formation of alloy of these elements. The λmax values have been tabulated in Table 3.
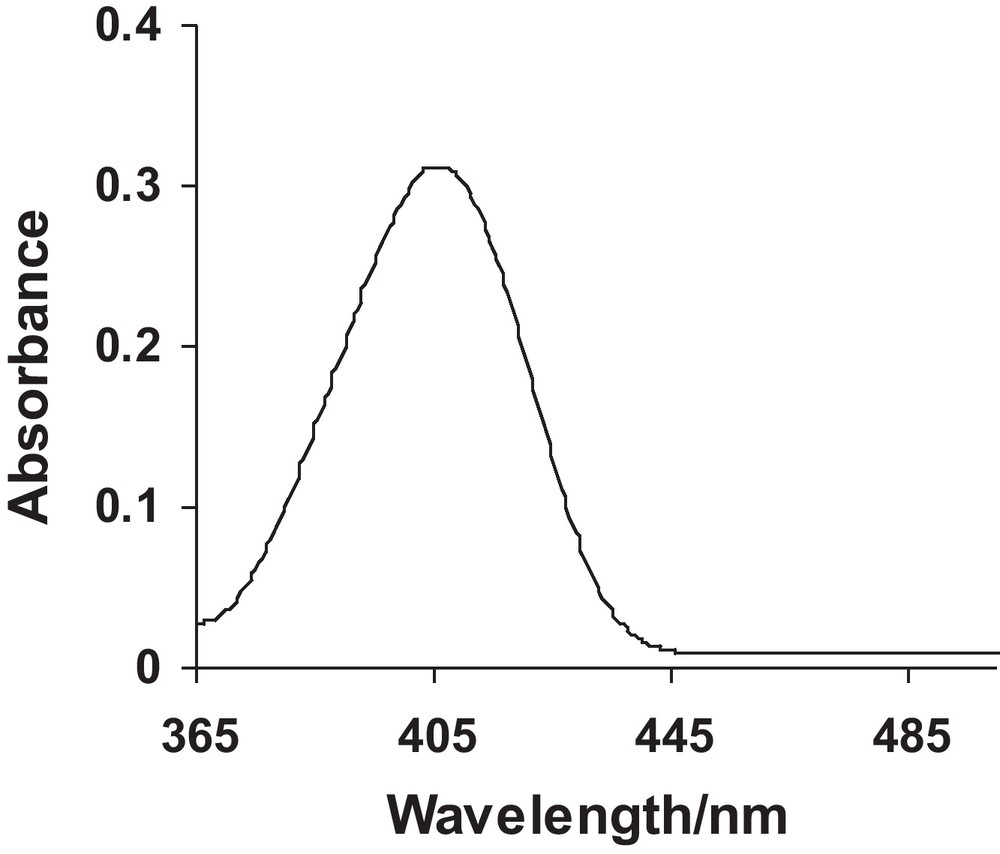
UV-Visible spectrum of Ag nanoparticles.
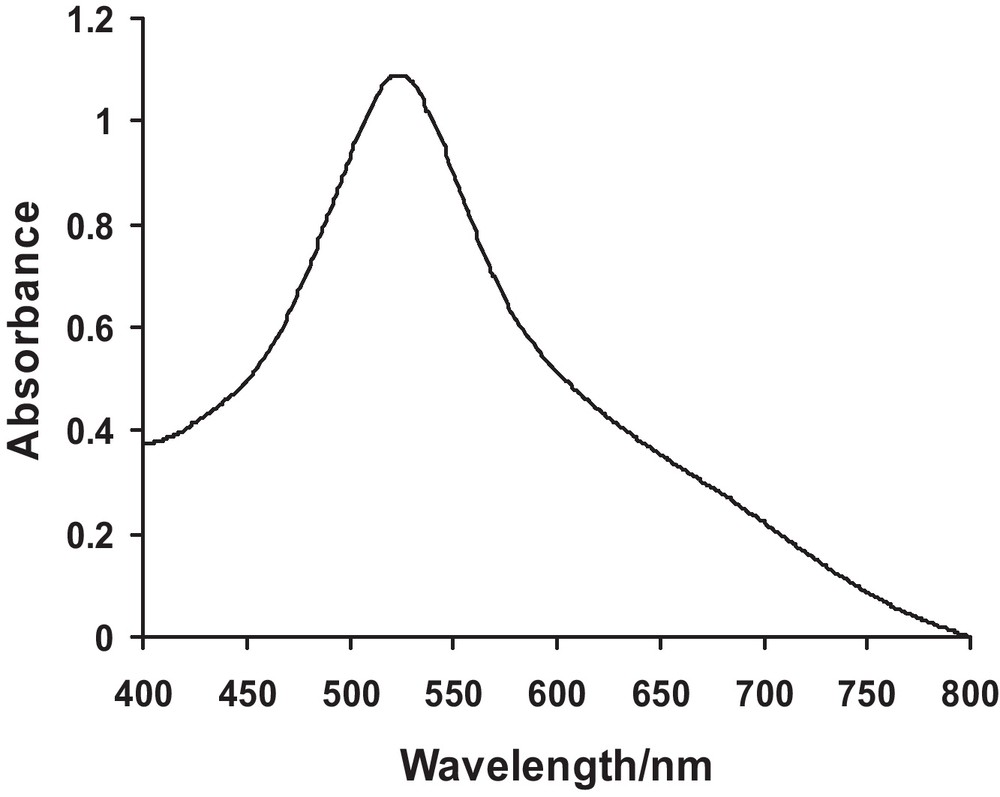
UV-Visible spectra of Cu nanoparticles.
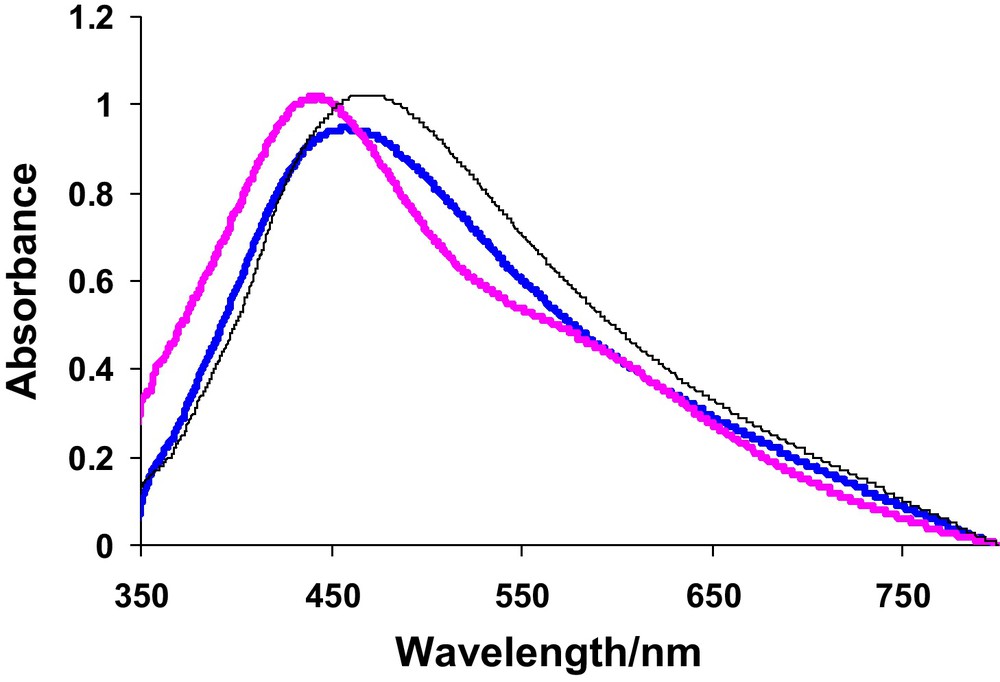
UV-Visible spectra showing shift in λmax for 4:1 Ag-Cu (), 1:1 Ag-Cu () and 3:1 Ag-Cu ().
Parameters obtained form UV-Visible spectroscopy of samples.
| S. No. | Composition Ag-Cu | Mole fraction of Ag | Mole fraction of Cu | Absorbance | ɛ/M−1cm−1 | λmax/nm |
| 1 | 4:1 | 0.8 | 0.2 | 0.95 | 284.23 | 451 |
| 2 | 3:1 | 0.75 | 0.25 | 0.87 | 220.53 | 458 |
| 3 | 2:1 | 0.67 | 0.33 | 0.85 | 186.66 | 464 |
| 4 | 1:1 | 0.5 | 0.5 | 1.02 | 1054.33 | 466 |
| 5 | 1:2 | 0.33 | 0.77 | 1.00 | 843.68 | 470 |
| 6 | 1:3 | 0.25 | 0.75 | 0.80 | 616.89 | 498 |
| 7 | 1:4 | 0.2 | 0.8 | 0.78 | 201.38 | 512 |
3.1.2 Effect of composition on molar extinction coefficient
For the evaluation of ɛ, the UV-Visible spectra of all the prepared samples were recorded at different concentration. The absorption coefficient was obtained from the slope of the plot of concentration versus absorbance using Beer-Lambert Law:
| (1) |
The absorption peaks in the UV-Vis region may be due to the localized surface plasmon resonance (SPR), which can be predicted by the well-known Mie resonance condition [17,18]. The surface plasmon absorption band shows red shift and the color of the colloidal solution changes from yellow to red with increasing copper content. If pure metal nanoparticles are mixed physically in the same solution, two plasmon bands are expected to be observed, whereas for alloys a single plasmon band is expected. Appearance of a single surface plasmon band in Fig. 3, for solutions of alloys with varying copper content, confirms the formation of alloy particles. UV-Visible spectroscopy revealed that with the increase in composition of Cu in Ag-Cu alloy nanoparticles a regular decrease in absorbance and molar absorption coefficient up to 1:1 Ag-Cu alloy nanoparticles was noticed (Table 3). At this ratio the nanoparticles show abrupt changes in absorption maxima and molar absorption coefficient. As λmax depends upon the size and shape of the particle so such a sudden jump may be attributed to the decrease in close packing of Ag and Cu due to the difference in their sizes. With further increase in composition of Cu there is again a regular decrease in absorbance as well as in molar absorption coefficient indicating the compactness in packing. Hence at 1:1 ratio, Ag-Cu alloy nanoparticles show maximum values of absorbance (1.02) and ɛ (1.05 × 10³ M−1cm−1) which indicates homogeneity of the alloy nanoparticles, while λmax shifts regularly towards higher values with increase in composition of Cu. This trend can be seen in Table 3. The gradual red shift is attributed to the increase in refractive index of the medium. Valodkar et al., have also reported that the bathochromic shift in surface plasmon band depends not only on the particle size but also on the refractive index of the surrounding medium [18].
3.1.3 Effect of change in mole fractions of Cu and Ag on λmax
If we plot λmax of pure Ag, samples Ag-Cu 4:1, Ag-Cu 3:1, Ag-Cu 2:1, Ag-Cu 1:1, Ag-Cu 1:2, Ag-Cu 1:3, Ag-Cu 1:4 and pure Cu nanoparticles versus mole fraction of Cu we observe increasing trends as shown in Fig. 4. It means that increase in mole fraction of Cu causes an increase in λmax. Such an increase continues till pure form of copper [16,19]. The first point shows maximum wavelength of pure silver at 412 nm while the last point is for pure Cu nanoparticles showing λmax at 541 nm. The middle points show the λmax of Ag-Cu 4:1, Ag-Cu 3:1, Ag-Cu 2:1, Ag-Cu 1:1, Ag-Cu 1:2, Ag-Cu 1:3 and Ag-Cu 1:4 respectively.

Plot of λmax vs. mole fraction of Cu.
3.2 Fluorescence spectroscopy
Copper and silver nanoparticles give characteristic fluorescence signals at 645 and 485 nm. The origin of the fluorescence in Ag can be attributed to the promotion of d band electrons of the silver metal nanoparticles to electronic states in the sp-band. The emission of Cu nanoparticles is assigned to the transitions from excited states to d orbital. If pure copper and silver nanoparticles are mixed physically in the same solution, two emission bands are expected to be observed, whereas for alloys a single emission band is expected. Appearance of a single surface fluorescence band in Fig. 5, for colloidal solutions of alloys with varying copper content, confirms the formation of alloy particles. From the fluorescence spectra of Ag-Cu alloy nanoparticles it was observed that Cu acts as quencher, causing decrease in intensity of emission radiations. The emission λmax for fluorescence is higher than absorption λmax and there is small shift in λmax for fluorescence by changing the composition of Ag or Cu in Ag-Cu alloy nanoparticles.
Fluorescence accumulative spectra of Ag-Cu 4:1, Ag-Cu 3:1, Ag-Cu 2:1, Ag-Cu 1:1, Ag-Cu 1:2, Ag-Cu 1:3 and Ag-Cu 1:4 at emission wavelength of their corresponding λmax in UV-Vis spectroscopy.
In the spectra of Ag-Cu alloy nanoparticles shown in Fig. 5, there is a regular decrease in the intensity with increase in composition of Cu. It means that Cu is acting as a quencher [20]. In sample Ag-Cu 4:1 the spectra almost disappear due to the high composition of Cu. Hence fluorescence spectroscopy for alloy samples reveals that as the composition of Cu increases a slight blue shift in λmax and hypochromic effect in the intensity is observed.
The intensity in the presence and absence of quencher is related to the concentration of the quencher and sample.
| (2) |
| (3) |
| (4) |
Parameters obtained from fluorescence spectroscopy.
| S.No. | Sample | Io | IQ | λmax/nm | Number of atoms (n) | Binding site (n) | Binding constant (kb) | ΔGb KJ/mol |
| 1 | AC41 | 280 | 240 | 610 | 248 | 0.31 | 12.39 | −6.24 |
| 2 | AC31 | 280 | 225 | 608 | 364 | 0.23 | 7.32 | −4.93 |
| 3 | AC31 | 280 | 194 | 605 | 525 | 0.16 | 4.82 | −3.95 |
| 4 | AC11 | 280 | 190 | 603 | 616 | 0.83 | 164.82 | −12.65 |
| 5 | AC12 | 280 | 98 | 601 | 657 | 0.94 | 444.43 | −15.11 |
| 6 | AC13 | 280 | 94 | 598 | 734 | 1.79 | 693.43 | −16.21 |
| 7 | AC14 | 280 | 90 | 596 | 806 | 2.19 | 2880.5 | −31.14 |
As discussed earlier there is regular decrease in intensity with the increase in composition of Cu in Ag-Cu alloy nanoparticles. Such variation can be seen in Fig. 5 for all samples. Hypochromic effect is observed with the increase in composition of Cu. The spectra of Ag-Cu 2:1 and Ag-Cu 1:1 overlap which shows very small gap between them. In similar way Ag-Cu 1:2 and Ag-Cu 1:3 also show very small difference in their intensities. This may be due to the similarity of the crystal structures of components of the pairs having equal intensity. Such decrease in the intensity is attributed to the increase in composition of Cu which acts as a quencher [21]. An examination of the parameters obtained from fluorescence spectroscopy (Table 4) it can be concluded that the intensity diminishes in the presence of quencher IQ with the rise in composition of Cu which acts as a quencher. The highest intensity is observed for Ag-Cu 4:1 due to the small composition of Cu in it while the lowest intensity is observed for Ag-Cu 1:4 that has maximum composition of Cu. There is a regular decline in λmax with increase in composition of Cu. The number of atoms N also shows a regular increase as composition of Cu is rising due to smaller atomic radius of Cu. Binding sites (n), binding constant kb and free energy of binding (ΔGb) first diminish until Ag-Cu 1:1 and then show a regular rise with increase in composition of Cu. It can also be observed that the process gets more spontaneity as composition of Cu is raised. This may be due to the smaller size of Cu.
3.3 X-ray diffraction spectroscopy (XRD)
XRD has been a well established useful characterization technique for the study and evaluation of the crystal lattice information of the system as well as morphology and size of crystallite. The XRD patterns of Ag-Cu alloy nanoparticles with various compositions of Ag and Cu have been recorded. The peak shift was observed only in the Ag peak positions due to the addition of Cu into Ag matrix. No shift was seen in the Cu peak positions. On the other hand, significant Ag incorporation into the Cu matrix is less probable [22]. Five peaks i.e., (111), (200), (210), (220) and (311) were observed as shown in Fig. 6. Every peak shows crystal plane exposed to X-rays and different position of lattice point in crystal lattice. Moreover, they also provide useful information about the crystal structure. Two peaks i.e., (111) at 37 and (220) at 73 were taken the desired peaks and selected for particle size calculation. 2θ of the desired peaks shifted slightly towards higher values which show diminution in the size of crystalloid. Hence contraction occurred in the crystallite which causes a lowering in the size of alloy nanoparticles. Such a decrease in the size of alloy nanoparticles was also confirmed by a regular increase in width of the desired peaks as the composition of Cu is increased. Some extra peaks also appear in sample AC11 onward to AC14 due to decrease in the size of nanoparticles which expose more crystal sites for X-rays.
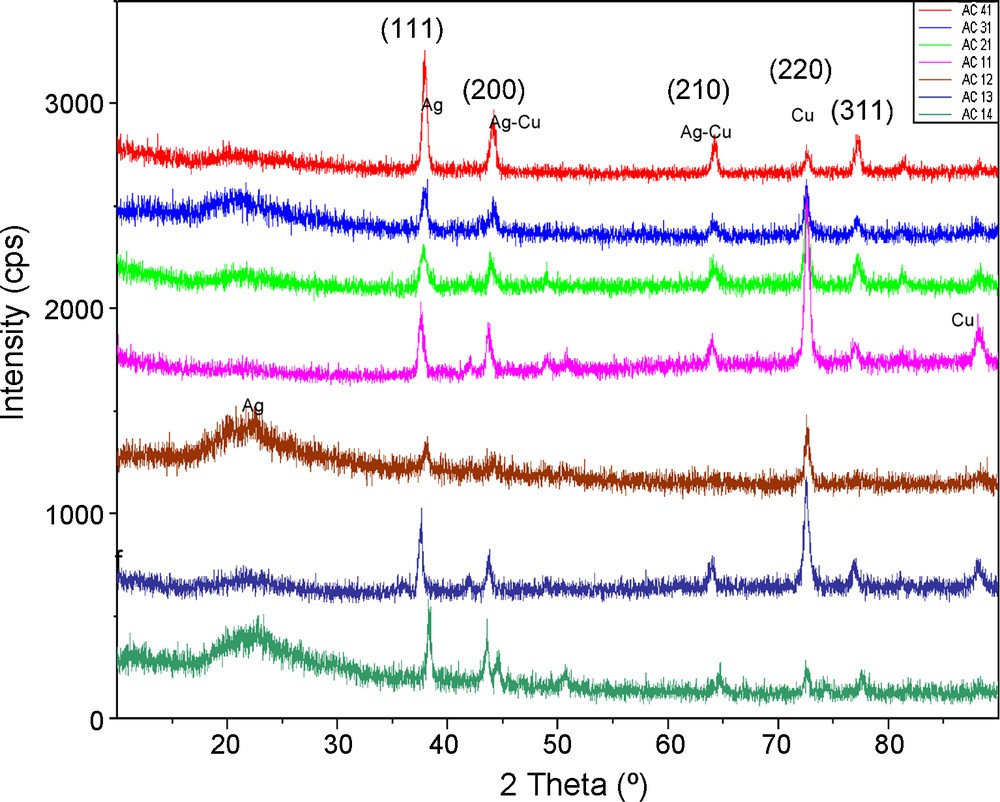
XRD spectra for samples Ag-Cu 4:1, Ag-Cu 3:1, Ag-Cu 2:1, Ag-Cu 1:1, Ag-Cu 1:2, Ag-Cu 1:3, Ag-Cu 4:1.
These results suggested that the samples have two kinds of compositions: Ag metal with Cu dissolved in them and pure Cu metal. The atomic radii of Cu and Ag are 0.14 nm and 0.16 nm respectively. Cu being smaller dissolves in Ag matrix that causes lattice contraction [23]. A comparison of the spectra is shown in Fig. 6. It was observed that the size of nanoparticles reduced as composition of Ag diminished in Ag-Cu alloy nanoparticles as shown in Table 5.
Average diameter of Ag-Cu alloy nanoparticles.
| S.No. | Composition (Ag-Cu) | Average diameter (nm) |
| 1 | 4:1 | 28 |
| 2 | 3:1 | 25 |
| 3 | 2:1 | 23 |
| 4 | 1:1 | 21 |
| 5 | 1:2 | 20 |
| 6 | 1:3 | 19 |
| 7 | 1:4 | 18 |
Size of nanoparticles was calculated from the peaks of interest using Debye Scherer's equation:
| (5) |
4 Conclusion
Bimetallic alloy nanoparticles of Ag and Cu of various compositions were successfully synthesized by Polyol method. Pure Ag and Cu nanoparticles were also synthesized for reference. The synthesized particles were characterized by fluorescence, UV-Visible and X-ray diffraction spectroscopy. The effect of composition on maximum absorbance wavelength and molar absorption coefficient was quantified by electronic spectroscopy. The high value of extinction coefficient was found for Ag-Cu alloy of 1:1 composition. The results of fluorescence spectroscopy revealed that in Ag-Cu alloy nanoparticles, Cu acts as a quencher, causing decrease in intensity of emission radiations. Number of atoms in a single nanoparticle, binding sites, binding constant and free energy of binding were evaluated from fluorescence data. X-ray diffraction spectroscopy was used for the calculation of average diameters of nanoparticles and study of crystal lattice composition.
Acknowledgement
Quaid-i-Azam University and Higher Education Commission Islamabad are highly acknowledged for financial support.