

1 Introduction
Nowadays, the extraction of ingredients from plant-based raw materials mainly proceeds without systematics and is thus primarily empirical. This leads to processes, which are not designed optimal concerning energy and solvent consumption as well as yield, purity and time effort. In contrast, there is an increasing demand for plant-based nutrition, flavours, drugs and cosmetics [1]. In addition, the optimal design of these processes is a crucial factor for the implementation of profitability because of the increasing competition. Despite the vast demand, a systematic approach that combines the botanic characteristics – like for example, the structure of the raw material – and the technical implementations is not established so far [2,3]. In the chemical industry, such an approach is state of the art. Here, the processes are designed and optimized in a model-based way. This design is time saving and cost-effective. For the design of extraction processes, these models are not yet approachable with sufficient accuracy because of the complexity of the systems.
First approaches for the systematic design and optimization are primarily developed in universities. These approaches are most often based on the statistical experiment design or physicochemical modelling. The extraction of oleaonolic acid and ursolic acid from sage [4,5] as well as the extraction of vanilla beans and pepper [6] or the extraction of sugar beets can be named as examples here [7].
Statistical modelling is a method based purely on experiments for the identification of factors, e.g. temperature, pressure, corn size or extraction time, which have a sensitive influence on a target, such as yield or purity. Thereby, the statistical model of the process can be created by using polynomial regression. These statistical models are able to describe and visualize the process in a predefined factor range by curve fitting of the experimental results. For every plant-based system to be examined the same experimental effort is required and further, due to lack of a physicochemical process base, a learning curve cannot be generated [6].
For the predicative description of extraction processes, primarily for the extraction using supercritical CO2, different physicochemical models are to be found in literature. These form a basis for a systematic approach. Thereby, the extraction equipment can be designed with small experimental effort and hence, time saving and cost-effective. Particularly, the three physicochemical approaches (1. shrinking core model [8,9], 2. model of broken and intact cells [10,11] and 3. desorption model [12,13]) can be mentioned here. A summary of the three modelling approaches with the respectively regarded substance systems is given in [5,14,15].
The effect of chemical properties as a starting-point for all process development has already been broadly described [3,6,14,16–18]. This paper focuses additionally on botanical and thermodynamic properties. Hence, a systematic approach is revealed, discussed and combined with the examinations of the botanic characteristics; the focus is on the integration of botanic and thermodynamic aspects as well as the selection and evaluation of the extraction equipment through physicochemical models.
2 Material and methods
The experimental setup for the process design and/or optimization consists of different methods for 1. pre-treatment of the raw material, 2. a standard apparatus for measuring phase equilibrium in maceration, 3. extraction kinetics in percolation equipment as well as 4. necessarily analytics. With these robust means, the solid–liquid extraction process step can be investigated.
The used raw material, Vanilla planifolia, as well as the equipment and the accompanying analytics are described in earlier publications [6]. To close the mass balances, the compositions of the two phases, the solid- and liquid phase, have to be determined. The target and side components are determined through HPLC. To close the mass balance for water and the solvent, the water content is determined through Karl–Fischer titration in the extract phase and through toluene distillation and moisture analyzer in the solid phase. [6].
3 Botanic basics and modelling approaches
The optimized design of the extraction as well as the influence of the remaining water in the raw material are discussed using the example of vanillin from V. planifolia. Fig. 1 illustrates the botanical influencing variables extended by the target function, the equipment. The most common instruments for solid–liquid extraction and the raw materials processed therein are tabulated in [3]. According to today's state of knowledge, an optimal process design is possible in a model-based way or with extremely high experimental effort. Hence this is a time and money-consuming process.
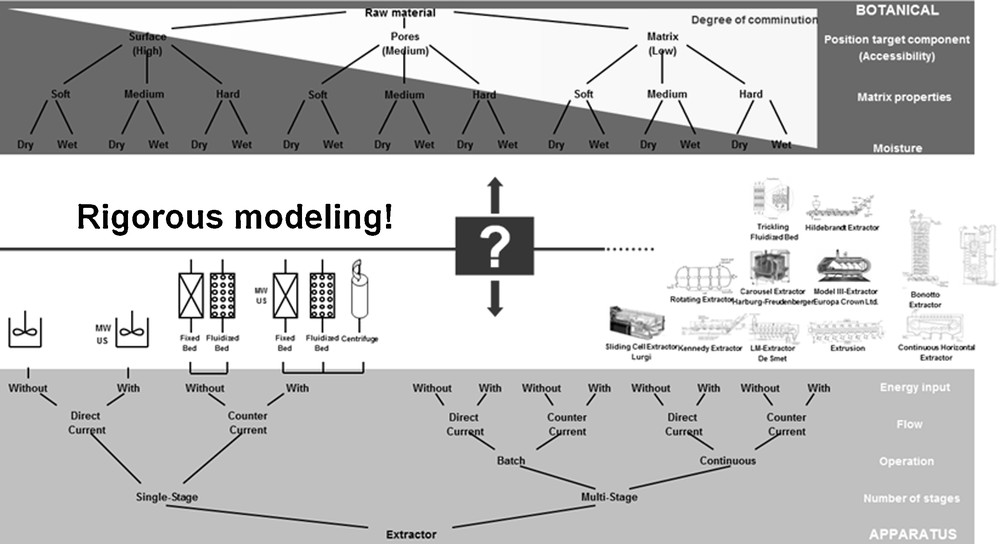
Classification of botanical systems [16].
For the process design, botanical as well as economic factors have to be considered. Therefore, these factors are briefly illustrated in the following. For the selection of the extraction equipment, the raw material and its characteristics are crucial. Primarily, the botanical values 1. accessibility of the ingredients for the solvent, 2. structure of the matrix as well as 3. moisture content and swelling behaviour of the raw material can be named here. [16] In addition to the botanical characteristics mentioned, the characteristics of the target and side components are decisive as well. Essential oils, for example, are most often extracted via water steam distillation [19], whereas vanillin is won by solvent extraction [6].
The parameters to be determined for the process design are primarily the equilibrium, the mass transport kinetics and the fluid dynamic. Hereby, the former (equilibrium and mass transport kinetic) depend on the regarded substance system. The fluid dynamics is depending on the equipment. Hence, for optimizations of existing apparatuses as well as the design of apparatus on industrial scale, the fluid dynamic of the respective apparatus has to be measured. Substance specific parameters can be determined in laboratory experiments [7].
The accessibility of the ingredients for the extracting solvent is depending on the location and hence, the distribution of the compounds in the plant part as well as the diffusion of the solvent in the raw material. The distribution of vanillin from vanilla beans under engineering aspects is examined and discussed in the literature [6,16]. Here, the diffusion of the solvent and the water bound to and in the raw material matrix is not regarded.
Fig. 2 depicts the parameters to be examined and their interdependency. As botanic parameters the contained target and side components, their accessibility as well as the raw material matrix and the moisture content of the raw material are mentioned here. These have influence on the model parameters and hence, on the technological realization in an equipment or process.
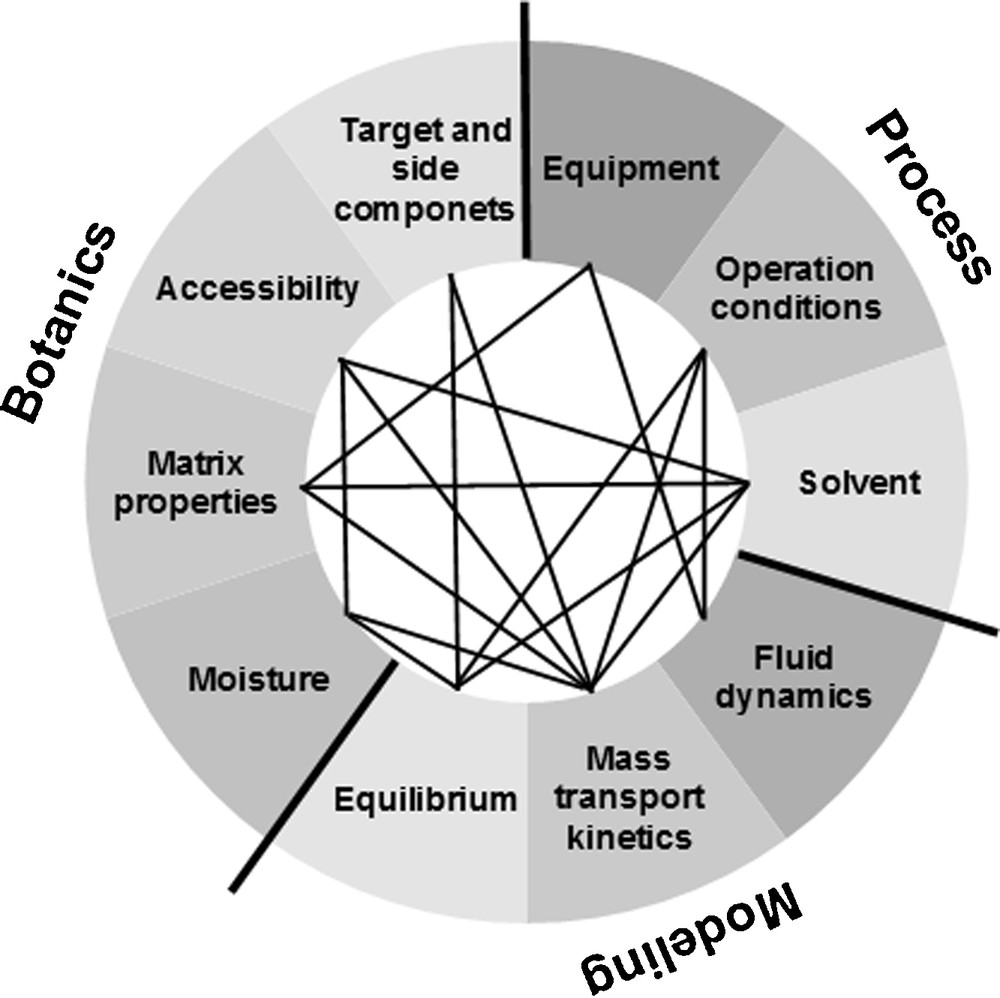
Parameters: botanical, model, process.
The question of the solvent to employ depends on the equilibrium for the target and side components as well as on the mass transport kinetics. A solvent has to be chosen that shows a high capacity and selectivity as well as appropriate extraction kinetics for the target components. Here, equilibrium and mass transport kinetics are again depending on various botanical parameters. The equilibrium, for example, is depending on the remaining moisture and the side components in the raw material. These can shift the equilibrium line towards solid or liquid phase. The mass transport kinetics not only depends on the remaining moisture of the raw material but also on the matrix and the accessibility of the compounds. Here, the botanical parameters are linked. Via a purposeful increase of the moisture content, the raw material can swell and the accessibility of the ingredients for the solvent increases.
Along with the solvent selection, the process development consists of the choice of appropriate equipment and operating conditions. The operating conditions, like pressure and temperature, as well as the predefined mass flow have an effect on the different parameters. Not only the equilibrium but also the mass transport kinetics can depend on e.g. temperature. The mass flow to be processed primarily affects the fluid dynamics and the equipment. The equipment has to technically implement all the parameters mentioned above.
To include, the complex interactions between the parameters in the process design and hence develop an optimal process, these have to be depicted in a model-based way. Thereby, the global optimization of all parameters becomes possible.
Thus, the aim is a model-based design of the extraction processes, including botanical parameters. As shown in earlier publications, a design and optimization of solid–liquid extraction processes is possible in a model-based way. The physicochemical models employed consider the named botanical parameters. However, further research is constantly needed for the experimental measuring as well as the model-based depiction of different raw material characteristics [6,7].
4 Vanillin extraction – modelling and model validation
The model used for the simulation and the process design of the exemplary system “vanillin from V. planifolia” is described in earlier publications [6,16]. The underlying equations and assumptions as well as the validity of the model are briefly outlined in the following.
The basis is constituted by the distributed plug flow (DPF) approach. Here, for the description of the extraction process, the equilibrium for the regarded components between raw material matrix and liquid phase, the extraction kinetics and the fluid dynamics are concerned. Eq. (1) displays the mass balance of the liquid phase, where the mass transport kinetics are included through the mass transport coefficient, kf. The fluid dynamics are quantified through convection, defined through the internal velocity uz and the dispersion, described through the axial dispersion coefficient Dax.
The mass balance of the raw material phase is given by eq. (2), whereas here a perfused packed fixed bed is assumed. For a counter current process, in addition to the mass transport kinetics, analogous to the liquid phase balance, the terms for convection and dispersion have to be included [7]. The pore diffusion is defined through the effective diffusion coefficient De:
| (1) |
| (2) |
The total loading of the particle q is composed of the solid phase concentration cS bound on the matrix and the liquid phase concentration cP existing in the porous matrix [eq. (3)], ɛP being the internal or particle porosity:
| (3) |
In the literature, model parameters used for 1. equilibrium, 2. mass transport kinetics and 3. fluid dynamics are determined accordingly in multi-stage maceration and percolation experiments [6,7]. Fig. 3 schematically shows the in multi-stage maceration experiments for the target and side components generally determinable equilibrium lines. These can feature a linear curve, a Langmuir curve or an anti-Langmuir curve with different slopes. In addition, it can be pointed out that with increasing slope of the equilibrium line where the equilibrium is shifted in the direction of the solid phase.
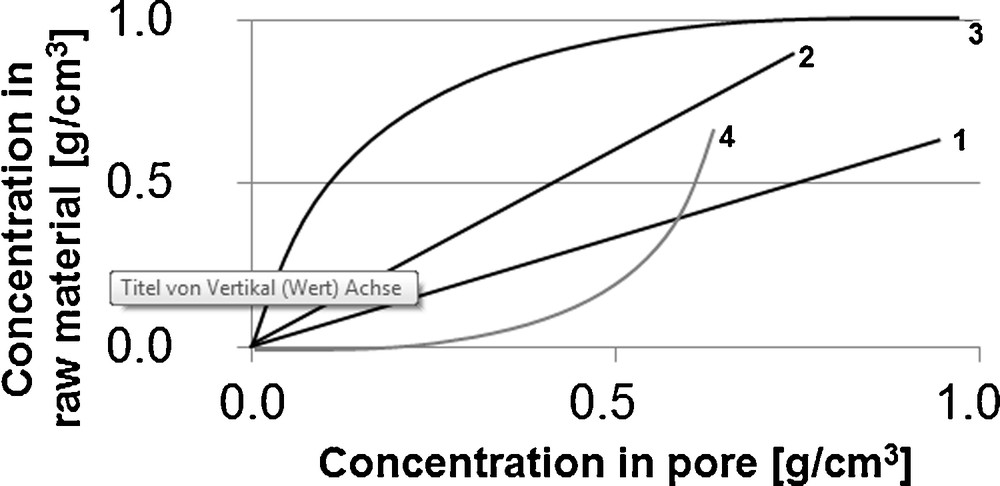
Schematic form of possible equilibrium lines, 1. linear, 2. linear, 3. Langmuir, 4. anti-Langmuir.
Here, for constant initial raw material loading, a higher extract phase concentration and a lower solid phase concentration can be examined in equilibrium state for curve 1 than for curve 2. Examples for the linear form of the equilibrium line are vanillin from vanilla beans (Fig. 4) [6] and sucrose from sugar beets [7].
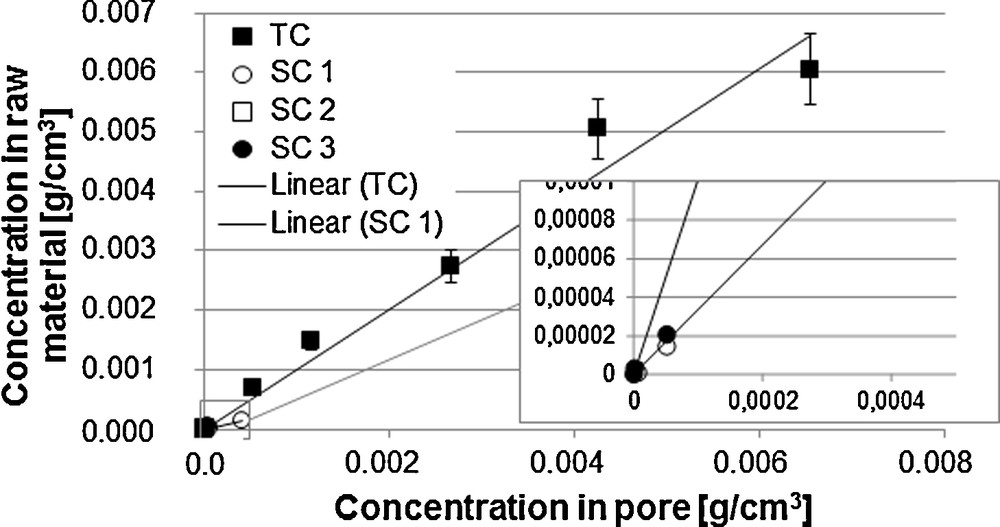
Equilibrium line vanillin and side components [6].
The Langmuir curve (curve 3) indicates surfacial adhesive compounds, which are easily washed off. High liquid phase concentrations are resulting. In the lower part of the curve, the components bound deep in the matrix are finally extracted, using a significantly higher amount of solvent. Amongst others, the Langmuir curve is present for the extraction of pepper [6].
The anti-Langmuir curve (curve 4) appears when the solvent capacity is reached. High concentrations of target and side components in the raw material phase with low liquid phase concentrations are the result. Thus, such a curve is not to be aimed for.
The equilibrium line of vanillin can be described by eq. (4) with the equilibrium constant kH = 0.95. Analogous to this, the equilibrium lines of the side components are included in the model. Here, the initial loading of the side components in the raw material is lower by the factor 10 to 100 than the loading of vanillin. Depending on the regarded side component, the separation factors lie between 0.3 (side component 3) and 0.9 (side component 1) [6]. The equilibrium of the side components is thus stronger on the extract side than for vanillin:
| (4) |
For the optimization of existing processes, the validity of the model is to be checked with a reference process [7]. If there is no reference process, experimental data with variations of the operating conditions, like flow rate or particle size as well as concerning the geometry of the equipment can be used for the validation of the models. Fig. 5 shows the prediction of the extraction with a low flow rate (0.1 bed volume/h instead of 6.0 bed volume/h) as well as with a smaller mean particle diameter (300 μm instead of 1000 μm).
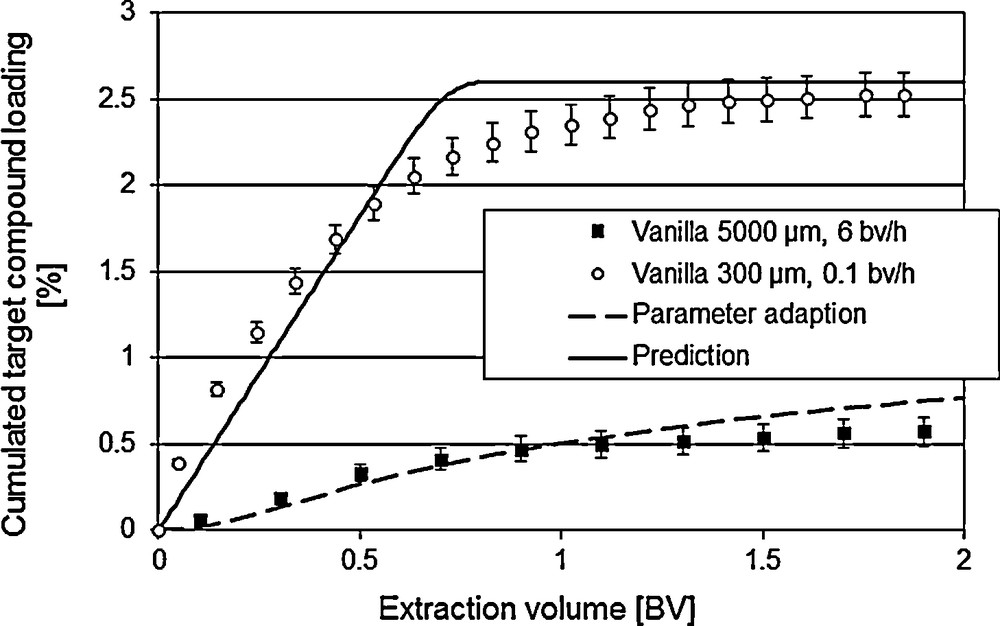
Model validation via variation of the operating conditions.
Hence, the model qualifies as valid. More precise data can be worked out though the inclusion of further botanic parameters, such as variable accessibility of the ingredients.
Via discretization, the concentration profiles over the particle radius can be traced during the extraction process (Fig. 6). Initially, the extraction takes place from the surface. The diffusion out of the porous solid matrix is the limiting factor, depending on the pore size and porosity distribution. Higher extraction kinetics can, for instance, be generated via a higher specific surface, i.e. a higher degree of grinding. Concerning the process techniques, limits are set by the pressure drop. For this, the pressure drop can be calculated according to Darcy. Here, u is the velocity, η is the dynamic viscosity, L is the length of the fixed bed, k0 is the specific column permeability and dP is the particle diameter [eq. (5)]. According to Darcy's law, the particle diameter influences the pressure drop to the power of two:
| (5) |
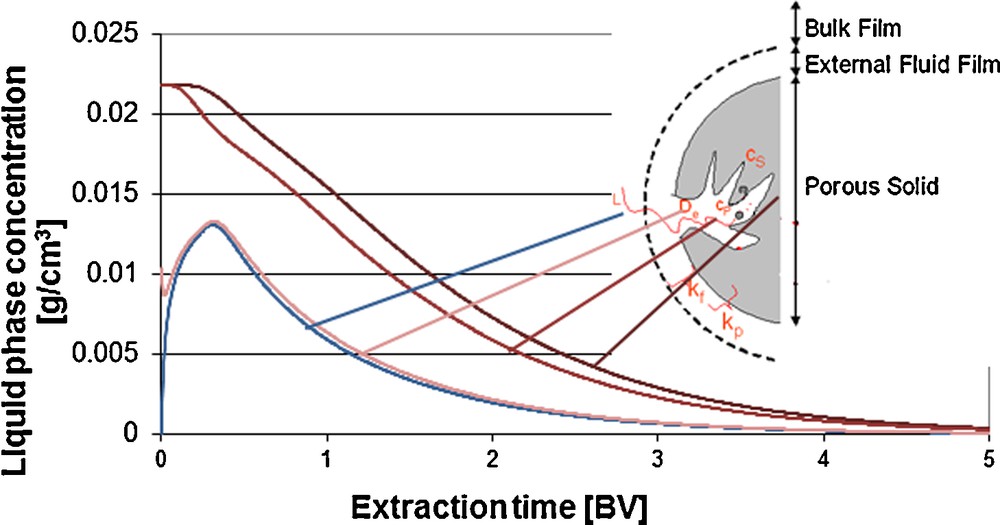
Concentration profiles in bulk phase, particle core, – midi and – surface, percolation column.
Besides the particle diameter, the influence of the constant equilibrium line is to be quantified over the process. As in the solid raw material, depending on its polarity, there is a solvent ratio that can differ from the applied 50/50 (m/m) ethanol/water. Only via the integration of diffusion and extraction of water into and out of the solid matrix, a higher model accuracy can be reached.
To increase the accuracy, the effects of the particle size distribution and the equilibrium line – depending on the solvent (ratio) – are to be included. For this, in the following, the influence of the water content on the equilibrium line will be quantified and the extraction of water from the solid substance matrix will be illustrated in a model-based way.
5 Water extraction
Parallel to the extraction of target and side components from the matrix, an extraction of water proceeds. An exchange of water through the extracting agent is assumed. Thus, the equilibrium lines of the target and side components between matrix and solvent change from water to the respective extracting agent. In the following sections, the change of the equilibrium line is illustrated. Furthermore, the extraction of water is illustrated and discussed in a model-based way.
5.1 Influence of the water on equilibrium and mass transport kinetics
Fig. 7 shows the equilibrium line of vanillin at the two solvent ratios: ethanol/water 50/50 (m/m) and 100 % ethanol. The higher the slope the more the equilibrium is on the side of the solid phase. Thus, the optimal equilibrium line runs flat, whereby high concentrations in the liquid phase result with low solid phase concentrations in the equilibrium. Hence, pure ethanol shows the best conditions for ethanol extraction.
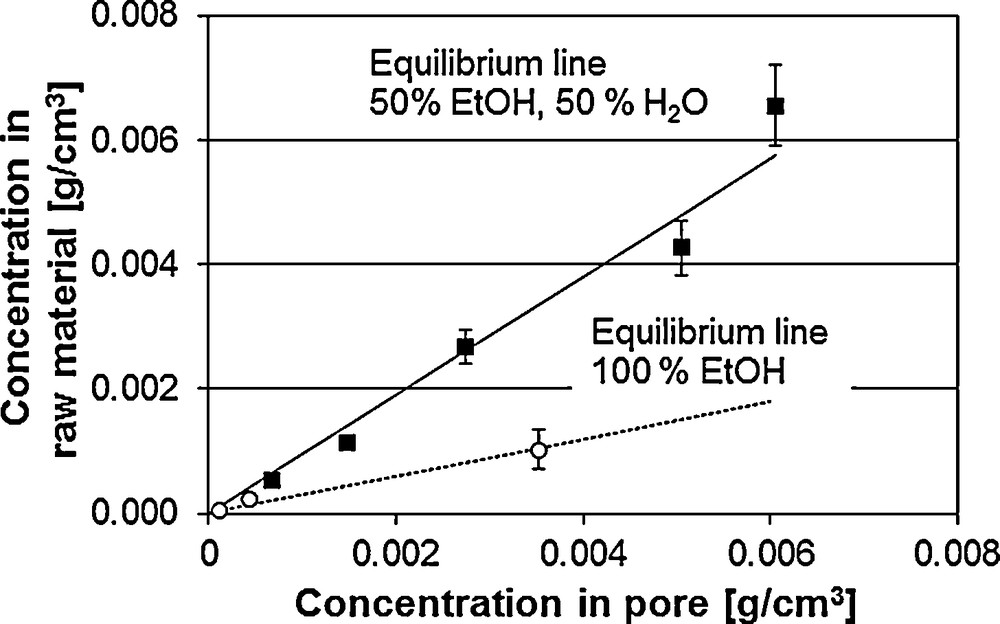
Equilibrium line of vanillin from V. planifolia.
For the extraction process, not only the equilibrium concentration but also the mass transport kinetics are crucial. Here, pure ethanol shows significantly worse extraction behaviour than the mixture of water and ethanol. The water content in the extracting agent leads to a swelling of the raw material. The accessibility of the ingredients increases. The extraction runs faster. Along with the swelling, the solvent-dependent and thus changed diffusion coefficients have an influence on the extraction kinetics. The extraction at the different solvent ratios is described and discussed in earlier publications [6]. Accordingly, the description of the diffusion is to be included in the modelling.
5.2 Modelling water extraction via Fick and Maxwell–Stefan diffusion
The diffusion describes the chaotic and random Brownian molecular moving that is generated by the thermal motion of the molecules. If a system is in equilibrium, the components in the system are distributed homogeneously.
If the compounds are not distributed evenly over the control volume of the system, there is no equilibrium. Hence, the presence of a concentration gradient forces the molecules to move from the field of higher concentration to the field of lower concentration, in the direction of the equilibrium. In literature, generally two approaches for the mathematical description of the diffusion can be found: the approaches of Fick and Maxwell–Stefan [20].
5.2.1 Fick diffusion
According to Fick's first law, the molar flux density J is proportional to the concentration gradient [eq. (6)]:
| (6) |
Here, the proportionality factor is the Fick diffusion coefficient D. The molar flux density gives a statement about the amount of diffusing molecules per time through a surface vertical to the direction of movement of the molecules. Fick's second law is defined as given in eq. (7), which can illustrate local as well as temporal changes in concentration. In contrast to Fick's first law, that only regards temporal constant molar flux density, Fick's second law is applicable for the description of unsteady diffusion processes:
| (7) |
For porous systems, an extended form of Fick's second law, as given in eq. (8), can be applied:
| (8) |
5.2.2 Maxwell–Stefan diffusion
Generally, the Maxwell–Stefan diffusion considers the equilibrium between “driving forces” and friction forces in a system. Friction forces occur between the components of a system. Driving forces are such forces as gradients of potential, pressure or concentration. Here, the model is based on the conservation of energy of collisions between the molecules in the regarded volume element. The higher the number of molecules, the higher is the number of collisions. The general Maxwell–Stefan equation for the calculation of the driving force mass diffusion affecting the molecules, marked as 1, in a direction d1 for binary systems is as follows [eq. (9)]. It qualifies analogously for the molecules marked as 2 [20,21]:
| (9) |
Here D12 is defined as the quotient of pressure p and friction-or resistance coefficient F12. The mole fractions are given as xi, the velocities of the molecules as ui. For the isotherm and isobar case, eq. (9) can be transformed to a simplified form [eq. (10)]:
| (10) |
For multi-component systems, the model can be extended accordingly, so that eq. (11) illustrates the general coherence, the final form of the Maxwell–Stefan equation. Additionally, in eq. (11), the dependence of the effective force on velocity and concentration of the respective molecules is replaced by the dependence on molar flux N:
| (11) |
A transformation of the Maxwell–Stefan equation from gases to the liquid systems is possible, because the state of matter is included in the calculation of the Maxwell–Stefan diffusion coefficient and the driving force d1 [according to eq. (12)] [21]:
| (12) |
During the diffusion of components in porous systems, the effects of interaction occur both between the molecules and the diffusing molecules and the porous matrix that hinder the mass transport considerably. Using the example of diffusion in catalyst pellets, Krishna and Wesselingh have shown that Fick's law cannot describe these interactions and often leads to incorrect results [21].
Currently, the so-called “Dusty Gas Model” is the model used most often to describe diffusion processes in porous materials. [22,23] For the mass transport in porous mediums, the following mechanisms are possible depending on the ratio of mean free path to pore diameter:
- • Knudsen diffusion JiK;
- • molecular diffusion JiM;
- • convective flux JiV;
- • surface diffusion JiS.
The Knudsen diffusion occurs when the mean free path is bigger than the pore diameter. Hence, collisions between molecule and surface happen more often than molecule–molecule collisions. In the convective flux, the mixture of the substances is seen as a continuum that is moved by pressure gradients. Here, the molecule–molecule collisions outweigh the molecule–wall collisions. To check which diffusion mechanisms occur in literature, the pores are divided into micro-, meso-, and macropore (Table 1) [24].
Labelling of porous bodies according to [24].
| Pore size | Label | Mass transport |
| < 2 nm | Micropore | Active transport |
| 2–50 nm | Mesopore | Knudsen diffusion, capillary transport |
| 50 nm | Macropore | Molecular diffusion |
Hence, for pores with a diameter of more than 50 nm, the Knudsen diffusion can be neglected. Along with the above-mentioned classification, the influence of the Knudsen diffusion can be rated with the help of the dimensionless Knudsen number [eq. (13)]. Here, λ is the mean free path of the respective molecule and dPore is the pore diameter. If Kn is considerably larger than 1 and thus, the mean free path is bigger than the pore diameter, Knudsen diffusion occurs and it has to be taken into account when describing the diffusion.
| (13) |
The molecular diffusion proceeds when molecules move due to concentration gradients or other external forces. In this case, the molecule–molecule collisions overweigh the molecule–wall collisions as well. The surface diffusion is fundamentally different from the other three mechanisms. Here, the molecules diffused on the surface and the adsorbed molecules move laterally on it. The Maxwell–Stefan equation for molecular diffusion is extended by the Knudsen diffusion to eq. (14).
| (14) |
Here, Deffij is the effective Maxwell–Stefan diffusion coefficient that considers porosity and tortuosity of the porous system and DeffiK is the effective Knudsen diffusion coefficient. This considers the above-mentioned characteristics of the system. Γ is the thermodynamic factor that describes the non-idealities of the system.
5.2.3 Calculation of diffusion coefficients
A method for the calculation of Maxwell–Stefan diffusion coefficients for binary mixtures is the so-called Vignes method [25–27]. Eq. (15) makes up the basis for binary systems; eq. (16) forms the basis for multi-component systems. The Knudsen diffusion coefficient can be calculated according to eq. (17) [20]:
| (15) |
| (16) |
| (17) |
The effective diffusion coefficient considers the porosity and tortuosity of the porous solid substance [eq. (18)], with ɛ as porosity and τ as tortuosity [28,29]:
| (18) |
5.2.4 Thermodynamic factor
The thermodynamic factor describes the non-idealities of the system. It is, as described in eq. (19), defined by the “Kronecker factor” δij as well as the mole fraction and the activity coefficients [20]:
| (19) |
5.2.5 Determination of the activity coefficient
The activity coefficients in non-ideal multi-component systems can be calculated using UNIFAC, NRTL or UNIQUAC, for example. The determination of activity coefficients with UNIQUAC and NRTL is only possible via the adaptation of experimental data. The UNIFAC model is based on the group contribution method. The activity coefficient is hereby consisting of the combinatorial part γiC and the residual part γiR. With the combinatorial part, the geometrical size of the molecule groups is considered, with the residual part, the energetic interactions are taken into account. For simpler systems as water/ethanol, for example, the simplified calculation through Taylor and Krishna approach can be chosen [20].
Fig. 8 illustrates the above-mentioned parameters for the mixture water/ethanol over its composition. Here, Fig. 8.1 gives the three approaches according to Van Laar, Margules and NRTL compared to experimental data according to Tyn and Calus [30]. The models NRTL and Van Laar display the actual curve of the Fick diffusion coefficient with minimal deviations. According to the definition of the thermodynamic factor that contains the deduction of the activity coefficient according to the mole fraction, as a result, it is depending on the model. Fig. 8.2 shows the thermodynamic factors through the three models mentioned. A comparison with experimental data is not possible. No course of the thermodynamic factor could be measured so far.
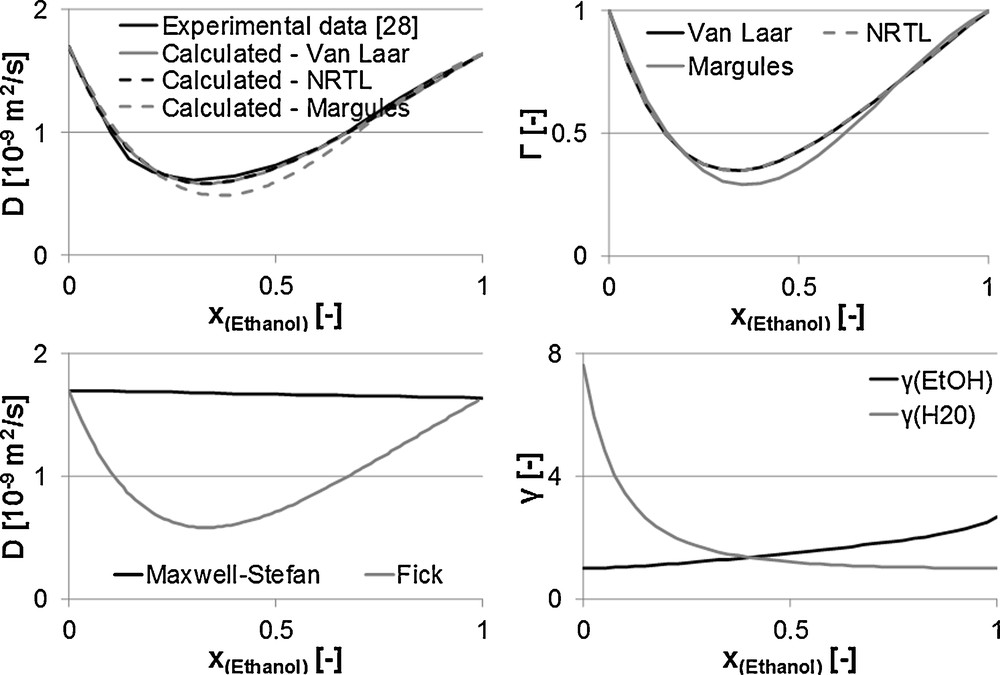
1. Diffusion coefficient. 2. Thermodynamic factor. 3. Maxwell–Stefan and Fick diffusion coefficients. 4. Activity coefficient.
Fig. 8 3 shows the curve of the Fick diffusion coefficient, calculated through the NRTL model, in comparison to the Maxwell–Stefan diffusion coefficient. Hence, the Maxwell–Stefan diffusion coefficient only slightly changes over the composition in the relation to the Fick diffusion coefficient. The activity coefficients are determined with the UNIFAC model. Fig. 8.4 displays both curves.
Hence, models according to Fick and Maxwell–Stefan can be employed for the description of the extraction of water from the porous solid matrix. In counter current to the extraction of the water, the solvent, in this case ethanol, diffuses into the matrix. Fig. 9 shows the comparison of both approaches with experimental data. Here, it becomes apparent that the Maxwell–Stefan model describes the actual case more accurate. Deviations of both model approaches from the experimental data are most notably recognized in area II. Here, deviations can primarily be explained through the above-mentioned error sources by calculation and experimental model parameter determination. In area III, there are measuring inaccuracies concerning closing the mass balance. An error in the mass balance of water of up to 4 % occurs. Through a sensitivity analysis, this error is quantified as tolerable [6].

Comparison of the approaches according to Maxwell–Stefan and Fick with experimental data.
For the diffusion in other porous media, like for example, catalysts and zeolites the better description through Maxwell–Stefan approach is already thermalised [30]. Hence, the extraction can be described through this and serves the determination of a defined composition of the solvent in the solid raw material phase. Through this, the actual solvent ration can be illustrated in the model with. The equilibrium line, swelling behaviour or mass transport kinetics can be depicted in dependence to this solvent mixture.
6 Equipment evaluation
With validated models for the description of the extraction of components from the botanical raw material matrix, several extraction scenarios can be compared concerning equipment and operating conditions:
- • percolation with different flow rates;
- • (multi-stage) maceration;
- • recycling loop;
- • counter-current percolation.
The different scenarios can be compared with regard to the following targets:
- • yield;
- • purity;
- • space-time-yield;
- • equipment/apparatus efforts;
- • solvent consumption;
- • extraction time;
- • dilution.
The yield of 100 % for the respective target and side components is thereby determined by five-stage maceration and subsequent control percolation as described in literature [6]. The purity of the vanillin extract is defined as the ratio of vanillin to the sum of considered components, vanillin and the main side components [eq. (20)]. The space-time-yield (STY) is defined according to eq. (21), whereby V is the equipment volume, t is the extraction time and m is the cumulated extracted mass:
| (20) |
| (21) |
Fig. 10 illustrates the comparison between percolations with different flow rates. It can be identified here that higher flow rates lead to faster yields. With constant yield, higher amounts of solvent are necessary because the equilibrium between solid and liquid phase cannot be reached any more. The diffusion kinetics of target and side components is the limiting step. A nearly constant purity over the extraction time can be explained through the total amount of side components and their diffusivity in the solvent. The extraction of vanillin is not faster than the extraction of the side components.
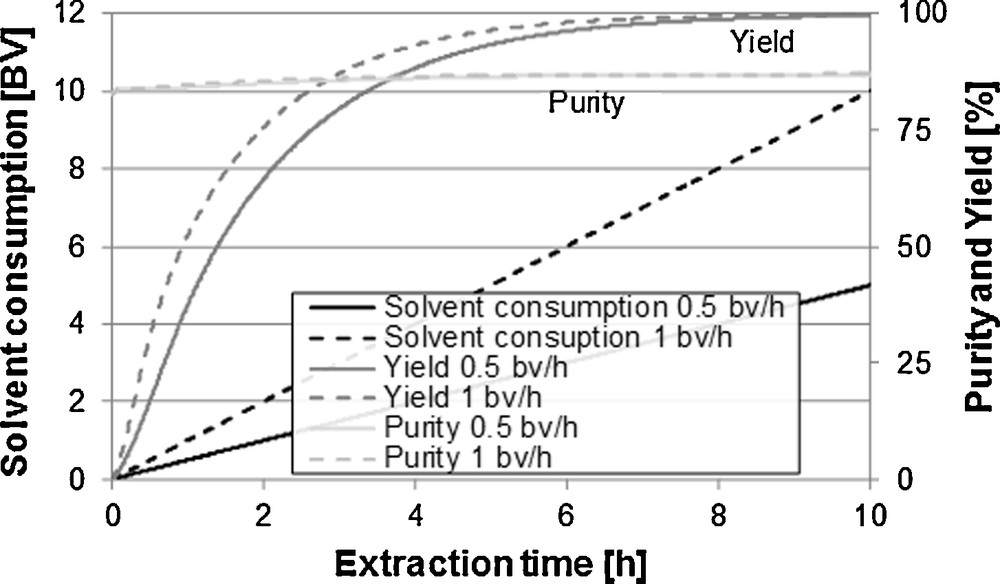
Influence of the rate of flow on purity, yield and extracting agent consumption.
For processes in which the diffusion coefficients can be clearly distinguished from target and side components, as well as for processes in which the distribution of the components in the particle is not homogenous, the purity can vary considerably over the extraction. Surfacial bound components as well as components with a high diffusion kinetic are extracted faster than components that are located deeply in the matrix.
Fig. 11 shows the influence of the recycling loop. Extract can be completely or partly added to the unloaded extraction agent. Through this, with not fully exhausted capacity of the solvent, higher concentrations in the extract can be achieved. The solvent consumption can be reduced. Hence, the space-time-yield decreases through the recycle of extract and the correspondingly decreasing amount of extract per time unit.
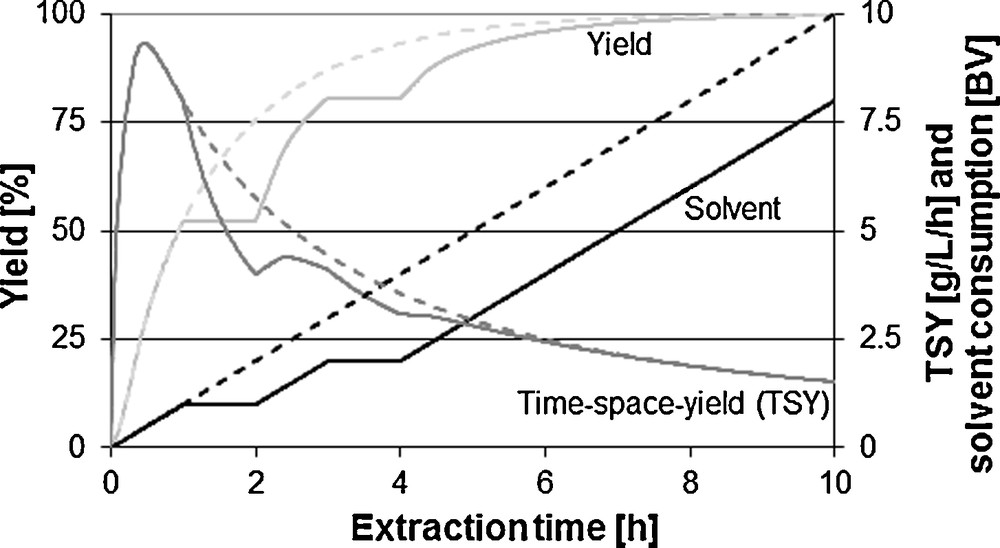
Comparison with and without recycling loop on solvent consumption, yield and space-time-yield (STY).
To be able to compare different processes, the mentioned target values are defined (Fig. 12). The total extraction through five-stage maceration and subsequent percolation serves as reference here, whereas the purpose of this only is the quantification, and not an actual process suggestion. The space-time-yield, extraction time and solvent as well as the apparatus effort are scaled here. For the yield of 100 %, the maximum load contained in the raw material is stated. As side components, these compounds are chosen, which are contained in a significant amount in the raw material. Hence, these components are most sensitive on the target purity. However, they exist in considerably lower concentrations than the vanillin.
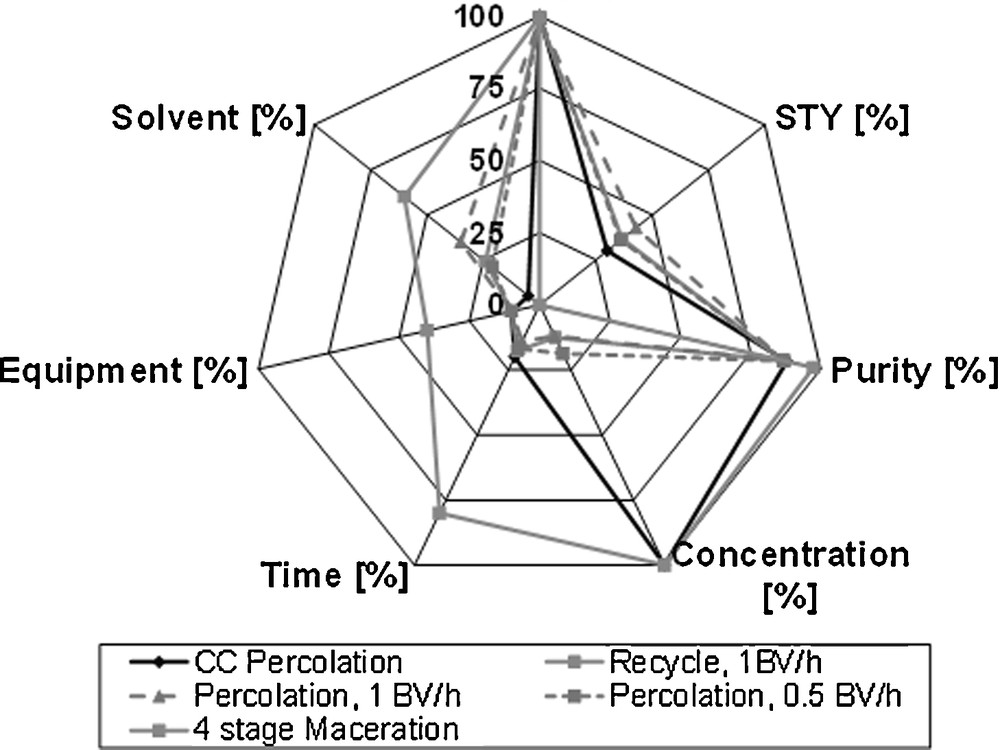
Equipment evaluation via spider diagram.
For the design of an economically optimal process, different targets depending on the raw material are crucial. For high value products, a yield of up to 100 % is required. The increased solvent consumption is borne by the availability of the product. For low value products, the solvent consumption has to be kept low. Here, losses in yield can lead to an economically optimal process.
If not the extract is the product but possibly contained ingredients are to be further purified, then, the purity over the extraction time has to be considered as well. Fig. 13 shows the curve of the purity for the exemplary system vanillin. The diffusion kinetics of target and side components are hereby comparable. The equilibrium located farther on the extraction side for the side components as it is for the target component. An increasing purity with increasing extraction time is the result.
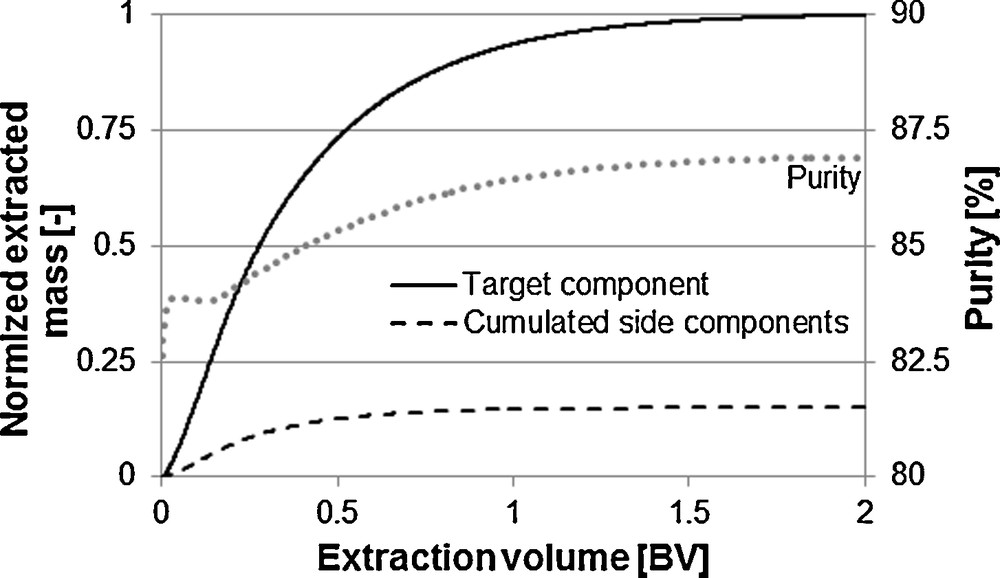
Purity changes over the extraction time.
If equilibrium and mass transport kinetics facilitate the extraction of the target component, a decreasing purity with increasing extraction time is the result. An optimum between purity and yield can be found here. A unit operation specific purity in combination with the total process consideration admits an economically optimal process design [31,32].
7 Conclusion
The model-based process design for plant-based products is possible according to today's state of knowledge. Here, primarily the two design methods of the statistical experiment design and physicochemical modelling can be named. In the present paper, the selection of the extraction apparatus on basis of physicochemical models is illustrated. Thereby, both the determination of the model parameters and the influence of the water are experimentally determined, discussed and finally depicted in a model-based way. The respective sizes are included in the design of the equipment. The extraction of the target and side components from V. planifolia served as an exemplary system for this.
Using standardized equipment for the measurement of the model parameters the equilibrium, the mass transport kinetics and the fluid dynamics are determined. The influence and the extraction of water are taken into consideration here. Water can be named as influencing variable on the accessibility as well as the equilibrium and mass transport kinetics. Through Fick and Maxwell–Stefan approach, the extraction of water is depicted in a model-based way and discussed, whereas the approach according to Maxwell–Stefan displays the experimental data with higher accuracy.
The rating of the extraction equipment is finally illustrated and discussed by spider diagrams. Additionally, the curve of the purity over the extraction time can be named as target especially for total process design including further purification steps. The exemplary sizes purity and yield as well as dilution of the extract, extraction time, apparatus effort end solvent consumption are defined as decision sizes. The link to the botanical and economical characteristics of the raw material has been taken into account here.
Hence, according to today's state of knowledge, a model-based process design and optimization is possible. To further increase the predictive accuracy of the models, additional botanical parameters have to be included in the process design. For example, the loading distribution and the structure of the raw material matrix can closer quantify the botanical raw material. Hence, on the way from the botany via the models to the equipment or the process, the step from model to equipment is currently feasible. The step of the inclusion of botany is a focus of research at present.