

1 Introduction
Two main types of roses are distinguished in rose classification: botanical species which originally grew naturally in the wild, and hybrid varieties obtained from crosslinks. Rose gardening started in Antiquity, with the introduction of a few of the most attractive natural species in gardens. Thus, crosslinks started from only a few wild rose species, by spontaneous cross-pollination. Since the Middle Ages, roses have been cultivated for their beauty, perfume, or for certain medicinal or culinary usages. Roses are also well known for their astringent and anti-ageing properties and their ability to promote skin tonicity. Over time, the diversity of rose forms, colors, odors, and agronomic properties increased immensely thanks to improvements in breeding methods [1]. Today, over 24,000 rose varieties are referenced and most of them are hybrids [2]. The main industrial application of roses is in the perfume industry, which requires the production of essential oil, rose water, both concrete and absolute, obtained from scented rose varieties such as Rosa damascena or Rosa centifolia [3].
Among these numerous varieties, ‘Jardin de Grandville’ is a modern hybrid variety obtained by a crosslink between ‘Annapurna’, a white perfumed flower, and ‘John Clare’, a pink flower variety that is highly resistant to diseases. This new hybrid was created by the company “André Eve roses anciennes et nouvelles” at the request of the cosmetics group Parfums Christian Dior. To create this new cultivar, 10 years of stringent selection applied by the rose-breeders was necessary. The plant possesses interesting agronomic properties such as strong resistance to common rose diseases, abundant blooms, and vigorous growth. This variety is now used by Parfums Christian Dior for cosmetic applications, in anti-ageing skin creams.
In order to gain greater insight into the molecular composition and the compounds present in ‘Jardin de Granville’, a detailed study of the available information concerning rose phytochemistry was carried out. Among publications dealing with rose phytochemistry, the great majority concern botanical species and in very rare cases, hybrid varieties are investigated. Generally, only one specific plant part is studied at a time, with flowers and fruits being particularly targeted. And only in few cases there is a presentation of the overall phytochemical composition given [4]. Concerning molecular composition, a large number of publications focus particularly on volatile compound analysis and more specifically on R. damascena essential oil analysis [3]. The main constituents identified in rose essential oil are monoterpene alcohols such as citronellol, geraniol, nerol, linalool and phenylethyl alcohol.
Many studies have also investigated polyphenols, as shown in Table 1. These compounds are known to participate in plant defense mechanisms, pollinator attraction and flower color. Among this family, many tannic structures have been described. Most of them correspond to hydrolysable tannins, derived from gallic acid or ellagic acid. Several studies also reported the presence of condensed tannins (proanthocyanidins). Some flavonoid compounds are also described. They correspond to flavonols and principally to quercetin and kaempferol derivatives. Lastly, anthocyanins are well documented in red or pink rose species. Some cyanidin, pelargonidin and peonidin aglycones and glycosides have been identified. Despite the large number of publications related to polyphenol characterization in roses, very few of them discuss modern hybrid varieties. Moreover, they focus mainly on flower or fruit analysis and generally present the identification of only a few targeted compounds (Table 1).
Polyphenol identification in roses.
| Studied species | Principal detected molecules | References |
| Rosa laevigata (fruits) | Ellagitannins | [5] |
| Rosa dauvica (roots) | Hydrolysable tannins | [6] |
| Rosa gallica (petals) | Hydrolysable tannins | [7] |
| Rosa rugosa (petals) | Hydrolysable tannins | [8] |
| R. dumalis, R. mollis, R. sherardii (fruits) | Condensed tannins, hydrolysable tannins, flavonols (quercetin derivatives) | [9] |
| R. × damascena, R. bourboniana, R. brunonii (flowers) | Gallic acid, flavonols (kaempferol, myricetin, quercetin derivatives) | [10] |
| R. × damascena, R. bourboniana, R. brunonii (flowers) | Hydrolysable tannins, flavonols (myricetin, kaempferol derivatives, quercetin derivatives) | [11] |
| Rosa micrantha (flowers) | Condensed tannins, hydrolysable tannins, flavonols (catechin, kaempferol derivatives, quercetin derivatives, isorhamnetin) | [12] |
| Rosa dauvica (leaves) | Hydrolysable tannins, flavonols (quercetin glycosides) | [13] |
| Rosa chinensis (flowers) | Anthocyanins (cyanidin and pelargonidin glycosides), hydrolysable tannins, flavonols (kaempferol and quercetin derivatives) | [14] |
| Rosa × damascena (flowers and leaves) | Hydroxycinnamic acids, gallic acid, flavonols (catechins, quercetin) | [15] |
| Rosa soulieana (fruits) | flavonols glycosides, lignins, phenolic acids | [16] |
| Rosa laevigata (fruits) | Various phenolic compounds | [17] |
| Numerous botanical species (petals) | Flavonols (kaempferol and quercetin derivatives) | [18] |
| Rosa agrestis (leaves) | Flavonols (kaempferol and quercetin derivatives) | [19] |
| Rosa spinosissima (leaves) | Flavonols (kaempferol and quercetin derivatives) | [20] |
| Rosa × damascena (petals) | Flavonols (kaempferol and quercetin derivatives) | [21] |
| Rosa chinensis (flowers) | Flavonols (kaempferol and quercetin derivatives) | [22] |
| Rosa multiflora (fruits) | Flavonols (kaempferol and quercetin derivatives) | [23] |
| Numerous botanical species (flowers) | Anthocyanins (cyanidin and peonidin glycosides), flavonols (kaempferol and quercetin derivatives) | [24] |
| 100 Rosa × hybrida varieties (petals) | Anthocyanins (cyanidin, pelargonidin and peonidin glycosides), flavonols (kaempferol and quercetin derivatives) | [25] |
| Rosa × hybrida (petals) | Anthocyanins (cyanidin and pelargonidin glycosides), flavonols (quercetin and kaempferol) | [26] |
| Rosa chinensis (‘An ning’) (flowers) | Anthocyanins (cyanidin glycoside) | [27] |
| Rosa hybrida 'Noblered' (petals) | Anthocyanins (cyanidin and pelargonidin glycosides) | [28] |
| Numerous botanical species and hybrid varieties (flowers) | Anthocyanins (cyanidin, pelargonidin and peonidin glycosides) | [29] |
| Numerous botanical species and hybrid varieties (flowers) | Anthocyanins (cyanidin, pelargonidin and peonidin glycosides) | [30] |
Concerning the other molecular families, some triterpenoids are also described (Table 2). The most frequently found structures are ursolic acid, oleanolic acid, betulinic acid, tormentic acid and euscaphic acid. They were mainly identified in the leaves, roots and fruits of botanical species. Some sesquiterpenes were also identified. A few other publications reported the identification of less polar compounds such as sterols, fatty acids and carotenoids, mainly found in the flowers and fruits of botanical species.
Low polarity compound identification in roses.
| Studied species | Principal detected molecules | References |
| Hybrid tea roses (petals) | Ursolic acid, oleanolic acid, betulinic acid Linoleic acid, sitosterol | [31] |
| Rosa canina (leaves) | Lupeol, α-amyrin, β-amyrin, oleanolic acid, ursolic acid, hederagenin, and various derivatives | [32] |
| Rosa canina (fruits) | Ursolic acid, oleanolic acid, betulinic acid | [33] |
| Rosa laevigata (aerial parts) | Ursolic acid, oleanolic acid, hederagenin, and glycosylated derivatives of sterols (sitosterol and stigmasterol derivatives) | [34] |
| Rosa laevigata (leaves) | Laevigines A, B, C and D, lupenol, ursolic acid, asiatic acid, euscaphic acid, myrianthic acid | [35] |
| Rosa laevigata (fruits) | Ursolic acid, pomolic acid, euscaphic acid, myrianthic acid, tormentic acid, oleanolic acid maslinic acid | [36] |
| Euscaphic acid | [16] | |
| Rosa rugosa (roots) | Euscaphic acid, tormentic acid, rosamultin | [37] |
| Euscaphic acid | [38] | |
| Tormentic acid | [39] | |
| Rosa multiflora (fruits) | Oleanolic acid | [23] |
| Rosa multiflora (roots) | Rosamultic acid | [40] |
| Rosa rugosa (leaves) | Sesquiterpenes | [41] |
| Rosa woodsii (leaves) | Sesquiterpenes | [42] |
| Rosa × damascena (buds) | Fatty acids | [43] |
| Rosa sempervirens (leaves) | Fatty acids | [44] |
| Rosa canina (fruits) | Fatty acids: palmitic acid, linoleic acid, linolenic acid, stearic acid, oleic acid | [45] |
| Fatty acids: palmitic acid, linoleic acid, linolenic acid, stearic acid | [46] | |
| Galactolipids | [47] | |
| Rosa canina (fruits, seeds, flowers, petals, buds) | Fatty acids (from C6 to C24), carotenoids (β-carotene, lycopene), chlorophyll a and b, ascorbic acid | [48] |
| Rosa canina (fruits) | Carotenoids (lutein, zeaxanthin, rubixanthin, lycopene, β-carotene) | [49] |
| Carotenoids (β-carotene, lycopene, β- chryptoxanthin, rubixanthin, zeaxanthin, lutein) | [50] | |
| Rosa × damascena (flowers) | B-carotene, tocopherols | [51] |
Despite the wide range of molecular families that can be found in roses, only two are well documented: polyphenols and volatile terpenes, while the characterization of other structures is rare. Moreover, the reported studies provide the identification of only a few targeted compounds in one plant organ at a time. Thus, to our knowledge, the literature does not provide an overview of the molecular composition of rose plant organs, which is required for the cosmetic use of rose extracts. Indeed, contrary to pharmaceutical concerns which necessitate obtaining purified active compounds, the plant extracts used in cosmetic formulations are currently complex mixtures. Consequently, given the lack of information concerning the phytochemistry of hybrid roses and in view of the agronomic and biological potential of ‘Jardin de Granville’, it is of great interest to develop a global analytical strategy for the qualitative investigation of the secondary metabolites of this rose variety. The investigation of four plant organs, namely wood, bud, flower and leaf, focusing on non-volatile families, was achieved to determine the global composition of the plant. Three extraction solvents covering a wide range of polarity were used: a mixture of ethanol and water, ethyl acetate, and heptane to provide information about a wide range of molecular families. Several complementary analytical techniques were combined to obtain the maximum amount of information about the composition of the extracts, and for each technique, the different parameters were optimized so as to adapt them to the polarity of different molecular families. The combined results of this approach are presented in this paper and represent the first global overview of ‘Jardin de Granville’ phytochemistry. Thanks to this kind of approach, the industrial valuation of the different plant organs can be facilitated with access to their molecular fingerprints.
2 Experimental
2.1 Standards and reagents
All solvents: ethanol (EtOH), ethyl acetate (EtOAc), methanol (MeOH), acetonitrile (ACN), acetone, heptane, chloroform and isopropanol (i-PrOH) were of analytical grade and were provided by SDS Carlo Erba (Val de Reuil, France). Water was purified (resistance < 18 MΩ) by an Elgastat UHQ II system (Elga, Antony, France). Formic acid (HCOOH), sulfuric acid, anhydrous acetic acid, vanillin, primuline, Neu reagent and BSTFA (N,O-bis(trimethylsilyl)trifluoroacetamide) were supplied by Sigma-Aldrich (Saint-Quentin-Fallavier, France). PEG was provided by VWR (Darmstadt, Germany).
Reference compounds: epigallocatechin gallate, kaempferol-3-O-rutinoside, quercetin-3-O-glucoside, linoleic acid, stigmasterol, lupeol, eugenol, squalene, hederagenin, α-tocopherol, β-sitosterol and farnesol were purchased from Extrasynthese (Genay, France).
2.2 Raw materials
Four different plant organs were collected in 2013 in the field of the company “André Eve, roses anciennes et nouvelles” located in Pithiviers-Le-Vieil (France). 400 plants of the variety Rosa × hybrida cv. ‘Jardin de Granville’® are cultivated in a 400 m2 field under organic farming conditions. A random sampling on the entire field was carried out and a pool of different plant samples was collected to accumulate sufficient quantities for the extractions. The following organs were collected by hand: woods in February and July, buds in May and August, flowers in June and August and leaves picked halfway up the stem in June and August. Woods were cut in 20 cm long pieces and were dried at room temperature. Buds were cut before opening and flowers were collected at a partially open stage. Buds, flowers, and leaves were stored at −20 °C until extraction. All these parts were lyophilized for extraction purposes except buds, the most fragile organ, which were powdered with liquid nitrogen before being lyophilized.
2.3 Microwave assisted extraction
The device used was a MicroSYNTH microwave oven (Milestone, Sorisole, Italy) monitored with the ‘easyCONTROL’ software. A carrousel suited for microwave extraction, containing twelve reactors, was used to manage the extractions. 1 or 4 g of each powdered organ was introduced in a 100 mL reactor and filled with 40 mL of EtOH/H2O: 9/1 (v/v), ethyl acetate or heptane. Three cycles of 30 s each were performed at an irradiation power of 1000 W for the EtOH/H2O extracts and four cycles were applied for EtOAc and heptane extracts. To limit the temperature increase and molecular degradation, reactors were allowed to cool in ice or at room temperature during 20 min between each cycle. The crude extracts were centrifuged before being evaporated using a rotary evaporator with the water bath temperature set at 45 °C. The weight of the dried extract was noted to calculate the extraction yields. The EtOH/H2O extracts were solubilized in MeOH, the EtOAc extracts were solubilized in a mixture of MeOH/ACN: 50/50 (v/v), and the heptane extracts were solubilized either in heptane (for GC–MS analysis) or in i-PrOH (for HPTLC, HPLC and UHPLC analysis). Stock solutions were prepared at 10 mg/ml and were stored at 4 °C until use.
2.4 HPTLC analysis
The device used consisted of an ATS 4 Automatic TLC Sampler (Camag, Muttenz, Switzerland) controlled by Win-CATS software. A Reprostar 3 (Camag) illumination unit was used to observe the plates. Samples were applied in 6 mm bands spaced 3 mm apart on 10 × 20 cm HPTLC silica plates F254 (Merck, Germany).
A chromatographic system adapted to polyphenol detection, named system 1, was first applied as described by Riffault et al. [52] to analyze the polar compounds. 10 μL of extract solutions at 1 mg/mL and 4 μL of standard solutions at 1 mg/mL were laid down on a 10 × 20 cm RP18 W HPTLC plate. The elution mixture was composed of ACN/H2O/HCOOH: 50/50/5 (v/v/v). Then, Neu’s reagent (1 g of diphenyl boric acid ethylamino ether in 100 mL of MeOH) was sprayed on the plate, which was dried, and immediately afterwards PEG (polyethylene glycol (PEG) 4000 at 5% in EtOH) was applied on it. After drying, spot visualization was done at 366 nm.
A second chromatographic system, named system 2, composed of heptane/chloroform/methanol: 2/2/0.5 (v/v/v), was used as the eluent to analyze the EtOAc and heptane extracts. After elution, performed using a horizontal elution chamber, the plate was observed under visible and UV light (254 and 366 nm). Then, an ethanolic solution of primuline was sprayed on the plate and the plate was dried before being read at 366 nm. A solution of sulfuric vanillin or of the Liebermann–Burchard reagent (5 mL of anhydrous acetic acid, 5 mL of sulfuric acid and 50 mL of ethanol) was then sprayed on the plate and the plate was heated at 100 °C for 5 min before being observed under visible light. 10 μL of extract at 2 mg/mL and 5 μL of reference compounds at 0.1 mg/mL were used respectively.
2.5 HPLC-DAD-ELSD analysis
Molecular content was analyzed using a LaChrom HPLC instrument (VWR, Fontenay-sous-Bois, France) equipped with a Diode Array Detector (DAD) and coupled to an Evaporative Light Scattering Detector (ELSD) Sedex 85 (SEDERE, Orléans, France), controlled using EZChrom Elite workstation software. The DAD was set from 200 to 800 nm to record absorbance spectra. Chromatograms were visualized at 270 nm. The acquisition system used was the Ezchrom software, version 3-2-1. The column used to separate the constituents was a C18 Nucleodur sphinx (Macherey–Nagel, Hoerdt, France), 150 × 4.6 mm, with a particle size of 5 μm fitted with a C18 security guard cartridge system. The first solvent gradient, named gradient 1, was developed to analyze the polar molecules contained in the EtOH/H2O and EtOAc extracts. It was composed of 0.1% formic acid in water (phase A), and 0.1% formic acid in methanol (phase B) and was applied as follows: 0–17 min: 5–36% B, 17–25 min: 36% B, 25–35 min: 36–50% B, 35–45 min, 50–70% B, 45–50 min: 70–90% B, 50–60 min, 90% B and finally 60–60.1 min 5% B, maintained for 10 min before each new injection. A second solvent gradient, named gradient 2, was carried out to separate the less polar compounds of the EtOAc and heptane extracts. It was composed of 0.1% of formic acid in water (phase A), 0.1% of formic acid in methanol (phase B), and 0.1% of formic acid in isopropanol (phase C) and was applied as follows: 0–5 min: 35% B, 5–15 min: 35–70% B, 15–30 min: 70–90% B, 30–40 min: 90–100% B, 40–50 min: 100% B, 50–55 min: 100–0% B and 0–100% C, 55–60 min: 100% C, then back to initial conditions. The column was introduced in a Jetstream oven and heated at 25 °C for polar compound analysis and at 40 °C for apolar molecule analysis. The injection volume was 20 μL.
2.6 HPLC-HRMS and UHPLC-HRMS analysis
The HPLC-HRMS analysis of the EtOH/H2O extracts was performed as described by Riffault et al. [52] and the same chromatographic conditions as those used for HPLC-DAD-ELSD analysis were applied. The UHPLC separations of the EtOAc and heptane extracts were performed using the method described by Riffault et al. [53]. An UltiMate 3000 RSLC system equipped with a binary pump, an autosampler and a thermostated column compartment (Dionex, Germering, Germany) was used. The column was an Acclaim RSLC 120 C18 (Dionex, Voisins-le-Bretonneux, France) of 250 × 2.1 mm with a particle size of 2.2 μm fitted with a C18 Security Guard Ultra (2.1 mm) guard filter (Phenomenex, Le Pecq, France). The mobile phase consisted of water (phase A) and a mixture of isopropanol:acetonitrile:acetone (50:40:10, (v/v/v)) (phase B). Acetone constitutes the necessary dopant for molecule ionization with an APPI source. A solvent gradient was applied as follows: 0–0.5 min: 25% B, 0.5–0.9 min: 25–38% B, 0.9–4.5 min: 38%–50% B, 4.5–6.2 min: 50–80% B, 6.2–28 min: 80–100% B, 28–38 min: 100% B and finally 38–39 min 25% B, maintained for 5 min before each new injection to equilibrate the column. The column was thermostated at 50 °C. The flow rate was set at 300 μL/min. The injection was done in full loop mode with a 1 μL sample loop. Extract solutions were injected at a concentration of 5 mg/mL and standard solutions were analyzed at 10 μg/mL.
MS experiments were carried out on a maXis UHR-Q-TOF mass spectrometer (Bruker, Bremen, Germany). For EtOH/H2O extract analysis, the method used was as previously described by Riffault et al. [52], using the negative electrospray ionization mode. The capillary voltage was set at −4.5 kV and the flows of nebulizing and drying gas (nitrogen) were respectively set at 1.2 bar and 8.5 L/min and the drying gas was heated at 200 °C.
The APPI source was chosen to perform the EtOAc and heptane extract analysis as it is suitable for low polarity compounds. Both positive and negative ionization modes were applied. In both conditions, the APPI heater temperature was set at 370 °C, the drying gas was heated at 200 °C and the nebulizing and drying gases were set at 1.5 bar and 4 L/min, respectively. For APPI in positive ionization mode, the capillary voltage was set at 2 kV and for APPI in negative ionization mode the capillary voltage was set at −2.7 kV. A complementary method using the electrospray source in the positive ionization mode was applied to achieve the complete characterization of sphingolipids. The capillary voltage was set at 4.5 kV, and the nebulizing and drying gases were respectively set at 1.1 bar and 9 L/min. The drying gas was heated at 200 °C. The mass spectra were recorded in the range of 50–1500 m/z. The chemical formulae were generated using accurate mass measurements and the SmartFormula algorithm from Data Analysis 4.0 software (Bruker).
2.7 GC–MS analysis
2.7.1 Derivatization procedure
To make all the compounds present in the different extracts volatile, a derivatization procedure was implemented. Firstly, dried extracts were dissolved in heptane at a concentration of 5 mg/mL and then 50 μL of these solutions were mixed with 50 μL of BSTFA. The mixture was heated for 10 min at 100 °C and was ready to be analyzed. The same procedure was applied to the standard solutions prepared at a concentration of 0.1 mg/mL in heptane.
2.7.2 Chromatographic parameters
The device used was a single quadrupole ISQ GC–MS system (Thermo, Villebon-sur-Yvette, France) controlled using Xcalibur software, equipped with an RTX-5 MS column (Restek, Lisses, France) of 0.25 mm × 60 m, with a film thickness of 0.25 μm. Helium was used as the carrier gas and the flow was set at 1.2 mL/min 1 μL of each sample was injected in splitless mode. A temperature gradient was applied and started from 100 °C to 330 °C with a linear increase of 4 °C/min, then maintained for 10 min before returning to the initial temperature. The transfer line temperature was set at 300 °C. The mass range was set from 35 to 800 m/z. The mass spectrometry analyses were run in the electron ionization mode at 70 eV.
2.7.3 Compound identification
Compound identification was performed by comparing the retention time of reference molecules and that of compounds present in the extracts and then using the Qual Browser tool of Xcalibur to determine the concordance of the mass spectra with those of the reference molecules (internal library) analyzed under the same experimental conditions. To propose an identification method for other compounds in the extracts, a comparison with the NIST spectral library was also performed.
3 Results
To explore and compare their phytochemical composition, four ‘Jardin de Granville’ organs were investigated, namely wood, bud, flower and leaf. Three microwave assisted extractions were carried out for each organ with solvents of different polarities: a mixture of ethanol and water in the proportion 9/1 (v/v), ethyl acetate (EtOAc), and heptane. Different extraction yields were obtained depending on the extraction solvent and the extracted organ. They ranged from around 5 to more than 30% for the EtOH/H2O extracts, from 0.7 to 2.4% for the EtOAc extracts and from 0.1 to 1% for the heptane extracts (Table 3). Polar compounds seemed to be more abundant in the plant compared to the less polar ones.
Extraction yields (extract dried weight/initial plant weight) obtained from the four plant organs depending on the extraction solvent.
| Organ | Extraction yield | ||
| EtOH/H2O | EtOAc | Heptane | |
| Wood | 7.7% | 0.7% | 0.2% |
| Bud | 5.2% | 2.0% | 0.1% |
| Flower | 31.4% | 0.9% | 0.6% |
| Leaf | 14.1% | 2.4% | 1.0% |
An original analytical strategy was developed to compare the four extract compositions, starting with general information and progressively refining the level of identification. Taking into account the ease of implementation of the technique, the rapidity of the analysis, and the suitability of the method with respect to compound polarity, this approach progresses from the global overview of each organ fingerprint to the identification of their constituents.
Four chromatographic techniques were implemented: High Performance Thin Layer Chromatography (HPTLC), High Performance Liquid Chromatography (HPLC) coupled with a Diode Array Detector (DAD) and an Evaporative Light Scattering Detector (ELSD), Ultra-High Performance Liquid Chromatography (UHPLC) coupled with High Resolution Mass Spectrometry (HRMS), and Gas Chromatography (GC) coupled with Mass Spectrometry (MS). All these techniques made it possible to specify the precise nature of the compounds present in the extracts and thanks to the combined information, to propose reliable identifications to establish the exhaustive molecular fingerprint of ‘Jardin de Granville’ extracts.
3.1 HPTLC screening
First, a fast HPTLC screening of the four organ extracts was performed. To be able to properly separate and detect the compounds of the three types of extract, several chromatographic systems were tested and optimized. Finally, two systems were sufficient to analyze all the extracts. The first HPTLC system (HPTLC system 1) used a mobile phase composed of ACN/H2O/HCOOH: 50/50/5 (v/v/v) and RP18 W silica plates as the stationary phase, well-adapted to polar compound analysis (Fig. 1A). A polyphenol specific reagent, spraying Neu’s reagent and PEG, were applied on the plate and the presence of several phenol types was deduced compared to the reference compound colors. Some tannins were visualized as they exhibited a blue fluorescence. They were detected in the four organ extracts. Quercetin derivatives showed yellow spots and kaempferol derivatives showed green ones. Wood seemed to be the poorest in this type of phenols, whereas bud, flower and leaf extracts exhibited several yellow and green bands showing a similar frontal ratio (Rf) to those of reference molecules. This initial overview of the EtOH/H2O extract composition was in good agreement with the literature concerning the polyphenolic structures identified in roses. The HPTLC system 1 was also used to analyze the EtOAc and heptane extracts (results not shown). In the EtOAc extracts only a few green and yellow bands were visible in bud, flower and leaf extracts while no phenolic bands were detected in any of the heptane extracts.

HPTLC analysis of EtOH/H2O extracts (A) from Riffault et al. [52] – 366 nm, EtOAc extracts (B) – visible light, and heptane extracts (C) – visible light. Legend: w: wood extract, b: bud extract, fl: flower extract, le: leaf extract, epiG: epigallocatechin gallate, kae: kaempferol-3-O-rutinoside, que: quercetine-3-O-glucoside, hed: hederagenin, stig: stigmasterol, farn: farnesol, eug: eugenol, lup: lupeol, toco: α-tocopherol, lin: linoleic acid, squa: squalene, sito: β-sitosterol.
The second HPTLC elution system (HPTLC system 2), involving silica plates eluted with a mobile phase composed of heptane/chloroform/methanol: 2/2/0.5 (v/v/v), was developed to analyze compounds of intermediate and low polarity (Fig. 1B and C). Several reference molecules such as terpenes (hederagenin, farnesol, lupeol, squalene), sterols (stigmasterol, β-sitosterol), fatty acids (linoleic acid) and α-tocopherol, likely to be present in the EtOAc and heptane extracts, were used. Primuline was first sprayed on these plates. This reagent forms non-covalent interactions with the apolar fatty acyl residues of lipids [54] leading to a bright blue fluorescence but is also able to interact with apolar compounds such as sterols or terpenes. After spraying primuline on plates 1B and C, the presence of bright blue fluorescent spots was observed in all the EtOAc and heptane extracts, suggesting the presence of various lipids. Primuline allows the successive spraying of another reagent because it does not deteriorate the structure of the molecules, making it possible to obtain more information on the compound using a single plate. A second spraying of sulfuric vanillin for the EtOAc extracts (Fig. 1B) or of the Liebermann–Burchard reagent for the heptane extracts (Fig. 1C) was applied. They are both non-specific reagents but spots of different colors are obtained depending on the molecular structures. Then, by comparing with the migration distance of several reference molecules, the families present in the extract were deduced. In EtOAc extract analysis (Fig. 1B), variations in composition were observed depending on the organ type. The bud extract seemed to be the poorest in terms of band number and intensity. On the contrary, the heptane extract compositions of the four plant parts are more homogenous, as similar Rf and band colors were visible (Fig. 1C). One intense purple band at Rf 0.3 present in the four extracts seemed to correspond to β-sitosterol.
Thus, the EtOAc extracts seemed to be composed of flavonoids, terpenoids, fatty acids and sterols. The heptane extracts did not contain polyphenols, but seemed to be richer in less polar compounds such as sterols, lipids, tocopherols and squalene. Numerous red fluorescent spots were also visible in the heptane extract, representative of chlorophyll derivatives (results not shown).
Thanks to the application of different reagents, the HPTLC analysis highlighted the molecular families present in each extract. A rapid comparison of the four organ extract compositions was achieved in only two HPTLC analyses: the first HPTLC system, which is well adapted for the most polar compounds, and the second one which is well adapted for the least polar molecular families.
3.2 HPLC-DAD-ELSD analysis
To characterize the extracts more completely and to determine the number and relative abundance of different compounds, some HPLC-DAD-ELSD methods were developed. The same reference compounds as for HPTLC analysis were used to select the appropriate stationary phase and mobile phase composition. The two complementary detectors were necessary to be able to visualize all the molecules. The DAD only properly detected compounds which possessed an absorbance spectrum whereas the ELSD detected all solutes that were less volatile than the mobile phase, even if they did not contain a chromophore group. With the ELSD response, it was easier than with UV to visualize the relative content of all the compounds in the extract. Due to the wide polarity range of the expected compounds, two chromatographic gradients were optimized to obtain a good separation of the extract constituents. The wood extract chromatograms are shown as an example in Fig. 2. The first HPLC method (HPLC gradient 1) was adapted to polyphenol separation and detection. It consisted of a gradient involving two solvents: water and MeOH, both acidified with formic acid (Fig. 2A). The chromatograms were recorded at 270 nm or 366 nm which are the characteristic wavelengths of tannins and flavonoids, respectively.

HPLC-DAD-ELSD chromatograms of the wood extract. A: Analysis of EtOH/H2O (a) and EtOAc (b) extracts under HPLC gradient 1 conditions. B: Analysis of EtOAc (b) and heptane (c) extracts under HPLC gradient 2 conditions. Black traces correspond to UV detection recorded at 270 nm. Blue traces correspond to ELSD records.
The second HPLC method (HPLC gradient 2) combined three solvents in the mobile phase (Fig. 2B). Isopropanol in particular was necessary to elute the less polar compounds from the column.
The absorbance spectra of the compounds present in the EtOH/H2O extract (Fig. 2A-(a)) show the presence of numerous tannins as well as several flavonoids, both visible on the DAD chromatogram at 270 nm. Nevertheless, ELSD detection exhibits one major chromatographic peak eluted close to void volume, representative of sugars. The ELSD detector gives a signal proportional to the real amount of compounds present in the extract compared to the absorbance signal which is dependent on the nature of compounds. Thus, sugars seemed to be the main constituents of the EtOH/H2O extract whereas polyphenols represent only a small amount of the extracted molecules. Two characteristic elution zones were obtained as shown in Fig. 3A. Tannins were eluted first, from 0 to 31 min and exhibited one absorbance maximum around 270 nm. Flavonoids were eluted second, from 27 to the end of the chromatogram and showed two characteristic absorbance maxima, one around 270 nm and one near 360 nm. On comparing the composition of the four extracts, wood extract seemed to be the poorest in flavonoids, which is in good agreement with the HPTLC analysis.

HPLC-DAD chromatogram of the four organ extracts. A: Analysis of the EtOH/H2O extracts under HPLC gradient 1 conditions, DAD detection recorded at 270 nm. B: Analysis of the EtOAc extracts under HPLC gradient 2 conditions with ELSD detection. C: Analysis of heptane extracts under HPLC gradient 2 conditions, with ELSD detection.
A few polyphenols were also visible on the wood EtOAc extract (Fig. 2A-(b)) but the main compounds constituting the extract were observed at the end of the chromatogram as detected by the ELSD. These less polar compounds were better separated under HPLC gradient 2 conditions (Fig. 2B-(b)). The DAD detector did not provide much information on the less polar families. Only a few characteristic carotenoid and chlorophyll absorbance spectra were observed in the EtOAc and heptane extracts. The ELSD detector was necessary to detect the other low polarity compounds which did not possess a chromophore group. By analyzing the reference molecules, three chromatographic elution zones could be distinguished, as shown in Fig. 3B and C. Polyphenols were rapidly eluted in less than 13 min, then triterpenoids and fatty acids were detected between 13 and 33 min. Finally, the other less polar families were eluted from 33 min to the end of the chromatogram. The EtOAc extracts showed numerous peaks eluted all along the chromatogram (Fig. 2B-(b) and Fig. 3B) while the heptane extracts exhibited very intense peaks eluted from 40 min to the end of the chromatogram (Fig. 2B-(c) and Fig. 3C). The bud extracts appeared to be the poorest in low polarity molecules, confirming the initial results obtained by HPTLC analysis.
Two HPLC-DAD-ELSD methods were used to obtain complementary chromatographic fingerprints of each extract and to compare the number of compounds present and their relative abundance in each organ extract. A better idea of compound identity was also obtained thanks to the recording of the absorbance spectra. However, to acquire more information about the compound identity, other chromatographic (UHPLC and GC) techniques coupled with mass spectrometry detection were used.
3.3 UHPLC-HRMS and GC-MS identification
To perform the on-line identification of each compound, UHPLC gradients were developed to better separate solutes, as UHPLC columns (2.1 mm I.D. with a particle size of 2.2 μm) provide better efficiency and resolution than classical HPLC columns (4.6 mm I.D. with a particle size of 5 μm) and also reduce solvent consumption by decreasing the mobile phase flow rate. In view of the different polarities of the extracted molecular families, two elution gradients were optimized: one adapted to polar phenolic compounds and one for less polar compounds. Mass spectrometry is a powerful tool which provides structural information on molecules. However, ionization parameters have to be appropriate to the physicochemical properties of the compounds analyzed. The type of ionization source and mode of ionization were therefore optimized so as to be adapted to extract polarity (Table 4). The Electrospray Ionization Source (ESI) is well suited to polar compound ionization while Atmospheric Pressure Chemical Ionization (APCI) and Atmospheric Pressure Photo-Ionization (APPI) sources are usually used for more apolar molecule ionization. Thus, ESI was used to analyze the polar molecules present in the EtOH/H2O extracts and APPI for the EtOAc and heptane extracts. However, in order to obtain the most exhaustive fingerprint possible, generic ionization parameters were applied in order to detect the majority of compounds properly. Both positive and negative ionization modes were tested. Then, high resolution mass spectrometry gave access to the accurate mass of compounds. The corresponding molecular formula was established thanks to Data Analysis software and probable structures were assigned by searching in the Chemspider database. Finally, fragmentation analysis confirmed the proposed identifications.
Ionization source and mode used for the analysis of the three types of extracts with the corresponding detected molecular families.
| Extraction solvent | Source and ionization mode | Detected compounds |
| EtOH/H2O | ESI, negative | Polyphenols |
| EtOAc | APPI, negative | Polyphenols, triterpenoids, fatty acids, glycolipids, sphingolipids, chlorophyll derivatives, sterol derivatives, triglycerides |
| ESI, positive | Sphingolipids | |
| Heptane | APPI, negative | Fatty acids, triglycerides |
| APPI, positive | Squalene, sterols | |
| EI | Fatty acids, squalene, α-tocopherol, (β-sitoterol) |
To characterize the EtOH/H2O extract, the negative ionization mode was more appropriate for polyphenol detection. Molecules were detected mainly as deprotonated molecule ions [M − H]−. Among tannic structures, characteristic fragments were obtained corresponding to galloyl units (m/z 169) and HHDP (hexahydroxydiphenyl) units (m/z 301). Some proanthocyanin dimers were also detected and the characteristic catechin fragments were visible in MS/MS spectra (m/z 289). Concerning the flavonoid structures, several quercetin and kaempferol derivatives were detected. They corresponded mainly to glycosylated derivatives. They were identified thanks to the presence of the genin base fragments (m/z 284 for kaempferol derivatives and m/z 301 for quercetin derivatives) and the loss of the sugar moiety. As a result, nearly 60 phenolic compounds were identified and were described by Riffault et al. in 2014 [52]. Compound intensities differed between the four plant organs. The wood and leaf extracts were richer in catechin derivatives and proanthocynidins while the bud and flower extracts exhibited more numerous and intense kaempferol derivatives. A summary of several compounds exhibiting intense peaks and present in all the four organs is presented in Table 5. All mass error values, corresponding to the difference between the recorded accurate mass and the theoretical accurate mass of a given molecular formula, were below ±2 ppm, indicating that the proposed formulae are reliable.
Compounds exhibiting high peak intensities detected in all the four EtOH/H2O organ extracts.
| RT (min) | m/z | Molecular formulae | Proposed identification | |
| Polyphenols | 5.2 | 169 | C7H5O5 | gallic acid |
| 11.6 | ||||
| 14.6 | 785 | C34H25O22 | HHDP di-galloyl hexoside isomers | |
| 15.2 | ||||
| 12.7 | 289 | C15H13O6 | catechin | |
| 27.0 | 463 | C21H19O12 | hyperoside | |
| 27.9 | 609 | C27H29O16 | rutin | |
| 29.2 | 301 | C14H5O8 | ellagic acid | |
| 32.8 | 447 | C21H19O11 | kaempferol glucoside | |
| 37.0 | 431 | C21H19O10 | afzelin |
To characterize the EtOAc extract, it was necessary to combine two ionization sources and modes in order to elucidate the molecular structures. With APPI in negative ionization mode an exhaustive chromatogram was obtained for the EtOAc extracts. Nevertheless, some molecular families, such as triglycerides or some sterols, were detected with a higher intensity in the positive ionization mode. Deprotonated molecule ions were detected in their monocharged form [M − H]- and in-source dissociation led to the detection of some fragments. MS/MS analyses were then performed to gain more insight into the molecular structures. For lipid identification, characteristic fragments corresponding to the fatty acyl chains and to sugar losses were obtained. Triterpenoids exhibited specific molecular formulae with 30 carbon atoms and several hydroxyl losses were visible on MS/MS spectra. Lastly, chlorophyll derivatives exhibited particular molecular formulae with 4 nitrogen atoms and the presence of characteristic fragments was also detected. The use of the ESI source in positive ionization mode was also necessary to confirm sphingolipid structures. Around 60 molecules were characterized, belonging to polyphenols, triterpenoids, fatty acids, glycolipids, sphingolipids, chlorophyll derivatives, sterols and triglycerides. Their detailed identification is described in Riffault et al. [53].
The elution order of the different families is shown in Fig. 4. In the first elution zone, before 5 min, a few polyphenols were eluted. Then, pentacyclic triterpenes were eluted with fatty acids between 5 and 15 min, followed by a combination of glycolipids, sphingolipids and chlorophyll derivatives between 15 and 26.5 min. Finally, sterol derivatives and triglycerides were eluted from 26.5 to 40 min. The wood extract seemed to be the poorest in phenols, but more numerous and intense peaks were visible in the terpene and fatty acid zone of the latter. A relatively homogeneous composition in glycolipids and sphingolipids can be observed between the four organs. This is not surprising as these compounds correspond to ubiquitous cell wall constituents. Finally, the leaf extract seemed to be the poorest in triglycerides. Table 6 summarizes some of the molecules that were intensively detected belonging to the different molecular families. All of the listed compounds were present in the four organ extracts with the exception of triglycerides that were mainly detected in the flowers. The mass error values of the listed compounds were below ±3 ppm, showing that the proposed formulae are reliable.

UHPLC-APPI-HRMS chromatograms of the four organ EtOAc extracts using the negative ionization mode.
Molecules intensively detected and belonging to the different molecular families present in the EtOAc extracts.
| RT (min) | m/z | Molecular formulae | Proposed identification | |
| Polyphenols | 3.7 | 447 | C21H19O11 | kaempferol-hexoside |
| Fatty acids | 11.3 | 277 | C18H29O2 | linolenic acid |
| 12.4 | 279 | C18H31O2 | linoleic acid | |
| 13.6 | 255 | C16H31O2 | palmitic acid | |
| Triterpenes | 8.8 | 487 | c30h47o5 | euscaphic acid or tormentic acid or isomer |
| 10.0 | 471 | C30H47O4 | hederagenin or pomolic acid or maslinic acid or isomer | |
| 11.7 | 455 | C30H47O3 | betulinic acid or ursolic acid or oleanolic acid or isomer | |
| Glycolipids | 15.8 | 935 | C51H83O15 | diglycosylated glycolipid with two C18:3 acyl chains |
| 17.2 | 937 | C15H85O15 | diglycosylated glycolipid with one C18:3 and one C18:2 acyl chain | |
| Sphingolipids | 18.5 | 712 | c40h74no9 | d18:2 h16:0 |
| 18.8 | 712 | c40h74no9 | d18:2 h16:0 | |
| 23.9 | 814 | C46H88NO10 | t18:1 h22:0 | |
| 25.6 | 842 | C48H92NO10 | t18:1 h24:0 | |
| Sterols | 17.7 | 575 | C35H59O6 | stigmasterol glycoside |
| 27.4 | 835 | C53H87O7 | sitosteryl-linolenoyl-hexoside | |
| Chlorophylls | 23.4 | 883 | c65h71n4o6 | pheophytin b |
| 26.0 | 869 | c55h73n4o5 | pheophytin a | |
| Triglycerides | 29.7 | 875 | C57H95O6 | acyl chains 18:3, 18:2, 18:2 |
| 30.6 | 877 | C57H97O6 | acyl chains 18:2, 18:2, 18:2 |
As fewer molecular families were present in the heptane extracts compared with the EtOAc extracts, a supplementary method using GC–MS was developed to obtain more information on the composition of the heptane extracts. GC–MS analysis requires a BSTFA derivatization step to make compounds volatile prior to analysis. The total ion current chromatograms obtained for the four extracts are presented in Fig. 5. Thanks to the concordance of mass spectra with the NIST library and by comparing with reference molecules, the presence of several fatty acids such as myristic acid, linolenic acid, linoleic acid, palmitic acid, and stearic acid was detected as well as squalene, α-tocopherol and β-sitosterol. Buds and flowers appeared to be the richest extracts since numerous compounds were observed between 39 and 58 min β-sitosterol was detected abundantly in all the extracts. This is in good agreement with the HPTLC band intensity. Linoleic acid and palmitic acid seemed to be more intense in the wood and flower extracts while squalene was mainly present in the leaf extract and was detected in very small amounts in the other three extracts.
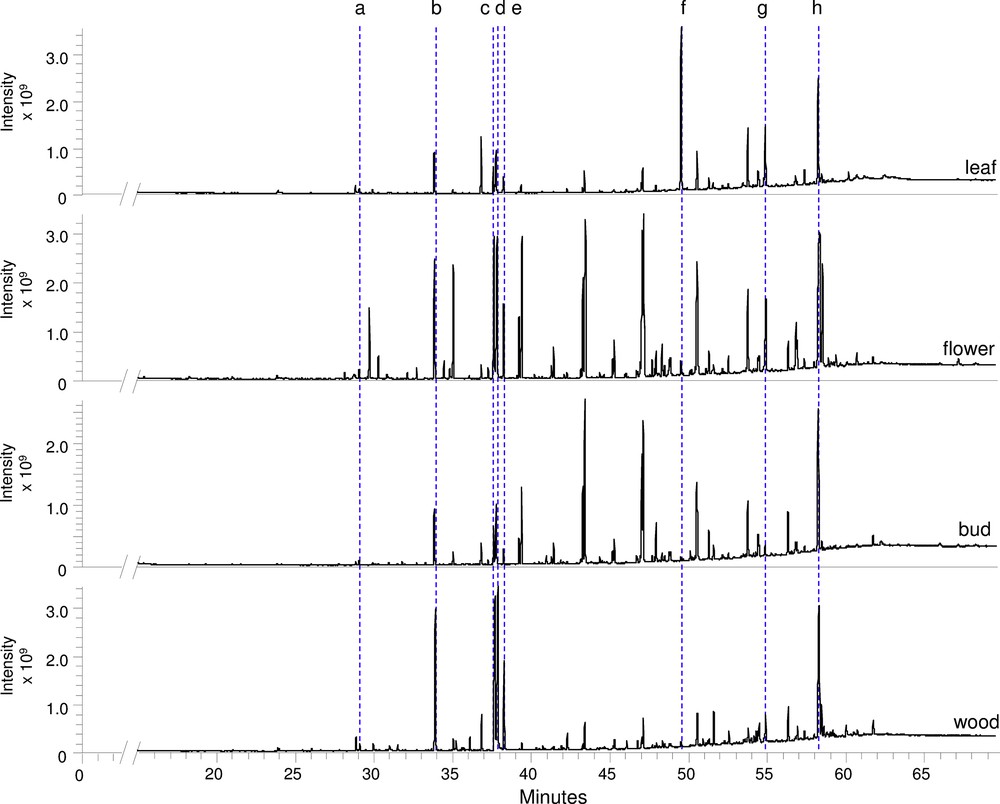
GC–MS analysis of the heptane extracts from four organs of ‘Jardin de Granville’ after derivatization with BSTFA. Identification of the main chromatographic peaks: a: myristic acid, b: linolenic acid, c: linoleic acid, d: palmitic acid, e: stearic acid, f: squalene, g: α-tocopherol, and h: β-sitosterol.
4 Conclusion
The exhaustive fingerprints of four ‘Jardin de Granville’ organs, using three extraction solvents, were obtained by four different analytical techniques. Each technique possesses specificities for compound detection. Thanks to HPTLC analysis, the molecular families present in the extract were highlighted and a first fingerprint comparison of the relative intensity of each band between the four organs was achieved. Thanks to HPLC-DAD analysis, a more detailed evaluation of the molecular families comprising molecules with chromophore groups was performed with the recording of the absorbance spectra. For all the non-volatile compounds, HPLC-ELSD analysis provided information on the real proportion of compounds in each extract. Lastly, a complete identification of the molecules was accomplished thanks to LC-HRMS and GC–MS analyses. This identification was greatly facilitated by all the previous analyses performed by HPTLC and HPLC.
The complementarity of the techniques made it possible to combine all the collected data and led to obtaining an exhaustive molecular fingerprint of the four plant organs. More than 120 molecular identifications characterize ‘Jardin de Granville’ non-volatile metabolites. A half of them correspond to polyphenols and other less polar families were detected. Concerning the identified polyphenols and triterpenes, results were in good agreement with compounds already described in roses. Thanks to this approach, it is the first time that such a diversity of molecular structures was detailed in a hybrid rose variety. All molecular families were detected in the four plant parts but the chromatographic peak richness and intensity varied between the different organs. This approach for the on-line exhaustive characterization of non-volatile compounds contained in the ‘Jardin de Granville’ rose can be used in view of its further industrial or cosmetic valuation and can be easily adapted to other plant investigations. It helps to know which solvent polarity and which organ to choose in order to obtain the extract composition that is the most suitable for a cosmetic application. Furthermore, this analytical approach also ensures quality control of extracts from one harvest to another or from one industrial production to another.
Acknowledgements
The authors thank ‘André Eve, roses anciennes et nouvelles’ for their advice during collection of the plants and Cyril Colas for his help concerning the use of the UHPLC-HRMS device.