

1 Introduction
In recent years, several nanocomposites and supports have been proposed for CO catalytic oxidation and NO reduction [1,2]. The catalytic activity of copper-ion-exchanged zeolite was early reported by Iwamoto et al. [3]. Cu-zeolite catalysts have been successfully used to selectively reduce NOx [4,5]. It is well known that the catalytic activity of different kinds of zeolites depends on the nature of the introduced cations. Metallic species with different oxidation states are usually incorporated into mordenite (MOR) by the ion exchange method [4,6,7]. The chemical composition of MOR normally corresponds to formula Na8Al8Si40O96·24H2O with SiO2/Al2O3 = 10, where the exchangeable extra-framework Na+ cations can be replaced with any transition metal ions [4,6].
The dispersion of active centers on the support surface and the accessibility of the reactant molecules within the pores of the catalysts are factors that enhance reaction efficiency and conversion [8,9]. In this sense, several silicas have been used as oxide supports for NOx and CO redox reactions due to their high specific surface area and wide opening pores [8–10]. In this work, the structural and chemical properties of silica and MOR were combined as a proposal to obtain a highly active and stable catalyst. Different amounts of MOR up to 50 wt% (y = 5%, 15%, 50%) were dispersed into silica. Cu was incorporated to the system by ion exchange method. Two routes (CuMOR1–y–SiO2 and CuMOR2–y–SiO2) were used in order to evidence their role in defining the final properties of the materials. The effect of the different preparation pathways has been thoroughly considered, and its possible applications in NOx and CO redox reactions were analyzed.
2 Experimental
Commercial ammonium mordenite CBV 21A (MOR) with molar ratio SiO2/Al2O3 = 20 and chemical composition (NH4)4.36[Al4.36Si43.64O96]·24H2O was used as a support. This formula for MOR chemical composition was used to obtain its total ion exchange capacity, calculated as 0.6 mequiv·g−1 (40 mg Cu ). For route No. 1, in a typical procedure, MOR was ion exchanged with a 0.1 N CuSO4·5H2O aqueous solution to obtain solid CuMOR [4,6]. Then, catalyst CuMOR1–y–SiO2 was prepared by introducing different wt% of CuMOR (y = 5%, 15% and 50%) during silica preparation by a traditional sol–gel (SG) process [11]. Meanwhile, by route No. 2, Cu ion exchange was realized once the MOR-y-SiO2 (y = 5%, 15%) solid was SG synthesized; this sample set was labelled as CuMOR2–y–SiO2. Pure SiO2 was also prepared as a reference. Samples obtained by both synthesis routes were thermally treated at 150°, 250°, 350°, 450° and 650 °C under H2 flow during 4 h to analyze Cu2+ species reduction.
X-ray diffraction data were collected by using a Philips X’Pert diffractometer with Cu Kα radiation. Surface areas were measured with a Micromeritics Tristar II 3020. Morphology and composition were characterized by SEM using JEOL JSM5300 microscope equipped with Thermo Noran 4473-B electron dispersion scattering (EDS). UV–Vis spectra were measured in a CARY-300-SCAN spectrometer. Catalytic activity tests of selected samples were performed in a continuous-flow fixed-bed quartz U-tube reactor with 4-mm internal diameter. Strictly, 0.1 g of catalyst was set into the reactor over a glass wool bed. Prior to the catalytic test, the materials were treated with a gas mixture flow (N2/O2 5% balance) until 500 °C with a heating ramp rate of 20 °C·min−1. The system was purged with helium during the cooling down process. Then, a gas mixture flow (57.6 mL·min−1) containing O2, NO, CO/C3H6 and N2 was used to evaluate CO oxidation and NO reduction. Conversions of CO and NOx were obtained at increasing temperatures until the system reached 550 °C with a heating rate of 2 °C·min−1. The catalytic activity was followed by CO and NOx conversion rates downstream the reactor with a SRI 8610C gas chromatograph and a CAI ZRE gas analyzer.
3 Results and discussion
The XRD patterns of the pure SiO2 (A), MOR (B), CuMOR1–15%–SiO2 (C) and CuMOR2–15%–SiO2 (D) are shown in Fig. 1. The pattern corresponding to the SiO2 sample (A) exhibited a broad weak peak centered at ca. 23° (2θ degree), normally assigned to amorphous silica [11]. Commercial MOR (B) displayed several diffraction peaks, located at 10°, 14°, 20°, 25, 26° and 27° (2θ degrees). These peaks coincide with those reported in the literature for pure MOR [12] and with the JCPDS file 80-0642. Reduced samples CuMOR1–15%–SiO2 (C) and CuMOR2–15%–SiO2 (D) demonstrated very similar diffraction patterns, displaying the superposition of a broad peak similar to that obtained for an amorphous SiO2 sample and small peaks corresponding to MOR. The low intensity of MOR patterns in the diffractograms is in agreement with the low weight content of CuMOR and with a very good dispersion on this samples. These peaks were marked as (*). Diffraction peaks corresponding to isolated copper were not observed. Previous reports showed that materials, like pure CuMOR [6,7] and Cu-silica displayed peaks for Cu when the samples were reduced at higher temperatures [9], but in our case Cu loading was much lower.
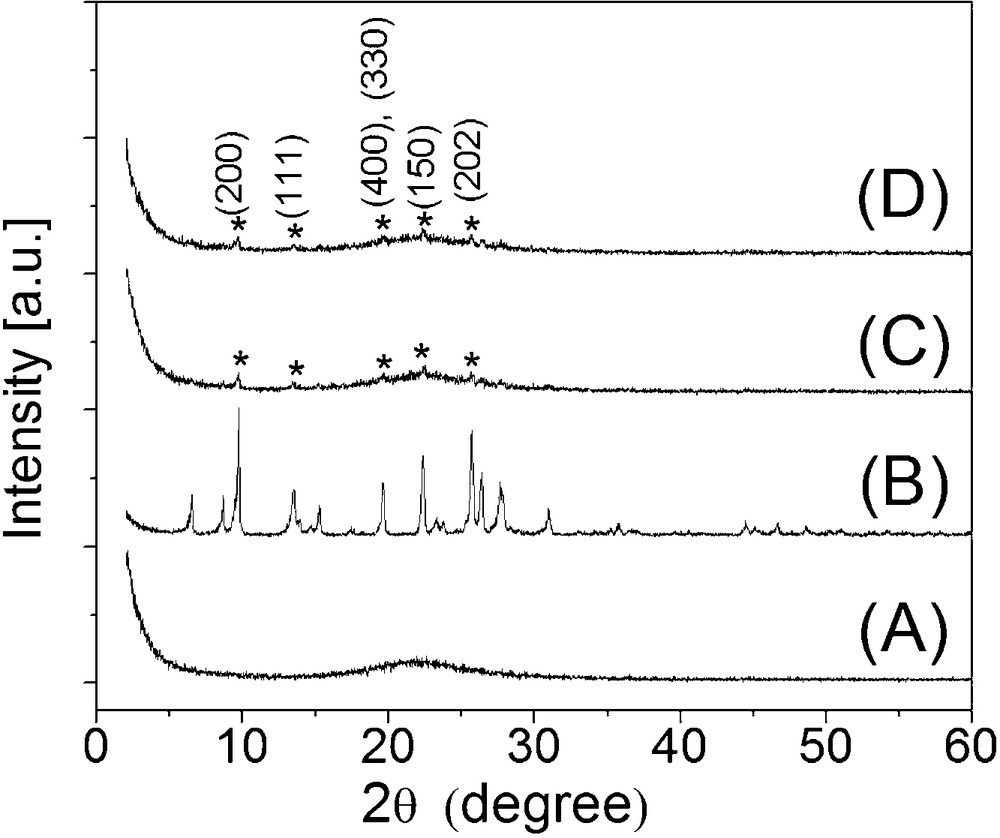
XRD patterns of the samples obtained by different copper-exchange synthesis routes. (A) SiO2 matrix, (B) MOR, (C) CuMOR1–15%–SiO2 and (D) CuMOR2–15%–SiO2.
Surface areas (SBET) for fresh and thermally treated materials were obtained by N2 adsorption/desorption isotherms (some of N2 physisorption data are included as Supporting Information). Fresh samples of SiO2, MOR and CuMOR showed surface areas of 209, 333 and 337 m2·g−1, respectively (Table 1).
Specific surface area (m2·g−1) of fresh and thermally treated materials under hydrogen flow.
| Sample label | Fresha | Theoretical dor mechanical mixture | Thermal treatments | ||||
| 150 °C | 250 °C | 350 °C | 450 °C | 650 °C | |||
| SiO2 | 209 | – | 240.0 | 231 | 231 | 227 | 95 |
| MOR | 333 | – | – | – | – | – | – |
| CuMOR | 337 | – | – | – | – | – | – |
| CuMOR1–5%–SiO2 | 240 | 224 | 227 | 265 | 276 | – | – |
| CuMOR1–15%–SiO2 | 251 | 253 | 241 | 243 | 263 | 313 | 309 |
| CuMOR1–50%–SiO2 | 318 | 355 | 333 | 341 | 380 | 373 | 327 |
| CuMOR2–5%–SiO2 | 238 | 224 | 298 | 321 | 324 | 330 | 342 |
| CuMOR2–15%–SiO2 | 288 | 253 | 279 | 274 | 289 | 317 | 365 |
a Instrumental error 6 ± m2 g−1.
With these SBET results of pure materials, a theoretical area for catalysts was obtained as in the case of a mechanical mixture; the procedure was as follows: . Both series, CuMOR1–y–SiO2 and CuMOR2–y–SiO2 were thermally treated under an H2 reducing atmosphere to obtain reduced Cu species. After each thermal treatment, the samples were analyzed (UV–Vis also, vide infra), then subjected to the next step of thermal treatment. All SBET results were summarized in Table 1. It is possible to observe that fresh samples exhibited slightly greater areas than theoretical values, suggesting a mutual influence and a successful incorporation of the MOR phase into the ternary mixed material. Samples CuMOR1–50%–SiO2 and CuMOR2–15%–SiO2 showed the highest surface areas among the series. Furthermore, an increase in the surface area was observed with increasing temperature, which could be related to phase segregation. Nevertheless, the reason for this effect is unknown and requires further investigations, which is beyond the scope of this work.
Fig. 2 shows selected UV–Vis spectra for CuMOR and CuMOR1–y–SiO2 series after thermal treatments as it was described above. In general, all acquired spectra displayed two regions, the first one from 200 nm to ca. 380 nm, which corresponds to charge transfer transitions from ligand to metal: O2− → Al3+, O2− → Cu2+and O2− → Si4+. The second region was defined from 400 nm to nearly 700 nm; in this case, the energy of absorption bands corresponds to the Cu plasmon resonance band [13].
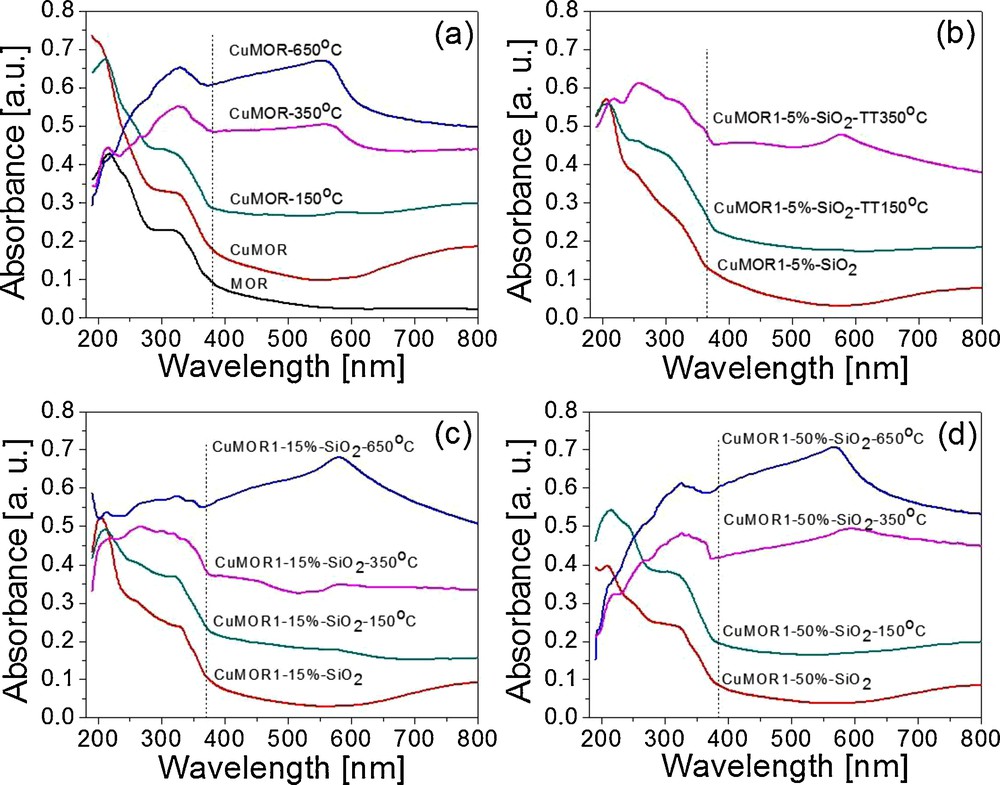
UV–Vis spectra of (a) CuMOR and (b, c and d) CuMOR1–y–SiO2 systems thermally treated at different temperatures.
Fig. 2a shows the UV–Vis spectra for fresh MOR, CuMOR and CuMOR reduced at 150°, 350° and 650 °C. A plasmon resonance band centered at 550 nm is clearly present, being more evident at higher temperatures (350° and 650 °C). This behavior was extended to all materials; nevertheless, the signal corresponding to Cu plasmon was easily observed with the increase in CuMOR content and temperature. SEM-EDS analysis confirmed the presence of Cu only in materials thermally treated at high temperatures.
The systems CuMOR1–15%–SiO2 (A) and CuMOR1–50%–SiO2 (B) were tested for simultaneous NOx and CO redox reactions (Fig. 3). CuMOR1–15%–SiO2 catalyst begun to be active in CO oxidation at ca. 400 °C and conversion increased almost linearly until it reached 10% at 550 °C. In the case of CuMOR1–50%–SiO2, activity began to appear near 330 °C and rapidly reached almost 50% CO conversion when the temperature increased. It has been reported that CO induces a slow induction activation process on the surface, depending on the CO feed-stream concentration [14]. Our materials presented activity at higher temperatures than reported in the literature for similar materials [14,15], probably due to the CO feed-stream concentration used in our experiments, as well as to the lack of an extra feed gas for the activation process (NH3) [15]. Finally, the catalytic activity results revealed a possible relation with the occurrence of Cu plasmon detection, supported by UV–Vis observations.
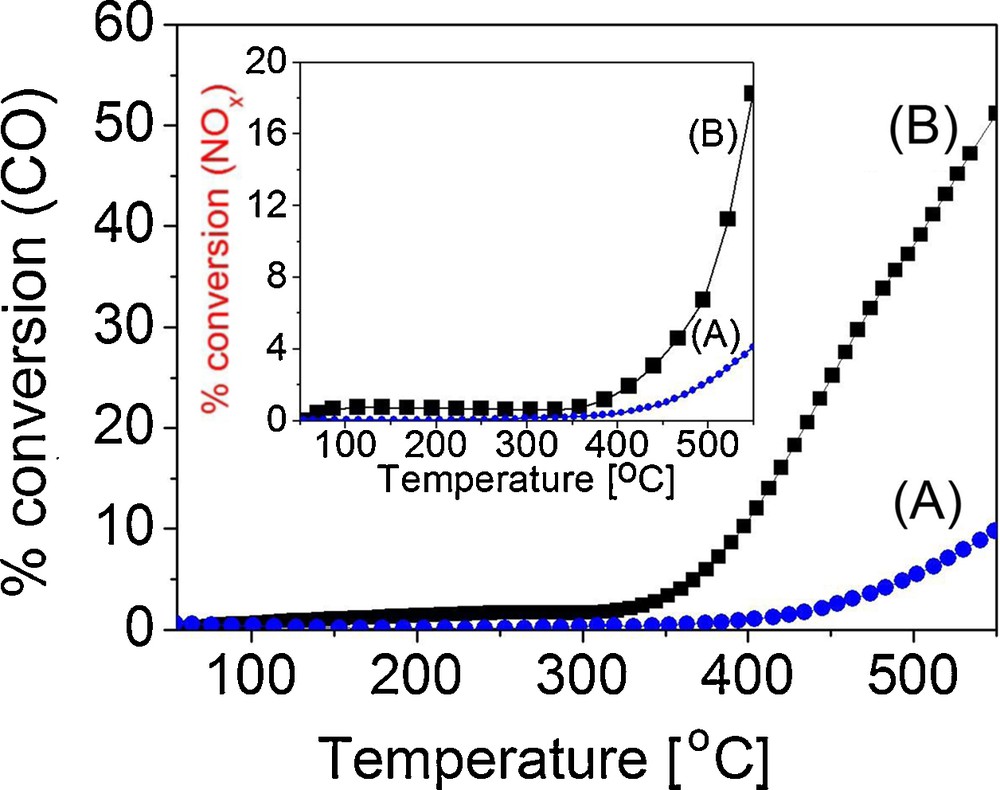
(Color online.) Catalytic activity test of CO oxidation, A) CuMOR1–50%–SiO2 and B) CuMOR1–15%–SiO2. Inset, test of NOx.
4 Conclusions
Synthesized materials revealed a good structural stability after the consecutive thermal treatments. The increase in the amount of Cu ion exchanged into the mixed materials resulted in easy copper plasmon detection by UV–Vis technique. Experimental comparison of the two routes to produce copper–mordenite silica mixtures (CuMOR–SiO2), clearly showed that the better way to incorporate Cu into the system was by obtaining first the CuMOR solid and then introducing it into the silica matrix (Route 1). A similar behavior was observed for both materials in the NOx reduction. Meanwhile a possible relation between the reduction temperature and the increase in the Cu plasmon excitation and the catalytic activity was observed. Finally, the CuMOR1–50%–SiO2 sample resulted in better chemical and catalytic properties within the series.
Acknowledgements
For their technical assistance of F. Castillón, E. Flores, E. Aparicio, I. Gradilla. Also financial support by PAPIIT-UNAM IN110713 and CONACyT No. 102907 projects.