

1 Introduction
N2O ranks third in greenhouse gases after carbon dioxide (CO2) and methane (CH4) and before hydrofluorocarbons (HFC), perfluorocarbons (PFC) and sulphur hexafluoride (SF6). N2O only accounts for around 0.03% of the total greenhouse gas emissions, but when expressed according to the Intergovernmental Panel on Climate Change (IPCC) in approved unit of CO2 equivalent, it accounts for 10% of the total emissions [1]. N2O is a powerful greenhouse gas with a very long lifetime of 150 years and a 320-fold stronger effect than CO2. Nowadays, the atmospheric concentration of N2O is about 324 ppbv and is still increasing at an alarming rate of 0.3% per year [2,3]. It is therefore of great need to understand and control the anthropogenic emissions of N2O [4]. Actually, anthropogenic N2O emissions come mainly from energy processes, chemical industries and agriculture and waste treatments. Wastewater treatment is responsible for 3.2–10% of the total N2O emissions [5], which corresponds globally to about 94% of the waste sector (Kyoto Protocol: the Kyoto Protocol to the United Nations Framework Convention on Climate Change (UNFCCC) is an international treaty that sets binding obligations on industrialized countries to reduce emissions of greenhouse gases. It was adopted by Parties to the UNFCCC in 1997, and entered into force in 2005).
N2O is mostly produced during biological nitrogen removal by nitrification and denitrification either in soil or in water [6–9]. These two processes are the main redox reactions in the N cycle, as shown in Fig. 1 below.

Schematic representation of the N cycle [6].
Fig. 1 shows also the production of the nitrous oxide (NO) during the N cycle and particularly during denitrification processes. While researches on N2O emissions are abundant, only few studies address NO emissions during wastewater treatment, even though NO has an indirect effect on global warming [10–12]. When emitted into the air, it counts among the atmospheric pollutants. By reacting with O2, it transforms into NO2, which yields photochemical oxidants responsible for increasing the greenhouse effect [1]. Also, it has been shown that N2O reacts with oxygen radicals in the stratosphere to form NO, which is involved in the depletion in stratospheric ozone [13]. NO is a potent cytotoxin, and bacteria deficient in nitric oxide reductase cannot grow through denitrification because they are killed by this toxic intermediate [14,15]. The NO production source can be either denitrifying bacteria or ammonia-oxidizing bacteria.
Nitrogen abatement in wastewater treatment starts first by a nitrification process. It consists in a succession of oxidation reactions transforming ammonia (NH4+) into nitrates (NO3−) under aerobic conditions by autotrophic bacteria transforming mineral substances into organic substances. Autotrophic nitrifying bacteria take their energy from ammonia or nitrites (NO2−) and their carbon source from CO2. First, NH4+ is transformed into hydroxylamine (NH2OH) by ammonia mono-oxygenase enzyme. Then, NH2OH is transformed into NO2− by hydroxylamine oxydoreductase enzyme, which is finally oxidized into NO3− by nitrite oxydoreductase [16–18]. Hence starts denitrification, which reduces nitrates into molecular N2 under anoxic conditions and by heterotrophic bacteria. The reductions are catalyzed successively by NO3− reductase, NO2− reductase, NO reductase, and N2O reductase. A large range of heterotrophic micro-organisms is able to denitrify. The growth of heterotrophs requires organic carbon supply [19].
Most denitrifiers are actually facultative aerobes, which means that they gain energy using O2 as the electron acceptor, but are able to switch to anoxic respiration and use NO3− as an electron acceptor when O2 is missing in order to survive environmental changes. The enzymes required for denitrification are activated by low oxygen partial pressure. The final product of denitrification is not always N2, but could be N2O and sometimes even NO, depending on the organisms involved and on the environmental conditions. Equally, NO3− does not need to be the terminal electron acceptor; instead, other intermediates may be used. For example, Alcaligenes faecalis and Pseudomonas perfectomarinus bacteria were shown to grow in the laboratory using N2O as an electron acceptor [19].
Another biological way of denitrifying is called “denitrifying nitrification”. It is a pathway carried out by the group of nitrifiers that perform the first step of nitrification and named the ammonium oxidizers, which oxidize NH4+ to NH2OH and then to NO2−. Under O2 stress, these organisms then reduce NO2− to gaseous forms of N (NO, N2O, N2) [20–22]. All these biological pathways of N2 abatement are presented in Fig. 2.
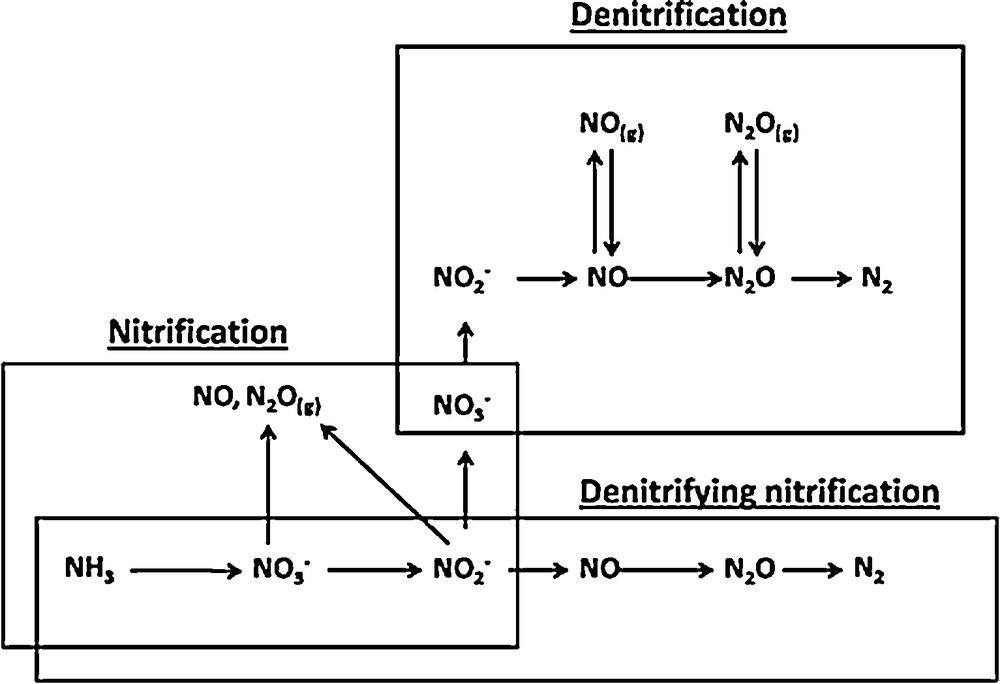
Biological pathways for the transformation of mineral nitrogen.
It appears from this figure that N2O and NO are always present in the N2 cycle. They are co-products during nitrification and their production is not necessary, while in denitrification, they are obligatory intermediates. This is the reason why this study focused on denitrification. During the denitrification step, NO and N2O intermediates may be present in both the aqueous and gas phases [4].
The denitrification process in WWTPs depends on several factors: biological kinetics and physicochemical parameters as pH, temperature, viscosity, substrate concentrations, dissolved oxygen concentration, low COD/N ratio or high nitrite concentration [22–24].
Also, the type of the carbon substrate is very important and affects the denitrification process either by enhancing or limiting it [25–27]. Competition to carbon source (electron donor) is behind some denitrification dysfunction [28]. For example, simplified reactions of denitrification with acetate are the following [29]:
| (1) |
| (2) |
| (3) |
As observed from equation (3), which corresponds to the mass balance equation of the denitrification process using acetate as the carbon source, denitrification leads to OH−accumulation, which elevates the pH of the medium during the process. Equation (3) allows us to determine the theoretical stoichiometric ratio COD/N for oxidizing acetate (without considering cell growth), which is equal to 2.86 to allow a complete denitrification from nitrates.
Temperature is a key parameter for denitrification [30]. The present study focuses on its impact on nitrogen abatement kinetics and on the production of both NO and N2O during the denitrification step. Generally, denitrification is performed by mesophilic micro-organisms with an optimal temperature around 30 °C [31,32]. In fact, the denitrification activity is very low below 5 °C, increases linearly until a maximum around 25–30 °C and thereafter decreases to a minimum at around 65 °C, where growth stops due to enzyme denaturation [6]. However, some denitrifying micro-organisms are able to denitrify at temperatures ranging from 5 °C to 65 °C [31].
The aim of this work is to understand the effect of temperature on N2O and NO emissions during denitrification performed in a batch reactor. It also attempts to suggest, within the observed biological kinetics, a metabolic behavior of denitrifying populations at different temperatures. Three temperatures are studied: 20 °C, 10 °C, and 5 °C. These values are chosen to be in the range of those encountered in the North of Europe. Acetate is used as a carbon source and the COD/N ratio is set at 3 during the different experiments in order to respect the stoichiometry of the denitrification process leading to complete denitrification. Respirometry measurements are performed before each denitrifying experiment to characterize the biological activity of the activated sludge used in this study. Nitrogen mass balance is discussed and different hypotheses are proposed to warrant the experimental results.
2 Experimental procedure
2.1 Bioreactor
Experimentations were achieved in a batch reactor of 10 L of working volume (Sartorius, Biostat® B Plus), stirred at 400 rpm with three Rushton type stirrers with six right paddles of 70 mm × 20 mm. The experimental setup used in this study is presented in Fig. 3. The reactor is equipped with different sensors: pH, dissolved O2, temperature, and redox potential. Temperature, gas flow rate, stirring velocity, pH and the oxygen saturation in the liquid phase were continuously controlled using an automatic device. The absence of oxygen during the denitrification experiments was controlled by measurement of the redox potential. The gas–liquid transfer of N2O and NO emissions to the atmosphere were enhanced by an upstream bubbling of He gas (0.42 L·min−1). The gas flow was determined in order to meet the restrictive experimental conditions of NO and N2O measurements by analytical apparatuses. For each experiment, the reactor is fed with a synthetic effluent composed of 1 L of synthetic solution containing acetate and nitrates, and 9 L of activated sludge (3–4 gVSS·L−1) collected from the biological basin of the Pontivy WWTP, South Brittany, France (with a treatment capacity of 100,000 PE, operating through an alternating nitrification–denitrification treatment of wastewater). The activated sludge was placed in the reactor under aeration, during 24 h at ambient temperature without pH adjustment to eliminate the residual COD before the beginning of the experiment. Before the beginning of each experiment, an intensive He flow was injected in the reactor to fully strip the initially dissolved gases (N2O, O2…).
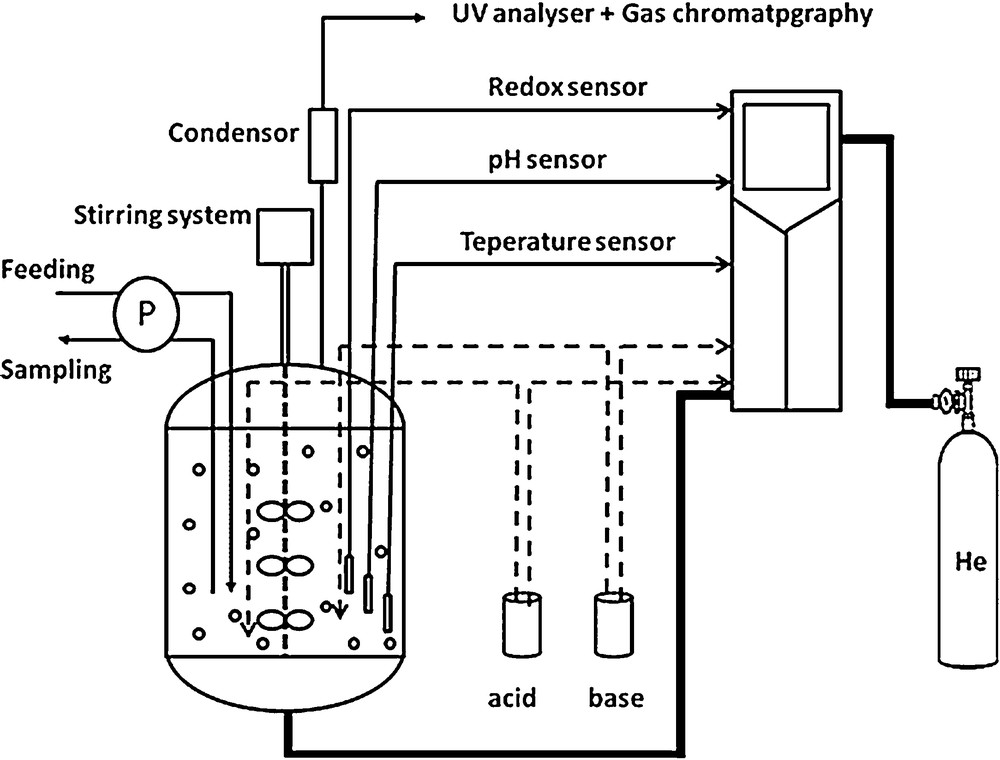
Experimental device used for the biological denitrification process.
2.2 Reactants
Sodium acetate (VWR) was used as biodegradable carbon source (electron donor). This choice is justified because acetate is rapidly and totally used by the activated sludge, which is very important for limiting the experimental analyzing period. It may also lead to the emission of N2O and NO, which was a crucial point for this study.
Nitrates were provided by a solution of sodium nitrates (VWR). The initial concentrations of the different substrates injected in the reactor were 40 mg·L−1 of N–NO3 and 120 mg·L−1 of acetate in order to respect a COD/N ratio equal to three. Ammonium chloride was incorporated in the reactor (6 mg·L−1 of N–NH4+) in order to avoid the limitation of the growth of denitrifying heterotrophic bacteria. The pH was continuously and automatically adjusted to 7 with HCl (1N) or NaOH (1N) solutions.
2.3 Analyses
Nitrates, nitrites, and COD concentrations in the liquid phase were determined by colorimetric methods according to French normalized standards NFT 90-101 for COD, NFT 90-012 for NO3−and NFT 90-013 for NO2−. The volatile suspended solids (VSS) were also measured at the beginning of each experimentation according to NFT (90-029).
The reactor headspace was periodically analyzed by using an online gas chromatograph (GC Varian CP-4900) to measure N2O emissions. A PoraPLOT U 10 M Backflush column and a Thermal Conductivity Detector (TCD) were used for the separation and the detection of N2O, respectively. NO emissions were also continuously analyzed thanks to a non-destructive ultraviolet analyzer (NGA 2000, Emerson analytical).
2.4 Respirometry
In addition to analyses performed on the gas and the liquid phases, respirometric assays were performed before each denitrifying experiment in order to characterize the biological activity of the sludge by estimating the heterotrophic population (XBH) responsible for denitrification. The XBH parameter was calculated according to equation (4) valid when exponential growth is assumed:
| (4) |
μH the maximal specific growth rate (h−1),
YH the growth yield of sludge.
Respirometry consists in measuring the uptake rate of the dissolved oxygen present in the sludge before its use in the 10-L denitrification reactor. It is a rapid and efficient method to characterize the biological activity of the heterotrophic biomass as well as its behavior in the presence of a synthetic influent at different temperatures [32]. Fig. 4 displays the experimental device for respirometric assays.
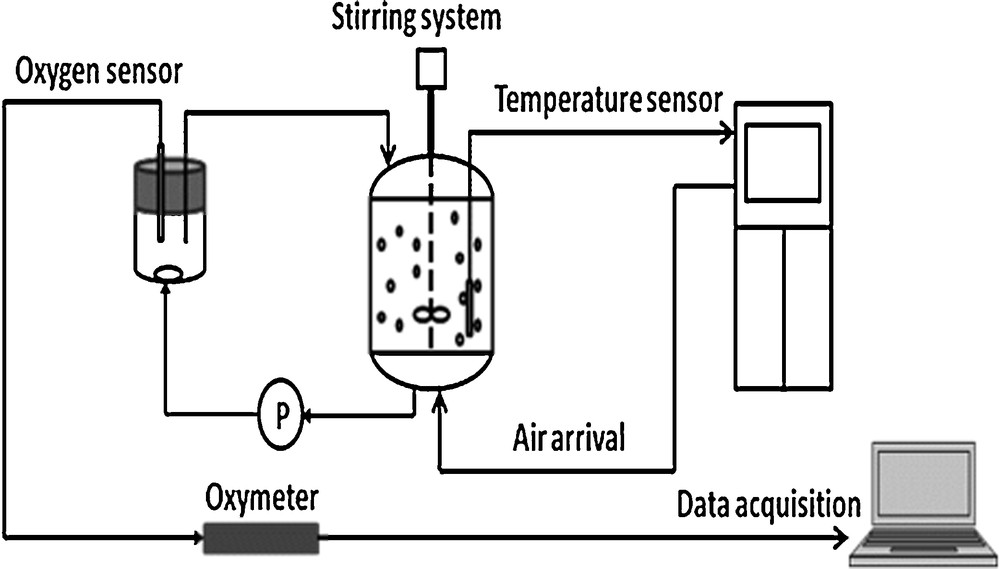
Experimental device used for the respirometric tests.
A reactor of 3 L of working volume (Bioflo 3000, New Bruswick) was connected to a small OUR measurement cell of 0.25 L. The sludge was warmed up during a starvation period (24 h). Then, 40 mg·L−1 ATU (allylthiourea) were added in the reactor to inhibit the nitrification since ATU inhibits autotrophic bacteria [33]. Thereafter, when the second respirometric endogenous threshold was observed, corresponding to the respiration of the heterotrophic denitrifying bacteria, acetate was injected in the reactor in aerobic conditions, and OUR was measured. It can be pointed out that no significant initial ammonia or nitrates were present in the tested sludge.
Three respirometric assays were performed at the different experimental temperatures: 20, 10 and 5 °C.
OUR is directly extracted from the respirometric curves, while the growth yield of sludge is estimated by integration of the oxygen uptake corresponding to the difference between the experimental and the endogenous respirometry curves. The oxygen uptake is proportional to the organic substrate consumption, as described in equation (5), and then to the yield of substrate assimilation (corresponding to YH). The YH value is close to 0.63 for the different experiments, which corresponds to the values found in the literature [34,35].
| (5) |
The maximal specific growth rate μH of the heterotrophic biomass is extracted from the bibliography and corresponds to 6 days−1 [36] for a temperature of 20 °C, and is estimated from equation (6):
| (6) |
3 Results and discussion
Respirometric experiments are displayed in Fig. 5a–c. The plotted curves show that in the different cases, OUR patterns can be characterized by two phases. The first one (numbered I on the graphics) corresponds to acetate consumption. The second one (numbered II) ends when the OUR has returned to its endogenous respiration value. In fact, the first phase corresponds to the consumption of oxygen associated with the degradation of the easily biodegradable carbon source (acetate), while the second step (II) is associated with the degradation of storage compounds such as PHA, PHB, EPS [38,39].
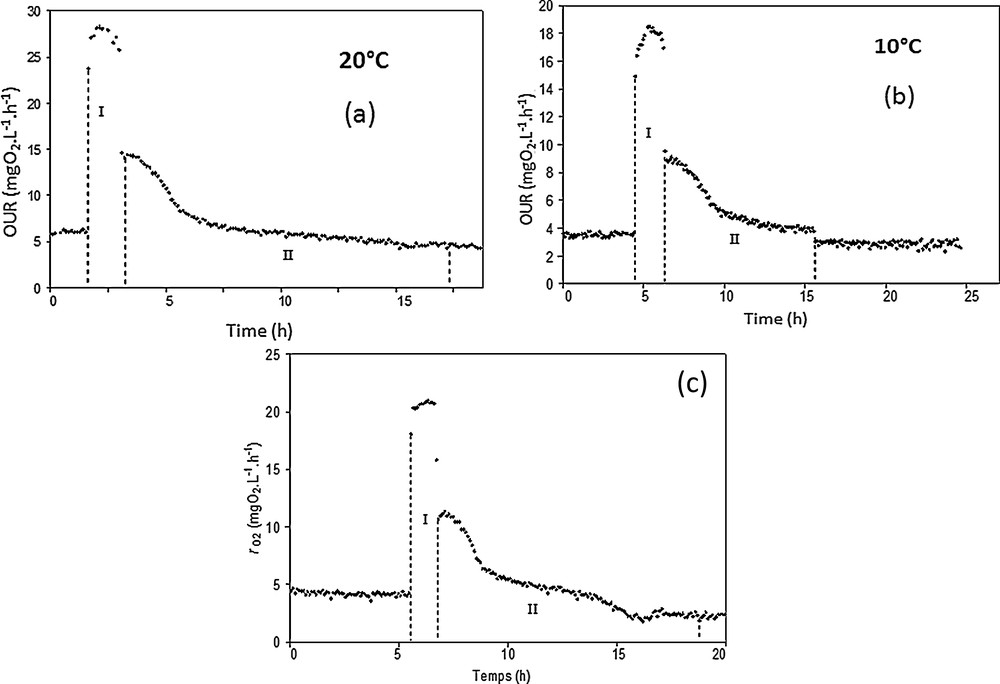
Respirometric experiments performed at 20 °C (a), 10 °C (b), and 5 °C (c).
Considering the results, the comparison between the duration of the two phases for the studied temperatures suggests that the kinetics of carbon degradation were quite constant at the tested temperatures under aerobic conditions. However, the OURexo max decreases significantly when the temperature is below 20 °C going from 23 to approximately 15 mgO2·L−1·h−1 for 10 and 5 °C, indicating that low temperatures slow down the carbon consumption kinetics.
Fig. 6a shows the time-related evolution of the reactants (nitrates and COD for acetate), of the intermediate (nitrites) and the gaseous compounds produced during the experiment performed at 20 °C. It appears that N2O emission is quickly observed after the injection of the reagents and reaches the highest value (around 500 ppm) after 1.3 h. N2O emission remains high (between 520 and 350 ppmv) for 3 h, then slows down and stops after 8 h of experimentation. A first observation indicates that N2O emission seems to follow throughout the experiment the trend of NO2− concentration in the liquid phase. The increase of N2O concentration at the beginning of the denitrification process (0.5 h) seems to be associated with a peak production of NO2− (almost 2 mg·L−1) in the solution. Later (after 3 h of denitrification), an accumulation of NO2−(around 2.7 mg·L−1) is observed and lasts two hours, before decreasing again. From 3 to 8 h, the nitrate concentration in the liquid phase stabilizes at 16 mg N–NO3−·L−1. During all this experimentation, NO was not detected in the gas phase.
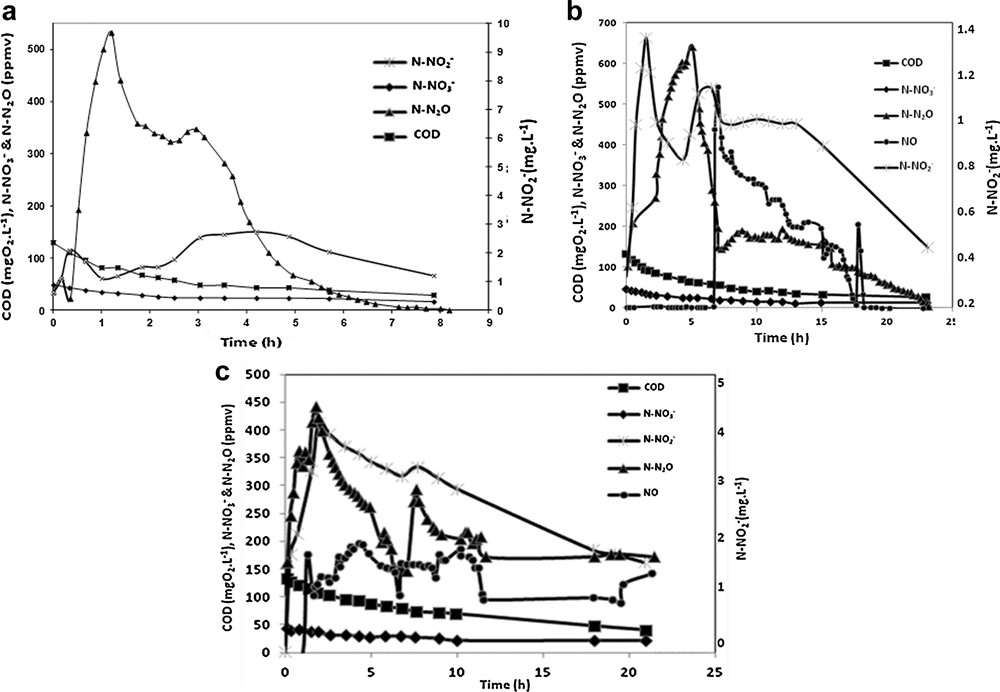
Time-related evolution of the concentration of the reactants and the gases emitted during the experiments performed at 20 °C (a), 10 °C (b), and 5 °C (c).
Fig. 6b presents the evolution of the target compounds previously defined for the same experimentation carried out at 10 °C. Once again, N2O emissions are observed rapidly after the introduction of the reagents in the liquid phase, and the fast increase in the N2O concentration in the gas phase is associated with the accumulation of NO2− in the liquid phase (C = 1.3 mg N–NO2−·L−1 after 1.5 h). N2O emissions reach a maximum after 5 h, and then tend to decrease. At the same time, a second accumulation of NO2− is observed (C > 1 mg N–NO2−L−1 after 5 h of experimentation) and NO is suddenly emitted after 7 h. While N2O emissions stabilize after 7 h, at a value close to 150 ppm, the NO concentration in the gas flow progressively decreases until it stops after 18 h of experimentation. N2O emissions are observed for 23 h.
The last experiment carried out at 5 °C is presented in Fig. 6c. In order to enhance the clarity of this figure, we choose to present the monitoring of the different compounds during the first 26 h. N2O emissions are still observed immediately after the introduction of the reagents and are correlated with nitrite accumulation in the liquid phase (C = 4 mg N–NO2−·L−1 after 2 h). NO is emitted after 2 h of experimentation and its concentration remains constant for 10 h. Nitrite accumulation is very important for this experiment and leads to larger emissions of NO and N2O. In order to compare the different results obtained at 20, 10 and 5 °C, the nitrogen mass balance and different kinetic parameters are summarized in Table 1.
Characteristic data obtained from experiments carried out at different temperature (5, 10, and 20 °C) during the denitrification step.
| Temperature (°C) | 20 | 10 | 5 |
| N–N2O emission (mg N) | 42 | 142 | 165 |
| N–NO emission (mg N) | 0 | 28 | 36 |
| N2O average emission rate (mgN·gVSS−1·h−1) | 0.15 | 0.19 | 0.21 |
| NO average emission rate (mgN·gVVS−1·h−1) | 0 | 0.04 | 0.05 |
| Nitrogen consumption (mgN·gVSS−1·h−1) | 1.2 | 0.5 | 0.25 |
| % N–N2O/N denitrified | 13 | 40 | 82 |
| % N–NO/N denitrified | 0 | 8 | 18 |
| VSS (g·L−1) | 3.48 | 3.28 | 3.1 |
First, we can observe that the average nitrogen abatement is slowed down when temperature decreases. This result is explained by the modification of the bacterial activity, which is affected by low temperatures. Respirometry experiments confirm this behavior, even though no difference was observed between the experiments carried out at 5 and 10 °C. Conversely, NO and N2O emission rates are more important at low temperatures, a possible explanation/hypothesis being that the reductions of NO3− and NO2− are not kinetically limited, while N2O and NO reductions are partially or totally affected [40]. Table 1 also shows that the lower the temperature, the more important N2O emissions are, corresponding respectively to 13%wt, 40%wt and 82%wt of the denitrified N–NO3− at 20 °C, 10 °C and 5 °C, respectively. NO contributes to 8%wt and 18%wt of the denitrified N–NO3− at 10 °C and 5 °C. This result may be explained by a general enzymatic slow down due to the low temperatures. In fact, the denitrification kinetics is considered as Monod type and the kinetic constants of each enzymatic reaction are temperature dependent according to the Arrhenius law. It is also reported in the literature that N2O reductase is affected by temperature to a greater extent than the other reductases [41]. We can also suggest that at 10 and 5 °C, N2O may exert an inhibition on its own enzyme reductase, resulting in an accumulation of N2O in the reactor.
Moreover, NO emissions are only observed at 10 °C and 5 °C. The absence of NO at 20 °C may be explained by a fast reduction of NO in these conditions. At lower temperatures, the reaction is strongly affected and slowed down, which leads to NO accumulation in the solution and then to NO emissions. The absence of the intermediate NO at 20 °C may also be explained by the simple absence of the NO2− reductase enzyme at 20 °C and NO intermediate, which means that the reduction of NO2− leads directly to N2O. This enzyme may appear after a temperature stress indicating a metabolic change by expressing the NO reductase gene. This metabolic change may occur in the same bacterial population as it can be correlated with the development of a new denitrifying population. Since NO is cytotoxic, it may inhibit the N2O reductase. Another hypothesis for the accumulation of both N2O and NO at low temperatures may arise from an electron competition between the different denitrification steps (Fig. 2), which would mainly affect N2O reductase [42] and also NO2− reductase. It is also important to remind that respirometry suggests the presence of a carbon storage compound after few hours of denitrification experiments. The new kind of carbon source may induce a different electron competition between the reductases and also different kinetic constants, lowest than with acetate implying the observed emissions of NO and N2O. Finally, N2O accumulation may be due to the absence of the N2O reductase gene, as it is the case for some denitrifying bacteria such as Agrobacterium tumefaciens [42]. Some recent works also showed that N2O emissions occurred at warm temperatures [43,44], which means that both denitrifying bacteria could be affected by low or high temperatures.
4 Conclusion
The effect of temperature upon N2O and NO emission during the biological treatment of nitrate presented in this work indicates that temperature is a critical parameter for wastewater treatment and especially for nitrogen abatement. At 5 °C, 100% of the denitrified nitrogen could be stripped to the atmosphere as NO and N2O. In fact, low temperatures slow down all denitrification enzyme activities and especially NO and N2O reductase activities, inducing important emissions of N2O, but also of NO. In addition, N2O reductase could be inhibited by the accumulation of NO and N2O in the biological reactor, which explains the accumulation and emission of N2O, causing a significant pollution transfer to the atmosphere. Other hypotheses are proposed to explain NO and N2O emissions:
- • electron donor competition negatively affects NO and N2O reduction;
- • the kind of carbon electron donor may impact the kinetic constants;
- • low temperatures may induce a metabolic change by expressing the NO2− to NO reductase gene after a stress.
It is, however, important to point out that the full mechanisms behind the accumulation and emissions of NO and N2O during denitrification are still a subject of debate, and that many efforts must be done in order to understand this complex process.
Acknowledgments
The authors acknowledge the “Région Bretagne, France” under Grant No 0211/05007930/00030953 for the financial support brought to the PhD work in the frame of which this study has been carried out.