

1 Introduction
Biomass is considered to be one of the most abundant alternative energy sources. Its great potential results from its low price and wide availability and from the fact that it does not contribute to the increase in the emission of carbon dioxide [1,2]. Moreover, lignocellulosic biomass, consisting mainly of cellulose, hemicelluloses and lignin, does not compete with the production of food. Among the most popular methods for its conversion are pyrolysis and gasification [3–5]. Both of them allow one to obtain liquid fraction, permanent gases and solid residue (char). However, the contribution of each one of these phases can be different depending on the type of process and reaction conditions. Fast pyrolysis consists of the thermal decomposition of feedstock in the absence of reactive gas (oxygen or steam), leading to the maximization of the liquid products [6]. This can be achieved by very high heating rates of the biomass and fast separation of the arising products, which limits secondary cracking reactions resulting in the formation of a larger amount of gases [7].
In spite of the optimization of the reaction conditions, the produced bio-oil is usually a mixture of hundreds of organic compounds that can be divided into several groups: hydrocarbons, acids, ketones, aldehydes, alcohols, sugars, esters, ethers, epoxides and others. Moreover, the presence of water is also observed. Water and a wide group of oxygen-containing compounds are responsible for most of the bio-oil disadvantages, including low heating value, corrosiveness, chemical and thermal instability and immiscibility with petroleum fuels. It is therefore impossible to supply such a product directly to automotive engines. One of the most popular processes leading to the improvement of bio-oil quality is the reduction of the oxygen content by converting undesirable compounds (acids, aldehydes, etc.) into desirable ones (hydrocarbons). This can be achieved by the upgrading of biomass fast pyrolysis vapors. The upgrading process is usually carried out in the presence of a catalyst, which allows one to increase the yield of less oxygenated compounds.
The literature data show that among the most popular catalysts used in this process are zeolites and mesoporous materials [8–10]; however the studies concerning the application of metal oxides have also been presented [11]. It appears that the introduction of nickel onto their surface results in a further increase in the yield of hydrocarbons [12]. Lu et al. [13] compared in their studies the surface properties of mesoporous supports (i.e. MCM-41 or SBA-15) with TiO2, ZrO2 and TiO2–ZrO2 oxides. They reported that the second group of materials possessed better hydrothermal stability, and their lower production cost makes them more suitable to be applied as supports for catalysts of the upgrading of biomass pyrolysis vapors. Therefore, in the next step of those investigations, two noble metals – ruthenium and palladium – were introduced on their surface using the impregnation method. In order to achieve a better dispersion of the metals, the supports were firstly impregnated by cerium nitrate and calcined in air as the presence of cerium oxide is believed to promote the metal dispersion on the catalyst's surface. The obtained results revealed that such catalysts can significantly reduce the amount of acids, phenols and sugars, simultaneously increasing the content of hydrocarbons, linear ketones, and cyclopentanones. The advantages of cerium oxide used as a catalyst support are not only associated with the ability to stabilize metal dispersion, but also to enhance oxygen storage/transport in the structure of the catalyst and to improve the oxidation and reduction of the introduced metal [14]. Cerium oxide was successfully applied as a catalyst support in many industrial processes, such as methane reforming [15] or water–gas shift reaction [16], among others. It has been however reported that the surface properties of CeO2 may be strongly influenced by thermal treatment. One of the methods for improving its thermal stability and redox properties is the addition of zirconium oxide.
Taking this into account, we decided to apply CeO2–ZrO2 as a support of the catalysts for biomass fast pyrolysis vapors upgrading. Due to its promising catalytic performance and relatively low cost, nickel was used as the active metal. Similar materials consisting of Ni introduced on CeO2–ZrO2 surface have been earlier applied in the steam reforming of ethanol and bio-oil, reforming of methane and gasification of model tar (benzene, toluene), among other processes [17–22]. In our work, the influence of the composition of the Ni catalyst support on the distribution of the products arising in the upgrading process of biomass fast pyrolysis vapors has been investigated. Commercial cellulose was applied as a reference material. The activity of the catalysts was evaluated by analytical pyrolysis gas chromatography/mass spectrometry (Py-GC/MS). The surface properties of the synthesized catalysts were also characterized.
2 Experimental
2.1 Preparation of the catalyst
Zirconium oxide was prepared from ZrOCl2 (Sigma-Aldrich, pure for analysis (≥ 99.5%)) by precipitation with NaOH followed by calcination at 700 °C in air. First, 200 mL of 0.4 M ZrOCl2 were added dropwise to 60 mL of 5 M NaOH (StanLab, pure for analysis). Then the mixture was heated to 104 °C and stirred for 24 h. The precipitate was filtered on a Büchner funnel and washed with a 0.05 M solution of NH4NO3 (Chempur, pure (min. 99%)) and then with water until a neutral pH is obtained. It was then dried in air at 110 °C overnight and calcined in air at 700 °C for 3 h. In the case of a monoxide support consisting of cerium oxide, the commercial material (Sigma-Aldrich, 99.9%) was used as delivered.
The 15% CeO2–ZrO2 support was prepared by the impregnation of ZrO2 obtained as described above with an aqueous solution of Ce(NO3)3 (Sigma-Aldrich). The mixture was left for 24 h and then evaporated. The resulting powder was dried at 120 °C for 2 h. Then it was calcined at 500 °C for 4 h.
The 20% Ni catalysts were prepared by the impregnation method. Nickel was introduced from Ni(NO3)2·6H2O (Chempur, pure) on CeO2, ZrO2 and CeO2–ZrO2 surfaces. The samples were aged for 24 h at room temperature. After water evaporation, the catalysts were dried at 110 °С for 2 h, then calcined in an О2 flow at 500 °С for 4 h.
2.2 Characterization of the catalyst
The surface area measurements were carried out on an ASAP2010 Micromeritics device using N2 as an adsorbent at −196 °C, with prior outgassing at 200 °C for 3 h in order to desorb the impurities or the moisture. The Brunauer–Emmett–Teller (BET) specific surface area was calculated from the N2 adsorption isotherm.
The acidity of the measured samples was determined by temperature-programmed desorption of ammonia (TPD-NH3). Prior to the measurements, each sample was heated at 500 °С for 1 h under an argon atmosphere. After cooling the samples to 100 °С, the adsorption of ammonia was performed for 15 min. Afterwards, flushing of the samples with argon was carried out for 15 min. The measurement was performed by heating the samples to 500 °С with a ramp of 27 °С·min−1 and registering the amount of desorbed ammonia using a thermal conductivity detector (TCD).
Temperature-programmed reduction (TPR) was performed on an AMI1 system (Altamira Instruments) equipped with a thermal conductivity detector and used for examining the reducibility of the catalysts calcined at 500 °C. In the experiments, a mixture of 5 vol.% H2 and 95 vol.% Ar was used at the space velocity of 3.1 × 10⁻⁹g·s−1·cm−3 and a linear temperature ramp of 10 °C·min−1.
Powder X-ray diffractograms (XRD) were collected using a PANalyticalX’Pert Pro MPD diffractometer. The X-ray source was a copper long fine focus X-ray diffraction tube operating at 40 kV and 30 mA. The data were collected in the 5–90° 2Θ range with a 0.0167° step. Crystalline phases were identified by reference to ICDD PDF-2 (ver. 2004) database. All calculations were performed with X’Pert HighScorePlus computer program.
X-ray photoelectron spectroscopy (XPS) surface analysis of the investigated catalysts was performed on Kratos AXIS 165 spectrometer using the Al mono Kα radiation. The samples were fixed onto the sample holder by a double-sided adhesive tape.
A transmission electron microscope (TEM) – JEM-2100F, JEOL – was used for imaging the surface of different catalysts. Prior to TEM analysis, all samples were reduced for 1 h at 500 °C under a hydrogen flow.
2.3 Upgrading of pyrolysis vapors
All reactions were performed using a CDS Analytical 5200 pyroprobe containing two separate reactors. In the first of them, the pyrolysis of α-cellulose (1 mg (± 0.01 mg), Sigma-Aldrich, pure) was executed in the temperature range from 400 to 600 °C. In the second one, 5 mg of the catalyst were placed. The temperature of the reactor with the catalyst was maintained at 600 °C. This temperature was set on the basis of preliminary measurements, which showed that in such conditions the production of oxygenates (especially acids) was limited. Due to the large amount of catalyst compared to biomass, a high gas hourly space velocity (GHSV) was used during the experiments to allow a clearer distinction to be made between the activities of the studied catalysts. The GHSV was estimated to be about 240,000 h−1. Prior to the pyrolysis experiments, the catalysts were reduced in situ at 400 °C under a hydrogen flow of 40 cm3 min−1 for 2 h. The pyrolysis process was conducted under a helium flow. The heating rate of the pyrolysis reactor was 2 °C−1ms. The set temperature was maintained for 20 s. The use of a small cellulose sample size allowed one to minimize the temperature lag during the experiment. After pyrolysis, the vapors passed through the catalyst reactor. All product vapors were then trapped on a Tenax adsorption column (held at 30 °C). Following vapor entrapment, the adsorption column was rapidly heated to 280 °C in order to desorb the vapors. These were passed directly to the GC/MS (Agilent GC 7890A and Agilent MS 5975 C). The injector temperature was kept at 280 °C. The chromatographic separation was carried out using a RTX-5MS capillary column. Helium (CP grade) was used as the carrier gas with a flow rate of 15 cm3 min−1 and a 1:50 split ratio. The oven temperature was programmed from 30 °C (10 min hold time) to 280 °C at the heating rate of 5 °C min−1 and the final hold time of 10 min. The temperature of the GC/MS interface was held at 250 °C. The mass spectrometer was operated in EI mode at 70 eV. The mass spectra were obtained for m/z 40 to 400 with a scan rate of 500 amu/s. The experiments were repeated no more than twice in order to verify the reproducibility of the obtained results. The identification of chromatographic peaks was performed according to the NIST MS library, and in cases where low probabilities were indicated by the library, the identification was made on the basis of the previous investigations. In spite of the use of the library mentioned above, a small part of the chromatographic peaks remained unidentified. Moreover, some compounds cannot be ascribed to any of the categories presented in the figures (i.e. inorganic, sulfur- or nitrogen-containing molecules). Therefore, the total peak area percentage values may be not equal to 100%.
3 Results and discussion
3.1 Characterization of the catalysts
Table 1 presents the results of the surface characterization of 20%Ni/CeO2, 20%Ni/ZrO2 and 20%Ni/15%CeO2–ZrO2 catalysts. The obtained data demonstrated that the surface area of Ni supported on cerium oxide is very low and takes a value of about 3 m2 g−1, while in the case of 20%Ni/ZrO2 and 20%Ni/15%CeO2–ZrO2 samples, a surface area slightly below 120 m2 g−1 was noticed. This indicates that ZrO2 permits to maintain a higher surface area of the catalyst after the introduction of 15 w/w% of CeO2 on its surface. The surface acidity measurements showed that the lowest amount of NH3 was adsorbed on the 20%Ni/CeO2 surface. The highest acidity was observed for 20%Ni/ZrO2 samples. The addition of cerium oxide to ZrO2 has been found to decrease the acidity of the catalyst. However, in the case of a mixed CeO2–ZrO2 support, the adsorption of NH3 is more similar to the case of the 20%Ni/ZrO2 catalyst than that of the 20%Ni/CeO2 sample. The analysis of the NiO crystallite size evaluated on the basis of XRD measurements showed that the largest particles are present on the surface of the 20%Ni/CeO2 catalyst possessing the lowest surface area. For 20%Ni/ZrO2 and 20%Ni/CeO2–ZrO2 catalysts, the NiO crystallite size was very similar and about two times smaller than in the case of 20%Ni/CeO2.
Physicochemical properties of the investigated catalysts.
| Surface area (m2 g−1) | Acidity (mmol NH3 g−1) | NiO crystallite size (XRD) (nm) | |
| 20%Ni/CeO2 | 3 | 184 | 56 |
| 20%Ni/ZrO2 | 119 | 644 | 27 |
| 20%Ni/15%CeO2–ZrO2 | 117 | 560 | 26 |
Temperature-programmed reduction profiles obtained for 20%Ni/CeO2, 20%Ni/ZrO2 and 20%Ni/CeO2–ZrO2 catalysts demonstrate the differences in the reduction behavior of the NiO phase supported on various metal oxides (Fig. 1). Although in all cases only one main reduction peak was observed, the reduction process proceeded at different temperatures for cerium oxide alone and zirconium-oxide-containing samples. In the first case, the reduction process started at about 200 °C and finished below 350 °C with the maximum of the reduction rate at about 300 °C. For 20%Ni/ZrO2 and 20%Ni/CeO2–ZrO2 catalysts, the NiO reduction began from 170 °C, reaching its maximum rate at about 320 °C and 300 °C for mono- and bi-oxide samples, respectively. The reduction proceeded up to 600 °C and the small reduction peak between 500 °C and 600 °C was also observed. Those results indicate that in the case of 20%Ni/ZrO2 and 20%Ni/CeO2–ZrO2 catalysts, smaller NiO crystallites are less susceptible to reduction than nickel oxide particles present on the CeO2 surface, probably due to a slightly stronger interaction with the surface of the support.

Temperature programmed reduction profiles of the investigated catalysts.
The results of X-ray diffraction measurements are displayed in Fig. 2. For all catalysts, X-ray diffractograms revealed the presence of signals at 2Θ values of 37.47°, 43.37° and 62.95°, which were ascribed to the NiO phase. Moreover, characteristic patterns of cerium oxide and zirconium oxide used as supports were observed for appropriate samples. No mixed CeO2–ZrO2 phase was detected in the case of the 20%Ni/15%CeO2–ZrO2 catalyst.
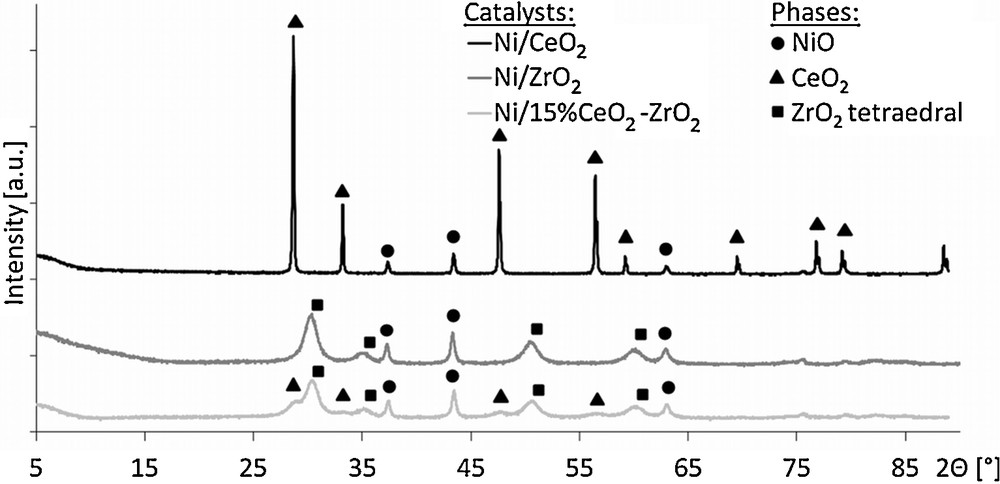
X-ray diffraction measurements of the investigated catalysts.
X-ray photoelectron spectroscopy measurements (Table 2) confirmed the presence of nickel in the +2 oxidation state. The principal peak at ∼ 854 eV and the satellite peak or the shoulder of Ni 2p3/2 at the chemical shift of ∼ 1.9 eV is characteristic of NiO. The values of the O 1s binding energies in the range of 529.6–530.9 eV correspond to the presence of oxygen in NiO and ZrO2 or CeO2, respectively. The Zr 3d spectra of Ni/ZrO2 and Ni/15%CeO2–ZrO2 catalysts are similar to each other and indicate the presence of a pure zirconium oxide phase [14]. The values of Ce 3d binding energies (898.4 and 901.0 eV) confirm the presence of cerium in the +4 oxidation state [23]. Moreover, the decrease in the Zr/Ni atomic ratio observed in the case of the 20%Ni/CeO2–ZrO2 catalyst may be related to an unequal distribution of NiO crystallites on the surface of both oxides or only partial covering of zirconium oxide surface by cerium oxide. TEM images (Fig. 3) showed that the 20%Ni/15%CeO2–ZrO2 catalyst consists of particles with different sizes and shapes with non-homogenously distributed NiO crystallites.
Results of XPS analysis of 20%Ni/ZrO2 and 20%Ni/CeO2–ZrO2 catalysts.
| Binding energy [eV] | Catalyst | |
| 20%Ni/ZrO2 | 20%Ni/CeO2–ZrO2 | |
| Ni 2p | 584.0 | 583.8 |
| 855.9 | 855.7 | |
| O 1s | 529.7 | 529.6 |
| 530.9 | 530.7 | |
| Zr 3d | 182.3 | 182.2 |
| 184.7 | 184.6 | |
| Ce 3d | – | 898.4 |
| 901.0 | ||
| Zr/Ni | 0.6 | 0.4 |
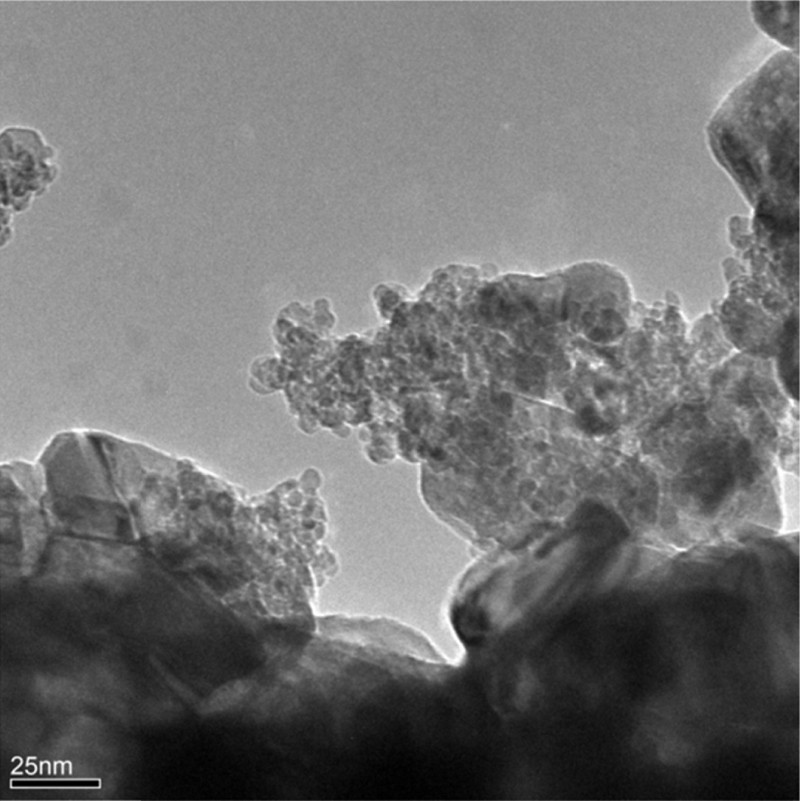
Exemplary TEM image of 20%Ni/15%CeO2–ZrO2 catalyst.
3.2 Effect of the composition of the catalysts on the product distribution in pyrolysis vapor upgrading
The earlier studies revealed that Py-GC/MS can be successfully applied as an analytical tool in the investigations of the product distribution in pyrolysis vapor upgrading [24]. However, it is known that this technique does not allow collecting the reaction products; therefore, it is not possible to obtain a mass balance. The analysis of the obtained results involves a comparison of the changes of the areas of chromatographic peaks corresponding to the presence of particular compounds that are considered linear with the change of the quantities of products. Due to the complexity of the mixture of products obtained in the aforementioned process, the identified compounds were divided into several groups consisting of olefins, paraffins, aromatics, cyclics, ketones, acids, aldehydes, alcohols, sugars, and esters. A similar division was observed in other works [25,26]. This should help tracking the differences in the yield of the upgrading process depending on the type of used catalysts. The upgrading and pyrolysis conditions were chosen on the basis of the preliminary studies and literature data and are a compromise between the yield of liquid phase and the amount of undesirable products. The preliminary results showed that in spite of the similar relative content of hydrocarbons at 500 °C and 600 °C, a decrease in the percentage of organic acids (which was the smallest at 600 °C) with the increase in the reaction temperature was observed. Therefore, for further measurements, a temperature of 600 °C was chosen. Similar pyrolysis conditions were also applied by Melligan et al. and Gu et al. [12,27].
The results of the activity measurements are presented in Fig. 4. In the case of the 20%Ni/CeO2 catalyst, the formation of relatively large amounts of olefins and paraffins in comparison to other samples was observed, while the content of aromatics was at most an average. The analysis of the quantity of other products indicated that an application of that catalyst gives the highest carboxylic acids yield, which reduces the value of the obtained bio-oil. In contrast, the use of 20%Ni/ZrO2 allowed us to obtain the largest aromatic fraction with some amount of paraffins, whereas the content of olefins was very limited and the amount of the carboxylic acids fraction was considerably decreased. The investigations concerning the 20%Ni/15%CeO2–ZrO2 catalyst revealed that the distribution of products obtained in this case is more similar to that observed for 20%Ni/CeO2 than for 20%Ni/ZrO2. Both catalysts containing cerium oxide give a larger amount of olefins and paraffins. Their content is even slightly higher for the Ni/CeO2–ZrO2 sample. The use of 20%Ni/15%CeO2–ZrO2 also decreases the amount of carboxylic acids, with a very limited formation of the aromatic fraction as well.
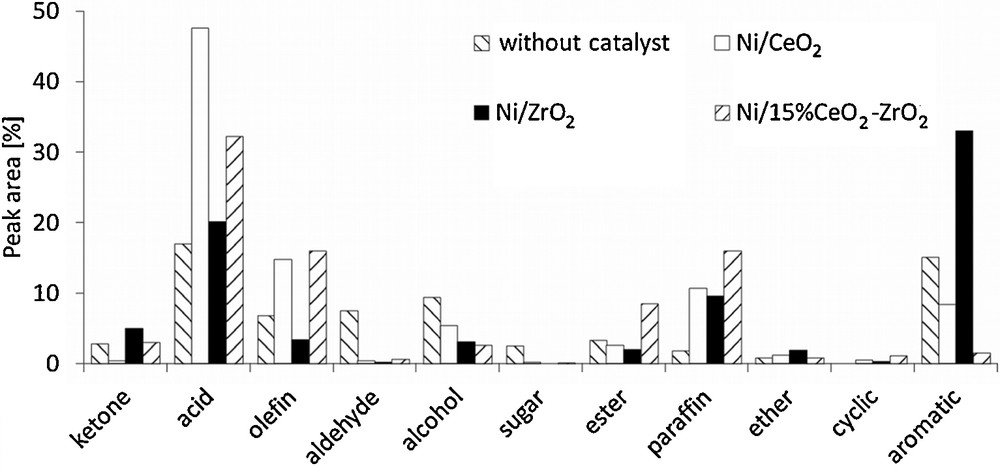
Cellulose fast pyrolysis (600 °C) vapor product distribution.
The analysis of other possible compounds revealed that they are not produced in a significant scale, although several differences can be observed. The use of 20%Ni/CeO2 results in the formation of a slightly larger amount of alcohols, while an application of Ni/CeO2–ZrO2 catalyst leads a higher content of esters. Differences in the behaviors of the investigated catalysts are associated with their different physicochemical properties, leading to favor one of the possible reaction paths for the upgrading of cellulose fast pyrolysis vapors. Generally, the upgrading process involves several reactions, such as decarbonylation, decarboxylation, direct deoxygenation, dealkoxylation, cracking, hydrocracking, hydrogenation, dealkylation, methyl transfer, and hydrodeoxygenation [28]. The composition of the reaction products obtained for 20%Ni/CeO2 suggests that in this case, cracking, hydrocracking and hydrogenation are rather favored. These reactions lead to the formation of olefins, which can be subsequently hydrogenated to paraffins. At the same time, the production of some amounts of alcohols can be also observed [29]. However, olefins may be also produced via the decarbonylation of oxygenated intermediates [30]. Oxygen removal via cracking reactions gives carbon dioxide, which passes to the gaseous phase. In the case of hydrodeoxygenation, oxygen is eliminated as water and the formation of paraffins is more probable. These reaction paths lead to the reduction of the content of aromatics in the upgraded mixture. On the other hand, Stephanidis et al. [31] have found that dehydration, decarboxylation and decarbonylation usually promote the formation of a larger amount of aromatic fraction. These reactions are favored by the presence of Brønsted acid sites on the surface of the catalyst, but metal crystallites and hydrogen radicals also play a role in this process. Moreover, Wang et al. [30] showed that the presence of H-ZSM5 catalyst promoted rather decarbonylation than decarboxylation. The analysis of the distribution of reaction products indicates that the aforementioned reaction mechanism may be favored in the presence of 20%Ni/ZrO2. The comparison of the fast pyrolysis vapors upgrading products obtained for 20%Ni/15%CeO2–ZrO2 demonstrates that they are more similar to those obtained in the case of 20%Ni/CeO2. It indicates that the presence of cerium oxide plays a significant role, taking into account the reaction course, although the surface properties of 20%Ni/15%CeO2–ZrO2 (surface area, acidity, NiO reducibility and crystallite size) are rather comparable to those of 20%Ni/ZrO2 catalyst. However, the presence of zirconium oxide slightly increases the amount of olefins and paraffins, and noticeably decreases the content of carboxylic acids.
Fig. 5 shows the reaction scheme of cellulose fast pyrolysis leading to the formation of aromatics. As mentioned earlier, aromatic compounds are formed through a series of dehydration, decarbonylation, decarboxylation, oligomerization, and dehydrogenation reactions. According to Jae et al. [32], the major reaction competing with the production of aromatics is coke formation on the catalyst's surface. Taking this into account, it is supposed that a more active catalyst towards the production of aromatic compounds should be more coke resistant. The results of the studies carried out by Ardiyanti et al. confirm this hypothesis [33]. The comparison of the coke deposition rate on bimetallic Ni–Cu catalysts supported on ZrO2 and CeO2–ZrO2 used in the catalytic hydrotreatment of fast pyrolysis oil revealed that the sample containing only zirconia was considerably more coke resistant than the catalyst consisting of bi-oxide support. Due to that, in the first case a larger amount of active sites was accessible for the reactants and more pyrolysis intermediates could be converted into aromatics. The authors of the mentioned paper noted also that carbon deposition on CeO2 favors cerium and nickel leaching from the surface of the studied catalysts, which resulted in a further drop of the catalyst's activity. In our case, the determination of the coking rate was impossible due to the application of a very small amount of catalysts in the Py-GC/MS experiments (additionally the catalyst was mixed with the glass wool). However, it seems that in the upgrading of cellulose fast pyrolysis vapors, the same factors determine the kind and amount of the obtained products.
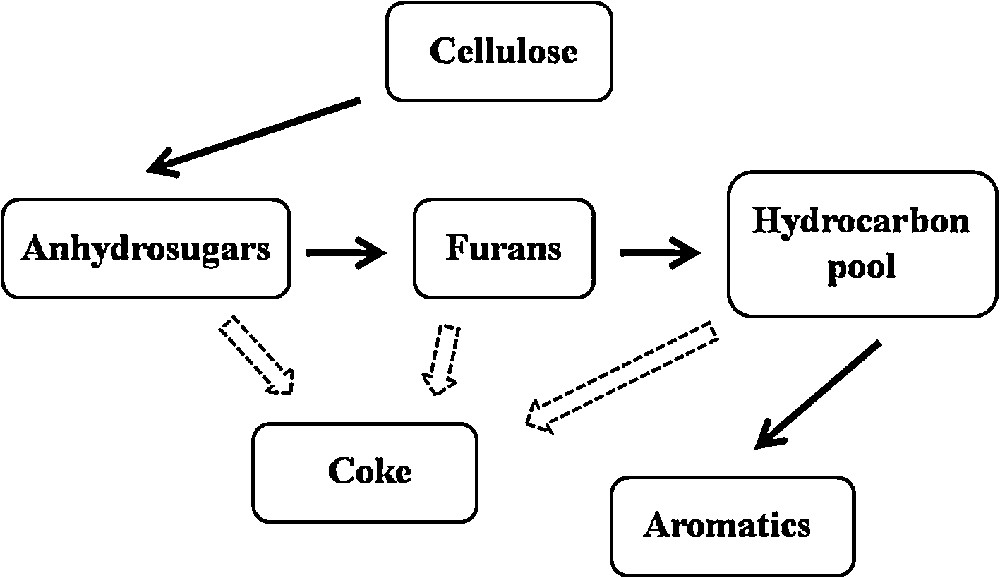
Formation of aromatics in fast pyrolysis of cellulose.
4 Conclusions
The studies of the catalytic performance of Ni supported on CeO2, ZrO2 and CeO2–ZrO2 in the upgrading of cellulose fast pyrolysis vapors demonstrated that owing to the use of the catalyst, more valuable products can be obtained in comparison to the pyrolysis carried out without the upgrading step. For 20%Ni/15%CeO2–ZrO2 the formation of the highest content of olefin and paraffin fractions was observed, while in the case of 20%Ni/ZrO2 catalyst, the largest amount of aromatics was produced. The 20%Ni/CeO2 sample was characterized by the highest content of carboxylic acids, which could be noticeably reduced in the presence of zirconium oxide. Two different reaction paths were observed in the case of the catalyst containing CeO2 and without this oxide. It can be connected with the different coke resistances of the investigated catalysts. However, further investigations are required in order to fully understand an impact of the catalyst composition on the course of the occurring reactions.
Acknowledgement
The authors gratefully acknowledge that this work was financially supported by the National Science Center (Poland)–project No. 2011/03/B/ST5/03270.