

1 Introduction
Contaminant originated from vehicle engines (NOx, CO, HC) is a major source of urban air pollution. Honeycomb-shaped catalytic monolithic reactors with noble metal catalyst are standard devices used in the automotive industry as the flue gas afterburners. Their construction is a complex function of the exhaust stream characteristics, including monolith geometry and catalyst characteristics. Mass transport from the bulk gas to the catalyst wash coated surface, and then inside the porous catalyst layer, as well as reaction rate limit the conversion of any reactive species (NOx, CO, HC). Due to restricted emission requirements, catalytic converter designs need to be improved to achieve better conversion efficiency.
As described in [1–5], placement of very small and short catalytic converter (of about 0.025–0.045 L) before turbocharger provides 50–70% of the total conversion of exhaust gases. It is required that this pre-turbo catalyst (PTC) should work at gas velocities up to 100 m/s. Modified automobile catalytic systems should consist of two converters: (1) shorter just behind the cylinders outlet and (2) standard (see Fig. 1).
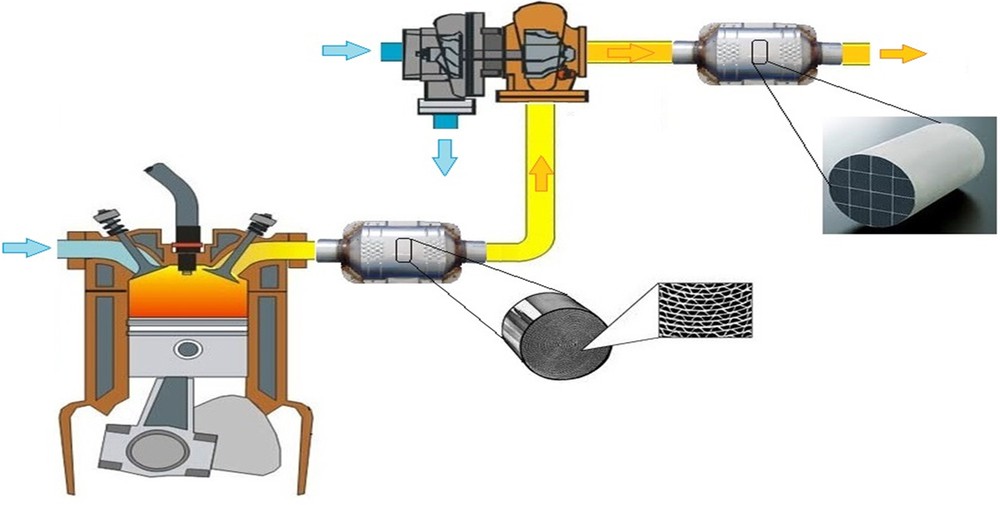
(Color online.) Modified automobile catalytic system with pre-turbo converter.
Typical automobile catalytic converter includes ceramic monolith having cell densities of 400–900 cells/in2 and length of about 200 mm, thus the fully developed laminar flow exists in the major part of long channels [6,7]. For relatively fresh, fully warm, oxidizing catalysts, the rates of reaction of NOx, CO and HC are limited primarily by convective mass transport through the developing laminar boundary layers in the monolith channels. Mass and heat transfer rates are higher in the entrance regions of these channels than in the fully developed regions in the remaining part of long channels. Consequently, segmenting, or repeatedly slicing, the substrate normal to the flow direction, and separating the pieces improves conversion performance by exploiting the enhanced transport coefficients in the entrance regions.
Due to its position, the PTC has some advantages. Firstly, the pre-turbine catalyst required a shorter period of engine work to reach the light-off temperature of the catalytic reaction [5]. When comparing the temperature profile along the exhaust line, temperatures in the front of the turbocharger amount to 500–600 °C and are higher of about 100–150 °C than behind the turbocharger [8]. Moreover, in the PTC very high flow speed is reached, which leads to turbulent flow pattern in the converter channels. This results in a significantly increased mass transfer between exhaust gas and channel walls [2]. Another benefit is limited fuel consumption due to a reduction of the pressure drop [8,9]. The most important effect of additional afterburner before the turbocharger is a significant decrease of the HC and CO emissions [2–4].
2 Experiments
In our previous work [10], the experimental studies are described in details. The short channel structures of triangular and sinusoidal cross-sectional shapes and of 5 mm length were placed in a test reactor of rectangular cross-section, 20 × 35 mm. Strong electric current flowed through the structure to perform heat transfer. Thermocouples measured the temperatures of structure surface and the gas stream. The pressure drop was measured using the Recknagel micromanometer. The superficial velocity applied during the experimental study covered the range of u0 = 0.3–51.5 m/s, which corresponds to the range of Reynolds numbers Re = 39–6810. During experimental investigations, the reactor filling (short channel structure) was comprised of several channels. The numerical analyzes concerned only a single channel, because every channel within the short channel structure behaves essentially alike.
3 Analysis
The three-dimensional approach was used to simulate the fluid flow and heat transfer in the channel. The physical models are shown in Fig. 2. Only a single channel was modeled using the CFD software because of limited computer yield. The simulations were performed using FLUENT code. Detailed description of numerical analysis is included in our previous work [11]. Uniform heat flux (q = 0.96–36.2 kW/m2) was assumed on the channel walls. Uniform inlet velocity and temperature profiles were specified in the control region, as well as at the channel inlet for defining simultaneously developing flow conditions. The inlet temperature ranges from 20 to 75 °C. A pressure outlet boundary condition was set at the outlet. The assumed solid material and fluid are Kanthal steel and air, respectively. The following assumptions were made when modelling fluid flow and heat transfer characteristics in triangular and sinusoidal cross-sectional channels:
- • the flow is laminar and steady;
- • the fluid properties are temperature dependent, solid properties are constant, fluid is incompressible;
- • the heat loss, radiative and gravitational effects are negligible.
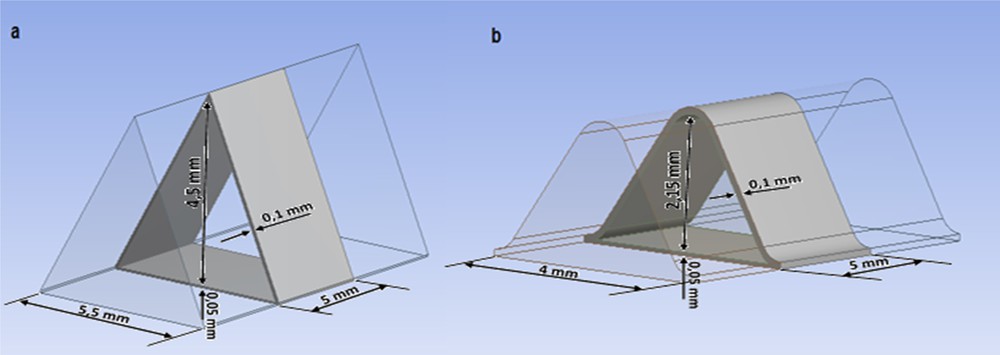
Three-dimensional geometry of micro-channels. a: triangular; b: sinusoidal.
The local convective heat transfer coefficients and temperature distributions were predicted by numerical simulations for specified flow velocity and heat flux. The heat transfer performance was evaluated using the average Nusselt number defined as:
| (1) |
The Reynolds number was calculated based on the following expression:
| (2) |
The friction factor is defined as:
| (3) |
4 Results and discussion
Figs. 3 and 4 show the temperature distribution in sinusoidal and triangular channels, respectively, for (the arbitrary selected) gas velocities and heat fluxes on the channel wall. Control cross-sections are marked as t1–t3. The physically existing heated channel is situated between sections t1–t2. The values of initial velocity and temperature, Reynolds number and heat flux are given in the figure descriptions.
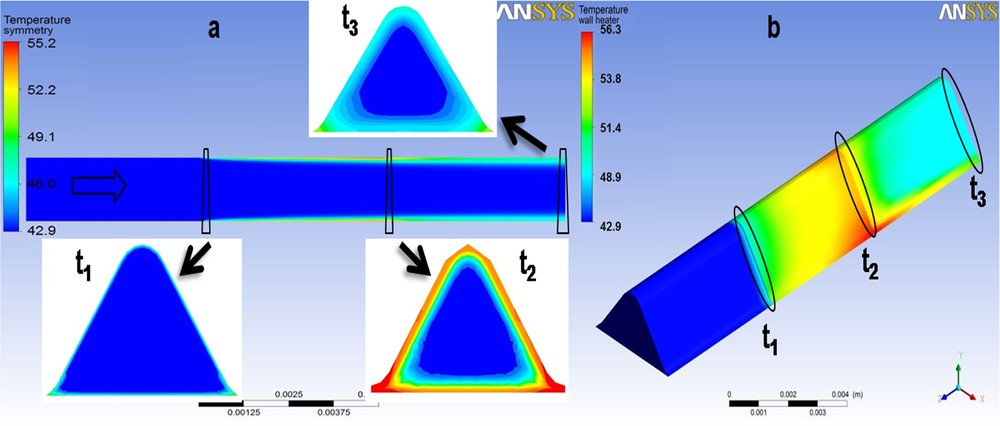
(Color online.) Temperature distribution in °C in the sinusoidal channel (u0 = 44.5 m/s; t0 = 42.9 °C; q = 18.4 kW/m2). a: in the air stream; b: on the heated wall.
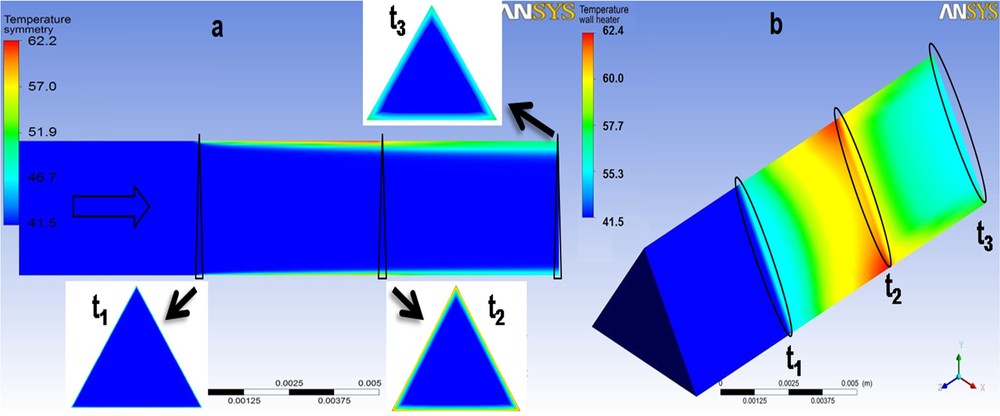
(Color online.) Temperature distribution in °C in a triangular channel (u0 = 37.1 m/s; t0 = 41.5 °C; q = 19.8 kW/m2). a: in the air stream; b: on the heated wall.
Before the channel inlet, the air temperature is constant and corresponds to the initial temperature introduced to the program. During flow through the channel, heat transfer occurs between the flowing air and the heated channel wall. Behind the channel outlet, the air temperature starts to achieve the so-called mixing cup temperature.
The cross-sections marked as t2 and t3 in Figs. 3a and 4a shows that the largest temperature gradient appears in the middle section of a wall and the highest air temperature is within the vertices (curvatures). As judging from the air temperature distribution for both channel cross-sectional shapes (middle graph in Figs. 3a and 4a), the behaviors of both channels studied are similar. The differences in the temperature distribution are small, hardly visible in the figures because of the different scale of the channels. When considering section marked as t1–t2 (where the heated channel physically exists), it is noticeable that the flow develops thermally. Thermal laminar boundary layer (near to the inner channel surface) is thicker near to the channel outlet than at channel inlet. Moreover, the heated walls in Figs. 3b and 4b show that the temperature increases from the channel entrance towards exit, although the heat flux on the walls was constant. The ratio of the channel wall surface area to the cross-section is twice as high for the sinusoidal channel when comparing to the triangular one. Due to the difference, the air stream reaches higher temperature in the sinusoidal structure than in the triangular ones, for similar heat flux on the channel wall. The temperature distribution in section t3 (Figs. 3a and 4a) shows a gas stream mixing effect leading to temperature equalization. The shape of triangular channel is very close to that of the sinusoidal ones, especially when the vertices of the triangle are rounded. When specific surface areas of triangular and sinusoidal channels are similar, the results might be really close.
Figs. 5 and 6 show the pressure distribution in sinusoidal and triangular channels, respectively (control sections are marked as p1–p4). The physically existing channel is situated between p3 and p4 (channel wall is shown as thick black line). The values of initial velocity, temperature and Reynolds number are given in the figure captions.
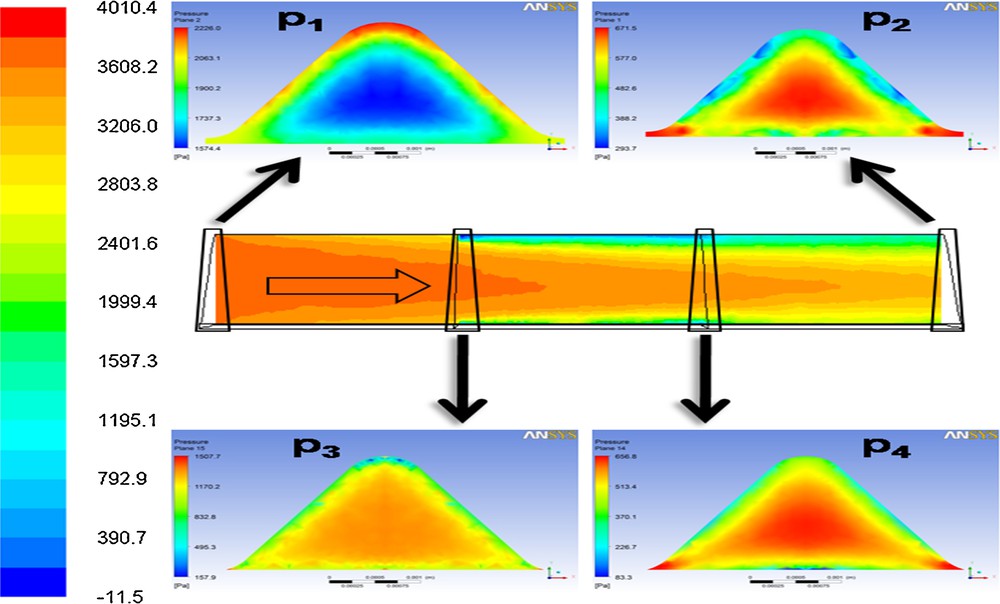
(Color online.) Pressure distribution in Pa in the air stream in the sinusoidal channel (u0 = 51.5 m/s; t = 66.0 °; Re = 4198.5). Warning: the pressure scales for cross-sections, marked as p1–p4, are different from those in the main (middle) picture.
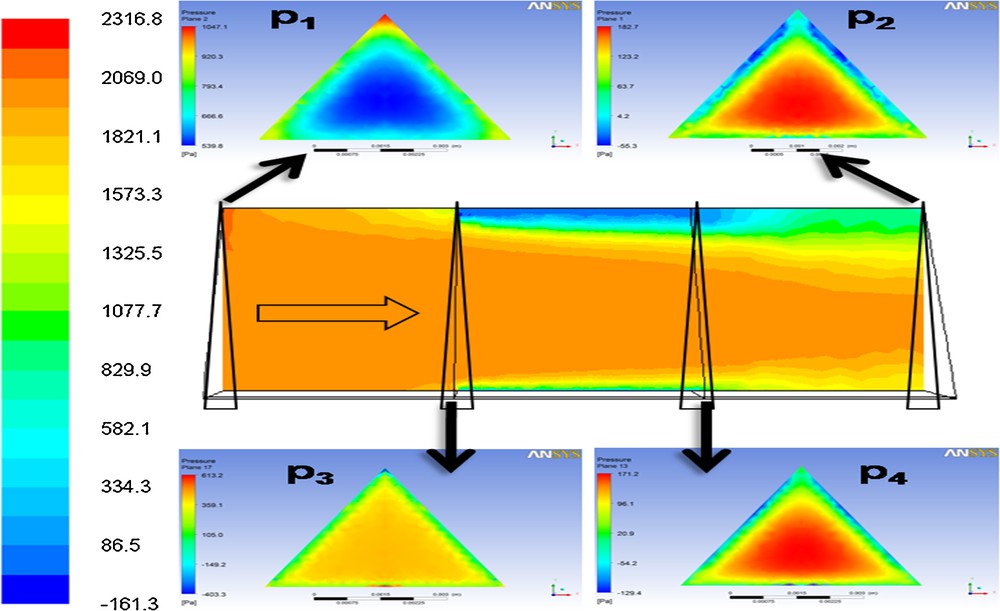
(Color online.) Pressure distribution in Pa in the air stream in the triangular channel (u0 = 47.9 m/s; t = 75.0 °C; Re = 6810.6). Caution: pressure scales for cross-sections, marked as p1–p4, are different from the main (middle) picture.
The cross-section, marked as p1 (before the channel inlet) shows that the pressure is higher at the wall edges due to the drag forces. Cross-sections marked as p2–p4 indicate that the highest pressure occurs in the core and the vertices (curvatures) of the cross-section, while the lowest pressure is near the channel walls. The pressure distributions, shown in the middle of Figs. 5 and 6, demonstrate that the pressure is much higher for the sinusoidal channel than for a triangular one (note the pressure color scales are different for both channels, much higher is for the sinusoidal one).
The comparison of the experimental and numerical results, in terms of the Nusselt number and Fanning friction factor versus Reynolds number, is presented in Fig. 7 for both triangular and sinusoidal channels. The heat transfer coefficients, thus Nusselt numbers, were calculated by reading the average temperature of the air stream within control cross-sections t1 and t2 (Figs. 3a and 4a). The pressure drop, thus the Fanning factor, was calculated by reading the average value of pressure within cross-sections p1 and p2 in Figs. 5 and 6. This pressure difference p1–p2 includes both the pressure drop due to the viscous friction in the channel (laminar flow) and due to the inertial resistance of front edges of the channel wall (drag force).
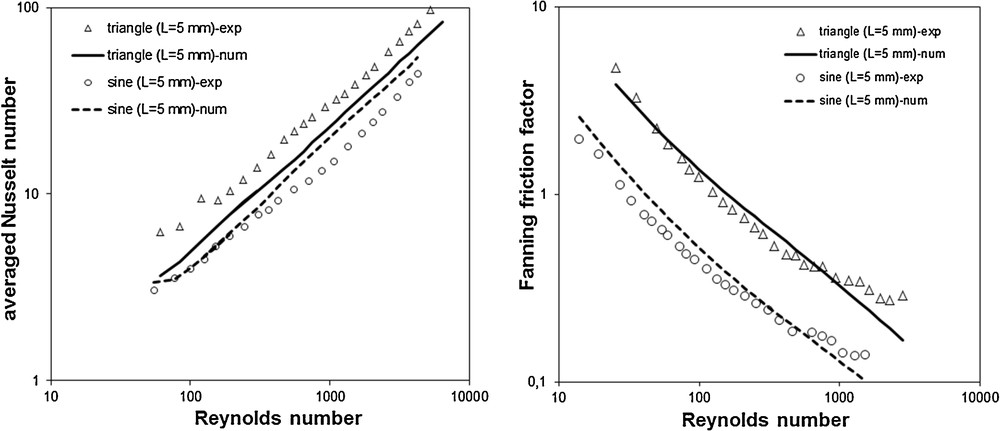
Comparison of experimental and numerical results of heat transfer (left-hand side) and flow resistance (right-hand side).
The heat transfer per inner channel surface area is more intense for the triangular channel than for the sinusoidal one. The last, however, displays higher specific surface area, thus larger wash coated catalyst loading. The comparison of Fanning factors shows that the flow resistance is higher for triangular channel than for sinusoidal one.
The comparison of experimental results obtained for the structure (consisted of several channels) and the numerical results obtained for single channel agreed satisfactorily. Thus, it is not necessary to analyze numerically the whole structure.
5 Conclusion
The CFD simulations were performed to analyze the heat transfer and flow resistance for short triangular and sinusoidal channels (5 mm long). The developing laminar flow was assumed to appear in the short channel. The temperature and pressure distributions indicate that triangular channel might be slightly more advantageous. However, comparison of the heat transfer coefficients and the pressure drop versus flow velocity is similar for the channels studied.
As the gas velocities studied achieved 50 m/s, thus the transition region (between the laminar and turbulent regime) was reached. In the case of typical temperatures of the engine flue gases (at least 500–600 °C), the maximum Reynolds numbers obtained in this study correspond to the velocity of 100 m/s, or even more.
The numerical results have proven that short channels can be applied as the PTC for combustion of vehicle exhaust gases due to the favorable flow resistance and intense heat/mass transport. In order to verify the enhanced conversion efficiency in modified automobile catalytic system, the mass transfer and catalytic reaction analysis will be performed by numerical simulation very soon.
Acknowledgements
This study was financially supported by the grant from the Polish National Science Center No. 2011/03/B/ST8/05455 and NN209119137 and by the EU structured funds from the Polish Science Foundation.