

1 Introduction
Vapour-liquid separation processes such as wine distillation can be done in batch or in a continuous manner and in both processes heat is used as the external separating agent. The concentration of the distilled product is considered as the most important variable in the produced spirit, so its prediction or correlation is of paramount importance in distillation simulation. In these processes, there are several substances that are present at very low concentrations, substances that are called “congeners”. Even though the concentrations of the congener compounds are of the order of part per million, 10−6 to 10−4 mg/L [1,2], they must be considered when modelling VLE data. Thermodynamic modelling is more difficult to handle for mixtures in which some components are present at such low concentrations [3]. The treatment of low-pressure vapour–liquid equilibrium data (VLE) in modelling and in consistency tests is commonly done using activity coefficient models, through the so-called Gamma–Phi (γ–ϕ) method. The equation of state method, known as Phi–Phi (ϕ–ϕ) method, has also been used by some authors [4]. In both methods, binary parameters are calculated from experimental isothermal VLE data [5].
Water + congener and ethanol + congener mixtures have been studied and presented in the literature. Also, phase equilibrium data are available in specialized handbooks and databases [6–8]. However, systems of interest in alcoholic distillation have been treated in a more limited manner. During the last years, we have analysed a number of binary and ternary mixtures containing water + congener, ethanol + congener and water + ethanol + congener. The authors have presented some studies on the modelling of these systems and have summarized the results in a general review paper [9,10].
Since accurate VLE data are required for the development and design of different separation processes such as alcoholic distillation, the thermodynamic consistency of phase equilibrium data becomes of especial importance for checking the accuracy of experimental data used in process design and simulation [11,12]. Thermodynamic consistency means that the data fulfil some rigorous thermodynamic equations within defined and acceptable limits of accuracy. Consistency test methods of experimental phase equilibrium data follow two main approaches:
- • consistency of binary or multicomponent VLE data using the Gibbs–Duhem equation;
- • consistency of binary VLE and heat of mixing data by the Gibbs–Helmholtz equation [13].
Some thermodynamic consistency tests for mixtures containing alcohols have been presented in the literature to validate new experimental data. Table 1 shows a selection of works on the thermodynamic consistency of alcoholic mixture data.
Some works on thermodynamic consistency of binary systems containing alcohols.
| Reference | Systems | Comments |
| [14] | Alcohol + hydrocarbon | Analysed VLE data for 36 binary systems. The method combined thermodynamic consistency tests, data correlation, comparison with enthalpy of mixing data, and comparison of VLE data for various mixtures |
| [12] | Alcohol + hydrocarbon | Evaluated data for 46 alcohol + hydrocarbon systems at low-pressures using the PAI test (Point, Area, Infinite dilution test). The PAI test is combined with the NRTL equation |
| [15] | Methanol + water, ethanol + water | Proposed a thermodynamic consistency test for binary constant temperature VLE data. The binary parameters involved in the activity coefficients equations are numerically optimized to satisfy the Gibbs–Duhem equation |
| [16] | Methanol + water, ethanol + water, ethanol + (methanol, 1-propanol, 2-propanol) | Investigated an empirical consistency test for binary constant temperature and for constant-pressure VLE data |
| [17] | Methanol + (methyacetate, ethanol, water), ethanol + water | Reported isobaric VLE data at 101.3 kPa for the binary mixtures. The experimental data were tested for thermodynamic consistency by means of the Wisniak method and were demonstrated to be consistent |
| [18] | Methyacetate + ethanol | Reported experimental data of the isobaric VLE for the mixture methyl acetate + ethanol at 0.3 and 0.7 MPa. The experimental data passed positively the consistency test of Van Ness |
2 Thermodynamic consistency
As described above, the thermodynamic model used in this work is the Peng–Robinson equation of state modified by Kwak and Mansoori, PR/KM [19,20]. This PR/KM model has been previously discussed in the literature and has demonstrated to have the adequate flexibility and accuracy for correlating VLE data and to provide appropriate representation of the experimental data, a requirement of the consistency test [21,22]. The model and the test employed to check the thermodynamic consistency of isothermal P–x–y equilibrium data have been previously described by the authors for other types of mixtures [23–27]. These authors have established certain requirements to define a good consistency criterion for analysing phase equilibrium data, which are summarized in the following section. To the best of the authors’ knowledge, the method has not been used to test P–x–y data of binary congener + ethanol mixtures, as done in this paper.
The different approaches presented in the literature not only use different equilibrium data, but also different thermodynamic functions that are calculated either directly, using experimental data, or indirectly, including different thermodynamic models. As explained in previous papers, the consistency method proposed by the authors is model-dependent; this means that the method requires a thermodynamic model that can accurately fit the experimental data to the consistency test. The equation of state method is used in this work for phase equilibrium correlation and the cubic equation of state proposed by Peng and Robinson [19] is the chosen model.
Kwak and Mansoori [20] presented a different attractive approach for interpreting the mixing and combining rules for cubic equations of state (EoS) of van der Waals type. According to the authors, their proposal is consistent with the statistical-mechanical theory of the van der Waals mixing rules. Also, it is based on statistical-mechanical arguments and on the fact that rules are for constants of an equation of state and not for any thermodynamic state function, such as the α(T) function commonly used in the attractive pressure term of van der Waals EoS. The approach of Kwak and Mansoori considers rewriting the Peng–Robinson expression so that the transformed equation of state contains three temperature-independent parameters (cm, bm, and dm). The three EoS parameters are expressed using the classical van der Waals mixing rules, each one including one adjustable parameter.
The Peng–Robinson model belongs to the so-called van der Waals type equations of state, and can be written as follows [19]:
| (1) |
In this equation, a is a function of the reduced temperature (TR = T/Tc) and b is a parameter determined using the critical properties of the substance of interest:
| (2) |
For mixtures, the PR equation is written as follows:
| (3) |
In this equation, am and bm are the equation of state parameters for the mixture, to be calculated using defined mixing rules.
The PR/KM model
The modified EoS proposed by Kwak and Mansoori that has been designated as PR/KM is:
| (4) |
with
| (5) |
For mixtures, the modified PR/KM equation is:
| (6) |
and the mixing and combining rules proposed by Kwak and Mansoori are:
| (7) |
In these equations, xi is the mole fraction of component i in the liquid or gas phase. As seen in eq. (7), the PR/KM model contains up to three adjustable parameters (kij, βij, δij), one for each of the constants, and they are assumed to be the same for both phases, liquid and gas. Usually the parameter that most affect the accuracy of the model is kij, the interaction parameter for c in the PR/KM model, and several mixtures can be modelled with βij = δij = 0 [4]. Additionally, the model requires the critical properties (Tc and Pc) and the acentric factor (ω) for each of the components in the mixture.
The accuracy of the model for correlating the experimental VLE data is determined by calculating the relative deviation in the correlated pressure (%ΔP), the absolute deviation in the correlated pressure (|%ΔP|), and the relative deviation in the correlated mole fraction of the congener in the gas phase (%Δy1). These deviations are defined as follows:
| (8) |
| (9) |
| (10) |
The thermodynamic consistency test can be applied if these deviations are within pre-established ranges. Once the modelling of the VLE data is accepted, the Gibbs–Duhem equation is applied to check the thermodynamic consistency of the data. The equations that described the consistency test are shown in Table 2. This table summarizes the method explained with details elsewhere by the authors [24]. In eq. (A) of Table 2, xi is the concentration of component i in the liquid or gas phase. In eq. (B), φi is the fugacity coefficient of component i in the corresponding phase, HR is the residual enthalpy, VR is the residual volume, T is the absolute temperature, and P is the pressure of the system. The fugacity coefficient for the PR/KM model is given by eq. (D) in Table 2. As seen in the table, the final test is reduced to the calculation of two integral terms designated as AP and Aφ [eq. (E)].
Summary of the thermodynamic consistency test.
| A | Gibbs–Duhem equation in terms of residual properties: |
| B | In terms of fugacity coefficients: at constant temperature: |
| C | Arranging terms: |
| D | Fugacity coefficient for the PR/KM model: |
| E | Experimental and estimated areas: |
| F | Individual per cent area deviation in the range [−20% to + 20%]: Individual deviation in the system pressure in the range [−10% to + 10%]: |
Thus, if a set of data is considered to be consistent, AP should be equal to Aφ within acceptable defined deviations. To set the margins of errors, the individual relative per cent area deviation %ΔAi and the individual absolute per cent area deviation between experimental and calculated values are defined as:
| (11) |
| (12) |
In eq. (E), in Table 2, AP is determined using the experimental P–x data at fixed temperature, while a thermodynamic model (an equation of state) is employed to evaluate Aφ in eq. (E). If the data are adequately correlated, which means that the deviations in the calculated pressure (%ΔP) are within the established margins of error, and the individual area deviations %ΔAi in the consistency test are also within defined margins of errors, then the data set is considered to be consistent.
To evaluate the integrals given by eq. (E) in Table 2, the following must be defined:
- • an equation of state;
- • a set of mixing rules;
- • a set of combining rules.
In principle, any appropriate equation of state and any mixing and combining rules can be used to evaluate the pressure. This model is used for determining the fugacity coefficients φi and the compressibility factor Z. Once the model is defined and the optimum parameters are determined from the experimental P–T–x data, the area Aφ is calculated. For a set of N experimental data points at a fixed temperature, there are (N–1) values of the area AP and (N–1) values of the area Aφ must calculated [24].
To define the criteria for consistency and inconsistency, it is first required to check if the model is able to correlate the data within acceptable deviations. The model is accepted if the deviation defined by eq. (8) is within −10% to + 10% for %ΔP. After the model is found appropriate, it is required that the deviations in the individual areas defined by eq. (11) are all within the limits −20% to +20% to declare the data as being thermodynamically consistent. All these criteria that have been used by the authors for several years are summarized in Table 2 [23–26]. However, not only the criteria of deviations are considered for determining consistency or inconsistency, but also the distribution of such deviations. If some few points (up to 25% of the original points) do not pass the area test, but the rest of the data does pass the test, there is no reason to eliminate the whole set of data. So, the original set of data is declared to be not fully consistent (NFC). If more than 25% of the data do not pass the test, then the whole original set is declared to be thermodynamically inconsistent (TI).
3 Experimental data studied
The study considers data of eight binary congener + ethanol mixtures at pressures ranging from 0.039 to 6.20 bar and temperatures ranging from 298 to 393 K. These include 25 isotherms with a total of 267 data points. The congeners included in these mixtures are: acetic acid, ethyl acetate, furfural, methanol, 2-methyl-1-propanol, 1-pentanol, 1-propanol and methyl acetate. Table 3 shows pure component properties for all the substances considered in this study. In this table, M is the molecular weight, Tc is the critical temperature, Pc is the critical pressure, Vc is the critical volume and ω is the acentric factor. The values for these properties were obtained from Daubert et al. [28].
Properties for all substances involved in this study. The values for these properties, were obtained from Daubert et al. [28].
| Components | M (kg/kmol) | Tc (K) | Pc (bar) | Vc (m3/kmol) | ω |
| Ethanol | 46.1 | 513.95 | 61.37 | 0.168 | 0.6436 |
| Acetic acid | 60.1 | 591.95 | 57.86 | 0.180 | 0.4665 |
| Ethyl acetate | 88.1 | 523.35 | 38.80 | 0.286 | 0.3664 |
| Furfural | 96.1 | 670.15 | 56.60 | 0.252 | 0.3678 |
| Methanol | 32.0 | 512.65 | 80.84 | 0.117 | 0.5659 |
| 2-Methyl-1-propanol | 74.1 | 547.75 | 49.95 | 0.274 | 0.5857 |
| 1-Pentanol | 88.2 | 588.10 | 38.97 | 0.326 | 0.5731 |
| 1-Propanol | 60.1 | 536.75 | 51.69 | 0.218 | 0.6204 |
| Methyl acetate | 74.1 | 506.55 | 47.50 | 0.228 | 0.3313 |
Table 4 gives some details on the experimental data used in the study including the literature source for each data set [6,8]. In this table, T is the temperature (expressed in kelvins), N is the number of experimental data, P is the pressure (expressed in bar), Δx1 is the liquid mole fraction range of component 1 and Δy1 is the vapour mole fraction range of component 1.
Details on the phase equilibrium data for the systems considered in this study. In the table the temperature’ values have been rounded to the closest integer.
| Systems Ethanol (2) + | Reference | T(K) | N | Range of date | ||
| P (bar) | Δx1 | Δy1 | ||||
| Acetic acid | [6] | 308 | 13 | 0.0387–0.1062 | 0.2380–0.9400 | 0.0350–0.8860 |
| 318 | 12 | 0.0633–0.1765 | 0.2380–0.9320 | 0.0380–0.8710 | ||
| Ethyl acetate | [6] | 313 | 14 | 0.1821–0.2603 | 0.0060–0.9600 | 0.0220–0.9280 |
| 328 | 14 | 0.3789–0.4865 | 0.0055–0.9440 | 0.0185–0.9020 | ||
| 333 | 18 | 0.4812–0.6465 | 0.0505–0.9760 | 0.1100–0.9393 | ||
| 343 | 15 | 0.7312–0.9493 | 0.0065–0.9750 | 0.0175–0.9480 | ||
| Furfural | [6] | 323 | 9 | 0.0387–0.2932 | 0.0201–0.9800 | 0.0046–0.3240 |
| 338 | 9 | 0.0746–0.5598 | 0.0201–0.9800 | 0.0048–0.3510 | ||
| 353 | 9 | 0.1333–1.0730 | 0.0201–0.9800 | 0.0051–0.3603 | ||
| Methanol | [6] | 298 | 11 | 0.0856–0.1612 | 0.0841–0.9165 | 0.1610–0.9610 |
| 373 | 10 | 2.3293–3.4465 | 0.0620–0.9410 | 0.0890–0.9610 | ||
| 393 | 10 | 4.2774–6.2037 | 0.0610–0.9420 | 0.0820–0.9590 | ||
| 2-Methyl-1-propanol | [6] | 323 | 9 | 0.1022–0.2783 | 0.1000–0.9000 | 0.0310–0.6600 |
| 333 | 9 | 0.1711–0.4436 | 0.1000–0.9000 | 0.0330–0.6750 | ||
| 343 | 9 | 0.2751–0.6879 | 0.1000–0.9000 | 0.0350–0.6870 | ||
| 353 | 9 | 0.4291–1.0253 | 0.1000–0.9000 | 0.0370–0.7010 | ||
| 1-Pentanol | [8] | 348 | 19 | 0.1352–0.8489 | 0.0500–0.9500 | 0.0070–0.6610 |
| 1-Propanol | [6] | 323 | 9 | 0.1440–0.2823 | 0.1000–0.9000 | 0.0480–0.7580 |
| 333 | 9 | 0.2374–0.4508 | 0.1000–0.9000 | 0.0510–0.7680 | ||
| 343 | 9 | 0.3819–0.7011 | 0.1000–0.9000 | 0.0530–0.7770 | ||
| 353 | 9 | 0.5825–1.0398 | 0.1000–0.9000 | 0.0550–0.7820 | ||
| Methyl acetate | [6] | 323 | 8 | 0.3212–0.7598 | 0.0269–0.9217 | 0.1101–0.9511 |
| 333 | 8 | 0.4932–1.0796 | 0.0269–0.9217 | 0.1066–0.9480 | ||
| 343 | 8 | 0.7731–1.5088 | 0.0269–0.9217 | 0.1052–0.9449 | ||
| 353 | 8 | 1.1463–2.0660 | 0.0269–0.9217 | 0.0842–0.9430 |
4 Results and discussion
Table 5 presents the results of the consistency test for the mixtures considered in this study. As observed in the table, 13 of the 25 data sets were found to be thermodynamically consistent (TC), three sets were found to be not fully consistent (NFC), and nine sets were found to be thermodynamically inconsistent (TI). Of the nine sets found to be thermodynamically inconsistent, seven did not fulfil the area test and two sets were declared to be TI because the model could not fit the data in an accurate manner (%ΔPmax greater than 10%). Since the other isotherms could be modelled by the PR/KM model in an acceptable way (%ΔPmax lower than 10%), the area test is not applied, but the data are declared to be inconsistent. Also, in Table 5, the average absolute deviations for the pressure , the maximum individual relative deviations for the bubble pressure %ΔPmax, the average absolute deviations for the vapour mole fraction , and the average absolute area deviations are provided. The average deviations and for a set of N data are defined by eqs. (10) and (12).
Results obtained for the PR/KM model with optimum binary interaction parameters (k12, β12, δ12). Area deviations and results of the consistency test for all isotherms.
| Systems Ethanol (2) + | T (K) | k12 | β12 | δ12 | Results | ||||
| Acetic acid | 308 | −0.14488 | 0.25451 | −0.76646 | 4.5 | −9.9 | 10.7 | 39.3 | TI |
| 318 | −0.16897 | 0.15049 | −0.60760 | 6.2 | −9.9 | 8.8 | 28.1 | TI | |
| Ethyl acetate | 313 | 0.09107 | 0.12565 | 0.00316 | 0.5 | 2.6 | 2.0 | 9.7 | TC |
| 328 | 0.12728 | 0.16984 | 0.04015 | 0.4 | 2.6 | 4.6 | 10.5 | NFC | |
| 333 | −0.05943 | −0.05628 | −0.11753 | 7.7 | 17.6 | 12.1 | – | TI* | |
| 343 | 0.08636 | 0.14462 | −0.02646 | 0.4 | 2.6 | 3.3 | 14.1 | NFC | |
| Furfural | 323 | 0.05978 | −0.07166 | 0.11860 | 12.7 | 25.2 | 12.5 | – | TI* |
| 338 | −0.01638 | −0.23892 | 0.14416 | 6.1 | 8.9 | 12.9 | 13.3 | NFC | |
| 353 | −0.01385 | −0.15270 | 0.03372 | 3.3 | 9.8 | 10.7 | 27.1 | TI | |
| Methanol | 298 | 0.38225 | 0.55352 | 0.20042 | 1.6 | −4.9 | 2.9 | 28.4 | TI |
| 373 | 0.06155 | 0.02533 | 0.12259 | 0.6 | 1.6 | 1.9 | 20.1 | TI | |
| 393 | −0.10148 | −0.17580 | −0.03435 | 1.0 | 3.0 | 1.9 | 19.6 | TI | |
| 2-Methyl-1-propanol | 323 | 0.11385 | 0.18477 | 0.05496 | 2.5 | 6.4 | 13.0 | 12.2 | TC |
| 333 | 0.14828 | 0.04808 | 0.28130 | 1.8 | 5.4 | 10.0 | 8.4 | TC | |
| 343 | 0.0974 | 0.18997 | 0.00429 | 1.4 | 4.2 | 8.7 | 7.1 | TC | |
| 353 | 0.08682 | 0.08641 | 0.09587 | 1.2 | 1.6 | 6.2 | 7.4 | TC | |
| 1-Pentanol | 348 | −0.02311 | −0.02503 | −0.04859 | 1.4 | 4.4 | 8.6 | 5.3 | TC |
| 1-Propanol | 323 | 0.06194 | 0.11260 | 0.01337 | 1.9 | 6.9 | 7.1 | 11.0 | TC |
| 333 | 0.05801 | 0.10592 | 0.01209 | 1.5 | 5.6 | 5.7 | 9.6 | TC | |
| 343 | 0.08325 | 0.06628 | 0.10817 | 1.1 | 3.6 | 4.7 | 7.4 | TC | |
| 353 | 0.03765 | 0.07136 | 0.00149 | 1.2 | 3.4 | 4.0 | 10.0 | TC | |
| Methyl acetate | 323 | 0.07887 | 0.08683 | 0.06734 | 0.6 | 1.8 | 3.6 | 7.2 | TC |
| 333 | −0.09295 | −0.01183 | −0.24173 | 2.2 | 4.9 | 3.4 | 8.6 | TC | |
| 343 | 0.30410 | 0.26966 | 0.36825 | 0.9 | 2.3 | 5.2 | 9.8 | TC | |
| 353 | 0.26088 | 0.19238 | 0.35252 | 2.9 | 7.6 | 2.0 | 64.8 | TI |
As indicated in Table 5, the PR/KM model reproduces the bubble pressure of these binary mixtures with average absolute deviations below 12.8% for any temperature. In 21 of the 25 isotherms studied, pressure deviations are below 5.0%. With respect to the congener concentration in the vapour phase (y1), this quantity is predicted in all cases studied with average absolute deviations ranging from 1.9% to 13.0%. It should also be mentioned that the highest deviations are generally found for those cases in which the congener concentration in the vapour phase is very low.
For the 13 isotherms considered to be thermodynamically consistent, for instance the system 2-methyl-1-propanol (1) + ethanol (2) at all temperatures, the modelling is acceptable as seen in Table 5 and deviations in the areas are within the established limits.
Three cases are declared to be not fully consistent (NFC), such as the system furfural (1) + ethanol (2) at T = 338 K. This is so in these cases because there are some few points in the original data set that give high area deviations, but the remaining areas give deviations within the established limits. If those points showing high deviation are not considered in the analysis (one or two points for each one of the systems), the remaining data give area deviations below the established limits (20%). Thus, the remaining set is TC but the original set is declared to be NFC.
For the nine cases considered to be thermodynamically inconsistent (TI), seven did not fulfil the area test. For instance, for the system acetic acid (1) + ethanol (2) at T = 308 and 318 K, the area deviations are very high for more than 25% of the points of the original data set, despite the fact that the modelling is acceptable and within the limits established by the method. Also, two cases were declared to be TI because the modelling is not accurate enough (some deviations in the individual pressures are higher than 10%). For instance, this is the situation for the systems ethyl acetate (1) + ethanol (2) at T = 333 K and furfural (1) + ethanol (2) at T = 323 K.
A graphical description of the results is show on Figs. 1–3. Fig. 1 shows the relative area deviations for the liquid phase %ΔAi for the system 1-propanol (1) + ethanol (2) at T = 343 K, declared to be thermodynamically consistent (TC). As observed in the figure, all area deviations are below 20%. Fig. 2 shows the relative area deviations for the liquid phase %ΔAi for the system ethyl acetate (1) + ethanol (2) at T = 328 K, declared to be not fully consistent (NFC). In this case, two points present area deviations higher than 20%. Fig. 3 shows the relative area deviations for the system methanol (1) + ethanol (2) at T = 393 K, declared to be thermodynamically inconsistent (TI). For this case, 44% of the original data give deviations higher than 20%.

Area deviations for the liquid phase %ΔAi for the system 1-propanol (1) + ethanol (2) at T = 343 K, declared to be thermodynamically consistent (TC).
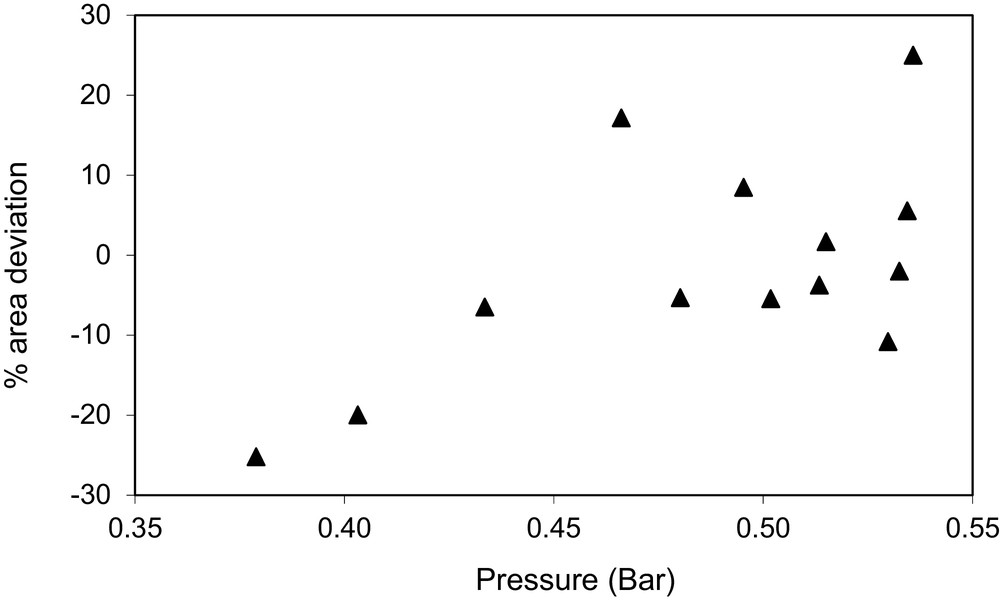
Area deviations for the liquid phase %ΔAi for the system ethyl acetate (1) + ethanol (2) at T = 328 K, declared to be not fully consistent (NFC).
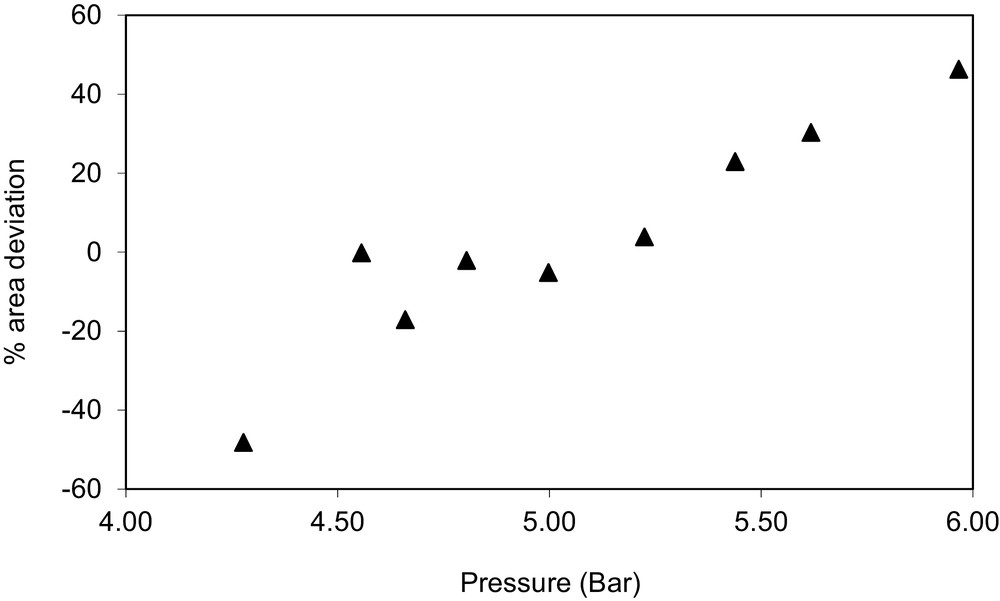
Area deviations for the system methanol (1) + ethanol (2) at T = 393 K, declared to be thermodynamically inconsistent (TI).
5 Conclusions
Based on the results, the following main conclusions can be drawn:
- • the equation of state method using appropriate mixing rules such as that of Kwak and Mansoori can be used to model low-pressure VLE data in ethanol + congener mixtures;
- • bubble pressures can be correlated with good accuracy with the PR/KM model, giving absolute average deviations below 12.8% for each isothermal data set and the overall absolute average deviations is 2.6%;
- • the congener concentration in the vapour phase, y1, can be obtained with good accuracy, giving absolute average deviations below 13.1% for each isothermal data set and the overall absolute average deviations is 6.6%;
- • the proposed consistency test method allows to globally analyse P–T–y data;
- • the method gives an adequate answer about the consistency or inconsistency of a set of experimental P–T–y data.
Acknowledgements
The authors thank the support of the National Council for Scientific and Technological Research (CONICYT), through the research grant FONDECYT 1070025. JOV thanks the University of La Serena and the Centre for Technological Information of La Serena-Chile, for permanent support. CAF and MFM thank the Direction of Research of the University of Concepcion for the support through the research grant DIUC 211.011.054-1.0.