

1 Introduction
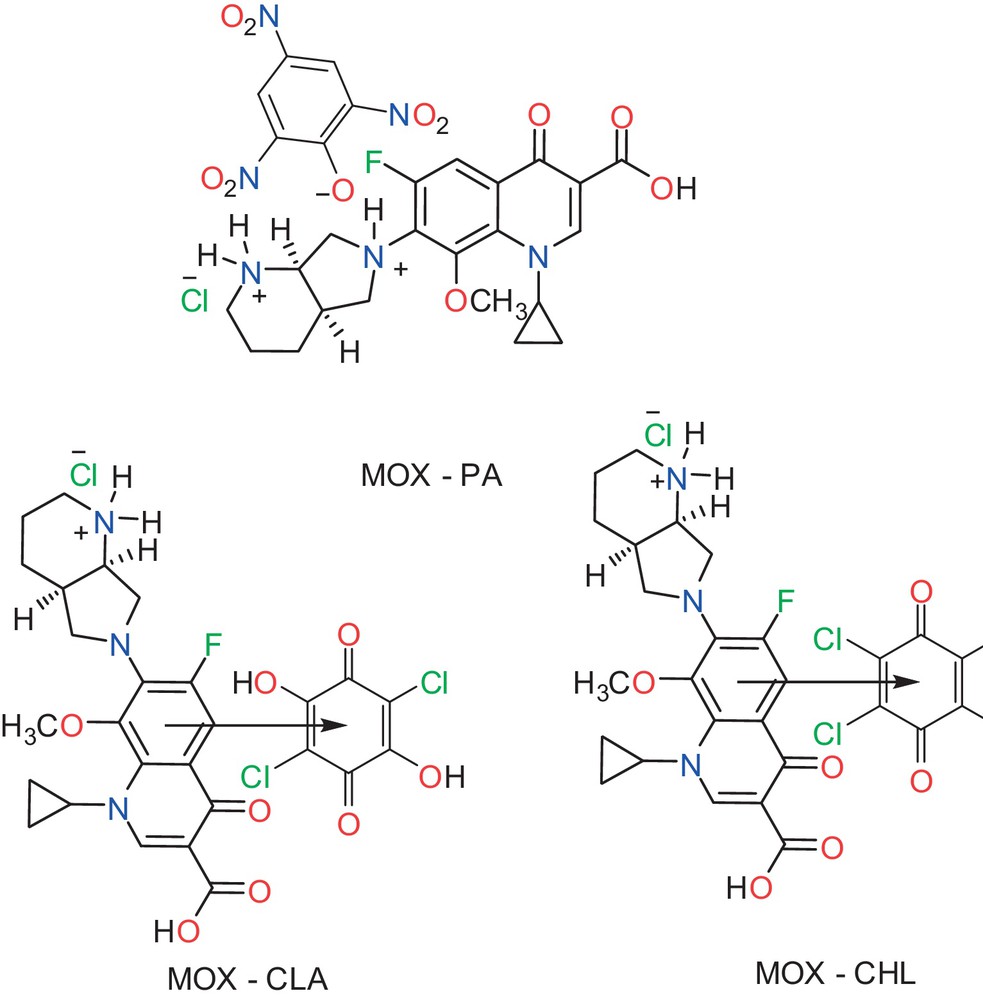
The study of nanostructured materials has become a popular area of research because of their unique physical and chemical properties. Furthermore, the charge-transfer (CT) or proton-transfer (PT) interactions between drugs or biological compounds and small molecular acceptors have attracted considerable interest because of their unique physical and chemical properties and wide range of applications [1–9]. The chemistry of these interactions is an important topic in pharmacology, chemistry, biology and medicine. Such interactions play crucial roles in many processes; therefore, understanding these interactions is important for understanding drug-receptor binding and the drug's mechanism of action as well as obtaining quantitative estimates of drugs [10–16]. To investigate these roles more fully, the physical and chemical properties of drug-acceptor complexes can be enhanced if the complexes are prepared on the nanoscale. For several years, we have investigated the synthesis, characterization and application of various CT and PT interactions [17–32]. As part of our continuing interest in this field, in this work, we sought to obtain nanoscale CT or PT complexes of the drug moxifloxacin (MOX) with various organic acceptors and to explore the benefits of CT interactions in removing and utilizing discarded amounts of this drug. MOX, or 1-cyclopropyl-7-(2,8-diazobicyclo[4.3.0]nonane)-6-fluoro-8-methoxy-1,4-dihydro-4-oxo-3-quinoline carboxylic acid), is a fourth-generation fluoroquinolone antibiotic. Its structure is shown in Fig. 1. Currently, this drug is being extensively used in the treatment of respiratory system disease for its broad spectrum of antimicrobial activity against respiratory tract pathogens, including Gram-positive and Gram-negative organisms, anaerobic bacteria and atypical respiratory tract pathogens [33]. This work focused on the following objectives:
- • synthesizing CT or PT nanoparticles of MOX with different organic acceptors (i.e. PA, CLA and CHL);
- • verifying the complexation stoichiometry using CHN elemental analysis and spectrophotometric titrations;
- • calculating the formation constant (K), molar extinction coefficient (ɛ) and other spectroscopic data using the Benesi–Hildebrand equations;
- • characterizing the nanoparticles by elemental and spectroscopic data (UV–Vis, IR, 1H and 13C NMR);
- • obtaining the thermal properties using TG analysis;
- • determining the kinetic − thermodynamic parameters (i.e., E*, A, ΔS*, ΔH*, and ΔG*) using the Coats–Redfern and Horowitz–Metzger methods;
- • observing and differentiating the microstructures of these nanoparticles using X-ray diffraction (XRD) and scanning electron microscopy (SEM) techniques;
- • proving the nanometry using transmission electron microscopy (TEM);
- • carbonizing the complexes to obtain a method for the removal of this antibiotic as porous carbon material.
(Color online.) The structure of drug moxifloxacin (MOX) and organic acceptors.
2 Experiment and calculations
2.1 Chemicals and solutions
All the chemicals used were of analytical grade and were used as purchased. Moxifloxacin hydrochloride (MOX; C21H24FN3O4·HCl; 437.89) was supplied by Sigma–Aldrich Chemical Co. (USA). The organic acceptors picric acid (PA; C6H3N3O7; 229.10), chloranilic acid (CLA; C6H2Cl2O4; 208.98) and chloranil (CHL; C6Cl4O2; 245.88) (Fig. 1) were purchased from Merck (Darmstadt, Germany) and used without modification. HPLC-grade methanol was also purchased from Merck (Darmstadt, Germany). Standard stock solutions of the drug MOX and acceptors at a concentration of 5.0 × 10⁻³ M were freshly prepared prior to each series of measurements by dissolving precisely weighed quantities in a 100 mL volumetric flask. The stock solutions were protected from light. Solutions for spectroscopic measurements were prepared by mixing appropriate volumes of the MOX and acceptor stock solutions with the solvent immediately before recording the spectra.
2.2 Instruments
To ascertain the constituents, purity and compositions of the synthesized complexes, the carbon, hydrogen, and nitrogen contents were analyzed using a PerkinElmer 2400 series CHN microanalyzer (USA). The UV–Vis spectra were recorded in methanol over a wavelength range of 200–800 nm using a PerkinElmer Lambda 25 UV–Vis double-beam spectrophotometer with quartz cells. The path length of the cells was 1.0 cm. The infrared (IR) spectra of the solid products (as KBr discs) were acquired at room temperature using a Shimadzu FT–IR spectrophotometer (Japan) over the range of 4000–400 cm−1. 1H and 13C NMR spectra were collected on a Bruker DRX-250 spectrometer operating at 600 MHz. The measurements were performed at ambient temperature using DMSO-d6 (dimethylsulfoxide, d6) as the solvent and TMS (tetramethylsilane) as the internal reference. Thermogravimetric (TG) analysis was performed using a Shimadzu TGA–50H thermal analyzer (Japan) with standard platinum TG pans. The measurements were conducted at a constant heating rate of 10 °C/min over the temperature range of 25–600 °C in a nitrogen atmosphere using alumina powder as the reference material. The X-ray diffraction (XRD) profiles were obtained using a PANalytical X’Pert PRO X-ray powder diffractometer equipped with a Ge(III) secondary monochromator. Cu Kα1 was employed as the radiation source, with a wavelength of 0.154056 nm. The samples were scanned with 2θ between 5° and 90°. The microstructure and morphology were analyzed by a scanning electron microscope (SEM, Quanta FEG 250 instrument). The instrument was operated at an accelerating voltage of 20 kV. The particle size was analyzed by transmission electron microscope (TEM, JEOL JEM-1200 EX II, Japan). The instrument was operated at an accelerating voltage of 60–70 kV.
2.3 Preparation of materials
2.3.1 Nanoparticle syntheses
A simple synthetic protocol was used for the preparation of nanostructured complexes of MOX. A typical procedure for the preparation is briefly described as follows. First, 2 mmol of MOX in a methanol solvent (20 mL) was added to 20 mL of a solution containing 2 mmol of the acceptor (either PA, CLA or CHL) in the same solvent. The resulting mixture was stirred at room temperature for approximately half an hour. A change in color occurred, and the solution was allowed to evaporate slowly at room temperature, resulting in the precipitation of the solid complexes. The precipitates were isolated, filtered and further purified using the same system and a recrystallization process to obtain the pure product. The products were then collected and dried in vacuo for 48 h. The excellent agreement between the experimental and calculated values of C, H and N indicated that the synthesized nanoparticles were free of impurities. The stoichiometry of the interaction between the drug MOX and the acceptors was found to have a 1:1 ratio.
2.3.1.1 MOX free drug
Pale yellow powder; IR (KBr, cm−1): υmax 3394 ν(O–H)carboxylic, 2817–2705 ν(NH2+), 1708 ν(CO)carboxylic, 1621 ν(CO)ketonic, 1323 νas(C–N). 1H NMR (DMSO-d6, 600 MHz): δ = 0.97–1.17 (m, 4H, 2 CH2, 2′′ and 3′′ protons), 1.79 (m, 4H, 2 CH2, 3′ and 4′ protons), 2.65 (t, 2H, CH2, 2′ protons), 2.92 (m, 1H, CH, 4′a proton), 3.59 (s, 3H, OCH), 3.62 (d, 2H, CH2, 5′ protons), 3.73 (d, 2H, CH2, 7′ protons), 3.84 (m, 1H, NCH, 7′a proton), 4.17 (m, 1H, NCH, 1′′ proton), 7.65 (d, 1H, C5 proton), 8.63 (s, 1H, C2 proton), 8.92 (s, 2H, H2N+1′ proton), 10.19 (s, 1H, COOH proton). 13C NMR (DMSO-d6, 600 MHz): δ = 7.70, 9.22, 17.15, 20.23 (4 CH2), 24.20 (CH), 42.92, 53.87 (2 NCH2), 54.95, 54.98 (1 NCH, 1 NCH2), 62.62 (OCH3), 107.5, 107.6, 117.4, 135.0, 137.2, 140.1, 152.2 (6 Ar–C), 155.0 (C–F), 167.4, 177.2 (2 CO). Anal. calcd. for C21H24FN3O4·HCl (437.89), C, 57.55; H, 5.71; N, 9.59; Found, C, 57.52; H, 5.76; N, 9.63. The structure of the drug MOX with its corresponding atom numbering scheme is shown in Fig. 2.
(Color online.) The structure of drug MOX with atom numbering.
2.3.1.2 MOX–PA complex
Yellow powder; IR (KBr, cm−1): υmax 3390 ν(O–H)carboxylic, 2894–2798 ν(NH2+), 2675, 2599, 2518 υ(+N–H…O−), 1708 ν(CO)carboxylic, 1623 ν(CO)ketonic, 1347 νas(C–N). 1H NMR (DMSO-d6, 600 MHz): δ = 0.97–1.18 (m, 4H, 2 CH2, 2′′ and 3′′ protons), 1.81 (m, 4H, 2 CH2, 3′ and 4′ protons), 2.67 (t, 2H, CH2, 2’ protons), 2.93 (m, 1H, CH, 4′a proton), 3.59 (s, 3H, OCH), 3.63 (d, 2H, CH2, 5′ protons), 3.75 (d, 2H, CH2, 7′ protons), 3.85 (m, 1H, NCH, 7′a proton), 4.18 (m, 1H, NCH, 1′′ proton), 7.65 (d, 1H, C5 proton), 8.49 (s, 1H, HN+1 protons), 8.63 (s, 1H, C2 proton), 8.79 (s, 2H, picric acid protons), 9.84 (s, 2H, H2N+1′ protons), 10.22 (s, 1H, COOH proton). 13C NMR (DMSO-d6, 600 MHz): δ = 8.37, 9.57, 17.56, 20.49 (4 CH2), 34.11, 34.15, 48.59, 54.45, 54.50, (CH, NCH, NCH2), 61.74 (OCH3), 106.3, 118.9, 125.2, 134.4, 136.4, 140.41, 140.48, 141.7, 150.3, 152.2, 160.8, 165.8, 175.92, 175.95 (Ar–C, C–F, CO). Anal. calcd. for C27H28FClN6O11 (666.99), C, 48.58; H, 4.20; N, 12.59; Found, C, 48.38; H, 4.29; N, 12.31.
2.3.1.3 MOX–CLA complex
Reddish-brown powder; IR (KBr, cm−1): νmax 3400 ν(O–H)carboxylic, 2839–2717 ν(NH2+), 1711 ν(CO)carboxylic, 1629 ν(CO)ketonic, 1326 νas(C–N). 1H NMR (DMSO-d6, 600 MHz): δ = 0.99–1.19 (m, 4H, 2 CH2, 2′′ and 3′′ protons), 1.81 (m, 4H, 2 CH2, 3′ and 4′ protons), 2.65 (t, 2H, CH2, 2′ protons), 2.94 (m, 1H, CH, 4′a proton), 3.62 (s, 3H, OCH), 3.65 (d, 2H, CH2, 5′ protons), 3.74 (d, 2H, CH2, 7′ protons), 3.85 (m, 1H, NCH, 7′a proton), 4.19 (m, 1H, NCH, 1′′ proton), 5.78 (s, 2H, chloranilic acid OH), 7.66 (d, 1H, C5 proton), 8.63 (s, 1H, C2 proton), 9.05 (s, 2H, H2N+1′ proton), 10.10 (s, 1H, COOH proton). 13C NMR (DMSO-d6, 600 MHz): δ = 7.72, 9.24, 17.15, 20.21 (4 CH2), 24.18 (CH), 42.90, 53.88 (2 NCH2), 54.90, 54.94 (1 NCH, 1 NCH2), 62.61 (OCH3), 107.6, 107.8, 115.8, 117.8, 135.2, 137.0, 140.5, 152.2, 155.3, 162.8, 164.4, 165.1, 167.2 (Ar–C, C–Cl, C–F, CO). Anal. calcd. for C27H27Cl3FN3O8 (646.87), C, 50.09; H, 4.17; N, 6.49; Found, C, 50.15; H, 4.30; N, 6.92.
2.3.1.4 MOX–CHL complex
Pale brown powder; IR (KBr, cm−1): υmax 3390 ν(O–H)carboxylic, 2851 ν(NH2+), 1670 ν(CO)carboxylic, 1623 ν(CO)ketonic, 1325 νas(C–N); 1H NMR (DMSO-d6, 600 MHz): δ = 0.99–1.20 (m, 4H, 2 CH2, 2′′ and 3′′ protons), 1.80 (m, 4H, 2 CH2, 3′ and 4′ protons), 2.60 (t, 2H, CH2, 2′ protons), 2.90 (m, 1H, CH, 4′a proton), 3.61 (s, 3H, OCH), 3.64 (d, 2H, CH2, 5′ protons), 3.71 (d, 2H, CH2, 7′ protons), 3.81 (m, 1H, NCH, 7′a proton), 4.20 (m, 1H, NCH, 1′′ proton), 7.60 (d, 1H, C5 proton), 8.62 (s, 1H, C2 proton), 8.04 (s, 2H, H2N+1′ proton), 10.08 (s, 1H, COOH proton). 13C NMR (DMSO-d6, 600 MHz): δ = 7.65, 9.18, 17.20, 20.25 (4 CH2), 24.24 (CH), 42.88, 53.85 (2 NCH2), 54.91, 54.90 (1 NCH, 1 NCH2), 62.58 (OCH3), 108.5, 109.1, 117.0, 135.8, 137.6, 139.8, 140.5, 152.8, 155.5, 166.9, 169.7, 175.4 (Ar–C, C-Cl, C–F, CO). Anal. calcd. for C27H25Cl5FN3O6 (683.77), C, 47.38; H, 3.66; N, 6.14; Found, C, 47.15; H, 3.71; N, 6.50.
2.3.2 Preparation of carbon materials
The porous carbons were simply prepared by the direct carbonization of the complex containing the PA acceptor in a furnace at 400 °C for 1 h under N2 atmosphere. The as-prepared non-activated carbon product was ground into powder with a particle size of 2–3 mm and characterized by XRD, SEM and TEM techniques.
2.4 Calculations
The spectroscopic data were used to calculate the formation constant (K), the molar extinction coefficient (ɛ) [34], the energy of the interaction (ECT) [35], the oscillator strength (f) [36], the transition dipole moment (μ) [37], and the standard free energy (ΔG°) [38] for the synthesized complexes in solution, using the equations described elsewhere in the literature. Two different methods were employed to evaluate the kinetic–thermodynamic parameters: the Coats–Redfern method and the Horowitz–Metzger method. The kinetic–thermodynamic data were used to calculate the activation energy (E*), the frequency factor (A), the enthalpy of activation (H*), the entropy of activation (S*) and the Gibbs free energy of activation (G*) in the solid state using the Coats–Redfern [39] and Horowitz–Metzger methods [40]. Finally, the particle size of the complexes was estimated from their XRD patterns based on the highest-intensity line, using the well-known Debye–Scherrer formula [41].
3 Results and discussion
3.1 Structural characterization
3.1.1 UV–visible measurements
MOX (5.0 × 10⁻⁴ M) was mixed with each acceptor solution (5.0 × 10⁻⁴ M) in a methanol solvent, and the reaction was allowed to proceed at room temperature. The UV–visible spectrum of each reaction mixture was then recorded against a reagent blank solution. A change in the color was observed as the MOX and acceptor solutions were mixed. These changes provided strong evidence of interactions between the MOX and the acceptors. Fig. 3 displays the UV–visible absorption spectra of the MOX and acceptors, along with the spectra of the prepared complexes. It is clear from the spectra that each complex exhibits an absorption band presumably caused by CT interaction at 344 nm for MOX–PA, 325 nm for MOX–CLA, and 335 nm for MOX–CHL. The stoichiometry of the MOX–acceptor interactions in solution was obtained from the spectrophotometric titrations by determining the conventional molar ratio according to previously published protocols [42]. The electronic spectra of the MOX–acceptor systems were recorded at varying acceptor concentrations and a constant MOX concentration. The composition of the complexes was determined graphically by plotting the absorbance on the ordinate against the volume of the acceptor (in mL) on the abscissa. Representative spectrophotometric titration plots based on the characterized absorption bands are shown in Fig. 4. The results show that the greatest interaction between MOX and each acceptor occurred at a donor:acceptor ratio of 1:1, indicating that 1:1 complexes were formed. These stoichiometric values are consistent with the data obtained by the elemental analysis of the solid state complexes.

(Color online.) Electronic absorption spectra of the MOX complexes with PA, CLA and CHL acceptors.
(Color online.) Spectrophotometric titration curves for the MOX complexes with PA, CLA and CHL acceptors.
3.1.2 The spectroscopic data
The 1:1 Benesi–Hildebrand equation [34] was used to determine the spectroscopic parameters of the synthesized complexes. Fig. 5 shows a representative 1:1 Benesi–Hildebrand plot of the MOX complexes. The values of both K and ɛ have been determined from these data and, along with the other spectroscopic parameters (e.g., f, μ, ECT and ΔG°), are provided in Table 1. Fig. 5 reveals that the correlation coefficient (r) of the straight lines is > 0.99. The complex containing the CHL acceptor shows a higher K value than the other complexes. This high value of K reflects the relatively high electron acceptance ability of CHL and suggests that the MOX–CHL complex is strongly bound and highly stable. The stability of the complexes decreases in the following order: MOX–CHL > MOX–CLA > MOX–PA. All the ΔG° values are negative, indicating that the complexation between MOX and the acceptors is exothermic and spontaneous. The ΔG° values of the complexes for the different acceptors are ordered as follows: CHL > CLA > PA. We note that this ordering is consistent with the stability of the MOX complexes. Linear correlations were observed between several pairs of spectroscopic parameters (Fig. 6). For example, a very strong linear correlation (r = 0.9960) exists between the oscillator strength (f) and the dipole moment (μ) in solution. This finding indicates that the oscillator strength values of the complexes in solution increased as their dipole moment values increased. In addition, a very strong linear relationship (r = 0.9955) is also observed between the standard free energy change (ΔG°) and the formation constant (K). The values of ΔG° become more negative as the formation constant for the molecular complex increases.
(Color online.) The 1:1 Benesi–Hildebrand plots of the MOX complexes with PA, CLA and CHL acceptors.
Spectral properties of the MOX complexes.
| Complex | |||
| Property | MOX–PA | MOX–CLA | MOX–CHL |
| λmax (nm) | 344 | 325 | 335 |
| Formation constant; K (L/mol) | 103 × 104 | 106 × 104 | 135 × 104 |
| Extinction coefficient; ɛmax (L/mol/cm) | 26 × 105 | 17 × 105 | 21 × 105 |
| Energy value; ECT (eV) | 3.62 | 3.83 | 3.71 |
| Oscillator strength; f | 1.59 | 1.86 | 3.00 |
| Dipole moment; μ | 3.40 | 3.58 | 4.62 |
| Standard free energy change; ΔG° (kJ/mol) | –3.43 × 10⁴ | –3.44 × 10⁴ | –3.50 × 10⁴ |
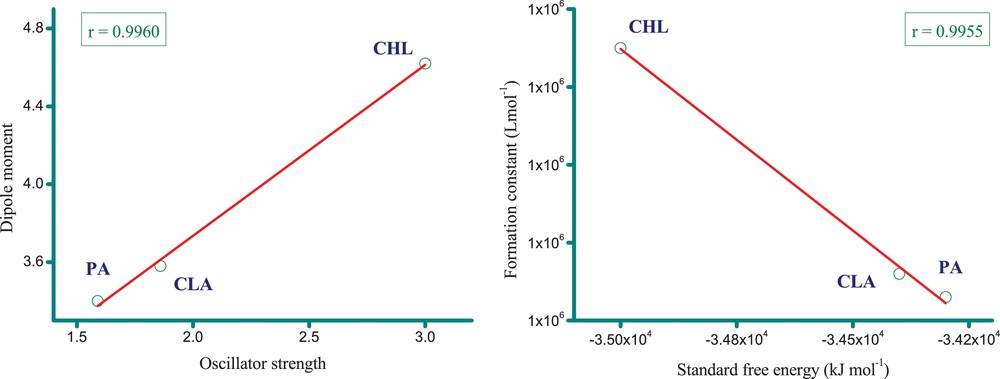
(Color online.) Linear correlations of some spectroscopic parameters.
3.1.3 IR measurements
The IR absorption spectra of the solid complexes were recorded in the wave number range 4000–400 cm−1 using KBr discs. The IR spectra of the solid products were recorded and are depicted in Fig. 7. The IR spectrum of the free MOX was characterized by principal absorption peaks at 3394 cm−1 for ν(O − H), 2817–2705 for ν(NH2+), 2950 cm−1 for C–H symmetric and asymmetric stretching, 1708 and 1621 cm−1 for ν(CO), 1515 and 1457 cm−1 for ν(CC), 1323 cm−1 for ν(C–N), 1186 cm−1 for monofluorobenzene stretching, and 834 cm−1 for C–H bending of substituted benzene. The IR spectrum of the MOX–PA complex is characterized by a group of medium bands at 2675, 2599 and 2518 cm−1. These new broadened bands are attributed to ν(+N–H) and confirm the migration of the PA proton towards the nitrogen of the MOX quinoline ring to form an intermolecular H-bonded ion pair (+N–H…O−). Additionally, the characteristic band observed at 1323 cm−1 that results from the ν(C–N) vibration of the free MOX shifts to ∼ 1347 cm−1 in MOX–PA. The observed shift in the ν(C–N) band upon complexation suggests that this group participated directly in the complexation. All these observations indicate the presence of hydrogen bonding in this complex [43–57].
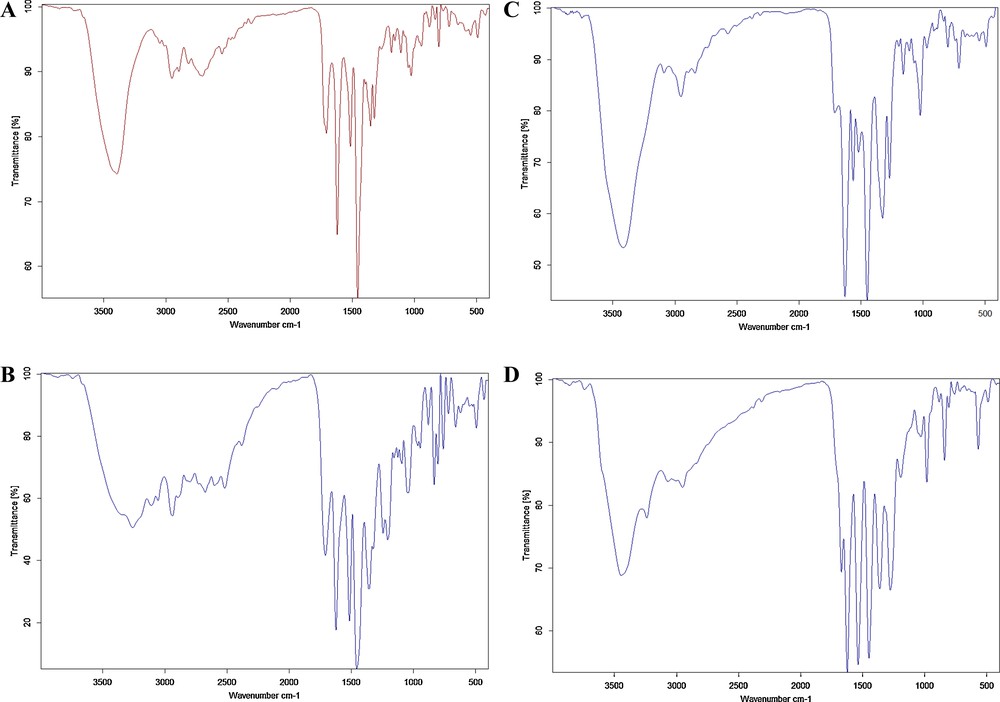
(Color online.) A. IR spectrum of the free MOX. B. IR spectrum of the MOX–PA complex. C. IR spectrum of the MOX − CLA complex. D. IR spectrum of the MOX–CHL complex.
The MOX molecule contains three nitrogen atoms in (C–N) groups: the nitrogen of the piperidine ring, the nitrogen of the quinoline ring, and the nitrogen of the pyrrolidine ring, and all of them are sp3 hybridized nitrogens. They differ from each other in basicity, mainly due to resonance, which decreases the basicity and the steric hindrance. The most basic one is the nitrogen of the piperidine ring, with its lone pair of electrons occupied by the formation of the hydrochloride sat. The least basic one is the nitrogen of the quinoline ring, with its lone pair of electrons dispersed to the ring through the resonance with the α, β unsaturated ketones. The middle one is the nitrogen of the pyrrolidine ring, with its lone pair of electron dispersed to the ring through the plus mesomeric (+M) effect of the benzene ring along with the indicated (–I) effect of the ortho fluorine atom. The last is the nitrogen atom most expected to be able to accept the acidic proton of PA. In the CLA and CHL complexes, the vibrational frequencies of ν(O–H) and ν(C–N) of MOX do not shift, which indicates that these groups do not participate in the complexation. The carbonyl and chloro groups in the CLA or CHL acceptor are electron-withdrawing, removing electron density from the aromatic ring and thereby causing it to become an electron-accepting moiety. Thus, because of the electron-withdrawing effect of the CLA or CHL acceptor and the good electron-donating ability of the MOX, the interaction between MOX and the acceptor can occur through π → π* charge migration [58,59].
3.1.4 1H and 13C NMR measurements
The 600 MHz 1H and 13C NMR spectra of the synthesized complexes were measured in DMSO-d6 at room temperature and are shown in Figs. 8 and 9, respectively. According to the 1H NMR spectrum of free MOX, the protons of the piperidine ring were observed as a singlet signal at 8.92 ppm corresponding to (2H, NH2+), and the –COOH proton appeared as a singlet at 10.19 nm. The signal due to the phenolic proton (–OH) of the PA acceptor, which is observed at δ ∼ 11.94 ppm [60] in the spectrum of the free PA acceptor, is no longer observed. Instead, a new signal is observed at approximately ∼ 8.49 ppm. This singlet signal is assigned to the proton of the +N−H species formed by proton-transfer from the OH group of PA to the nitrogen atom of the MOX quinoline ring [61]. The singlet peak observed at 9.05 and 8.04 ppm in the MOX–CLA and MOX–CHL complexes, respectively, has been assigned to the +NH2 protons of MOX. We note that these peaks represent very small shifts relative to the analogous peak in the spectrum of free MOX (8.92 ppm). The 13C NMR spectrum of free MOX showed 20 resolved carbon signals. The carbon signals of the seven CH2 groups were observed at δ 7.70, 9.22, 17.15, 20.23, 42.92, 53.87, and 54.98 ppm and the two CH carbons at δ 24.20 and 54.95. The aromatic carbons showed six signals at δ (107.5, 107.6), 117.4, 135.0, 137.2, 140.1, and 152.2 ppm. The carbon signals of the two carbonyl groups were observed at δ 167.4 and 177.2 ppm, δ 155.0 (C–F), and the OCH3 carbon at 62.62 ppm. In the 13C NMR spectra of the products, the appearance of 24, 23 and 22 distinct resonant carbon signals in the spectra of the PA, CLA and CHL complexes, respectively, is consistent with the proposed molecular structure of these complexes. For all complexes, common changes in the values of the 13C chemical shifts in MOX can be observed as a result of its complexation with the organic acceptors. The structures of the synthesized complexes have been confirmed by IR, 1H and 13C NMR spectral data. The data obtained by these techniques are consistent with each other and support the predicted structures. The complexation of the drug MOX with the PA acceptor leads to hydrogen bonding, whereas a direct π → π* transition is observed between MOX and the CLA or CHL acceptor. Fig. 10 illustrates the proposed structures of the MOX complexes.
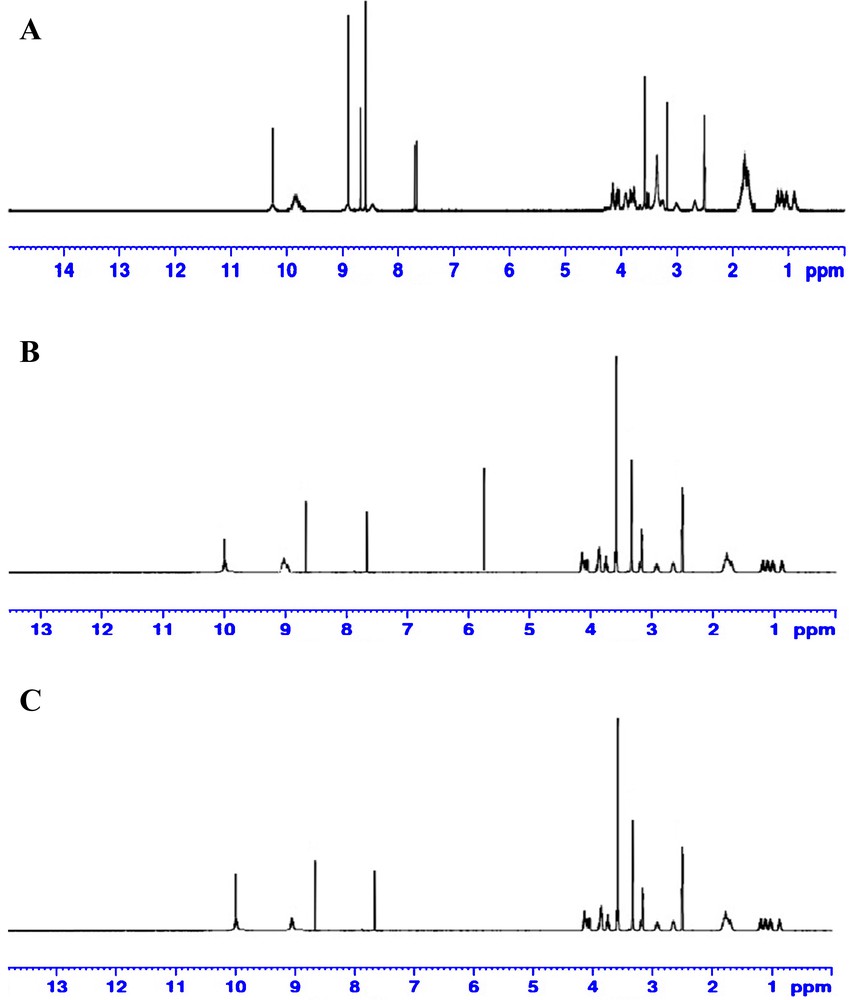
(Color online.) A. 1H NMR spectrum of the MOX–PA complex. B. 1H NMR spectrum of the MOX–CLA complex. C. 1H NMR spectrum of the MOX–CHL complex.
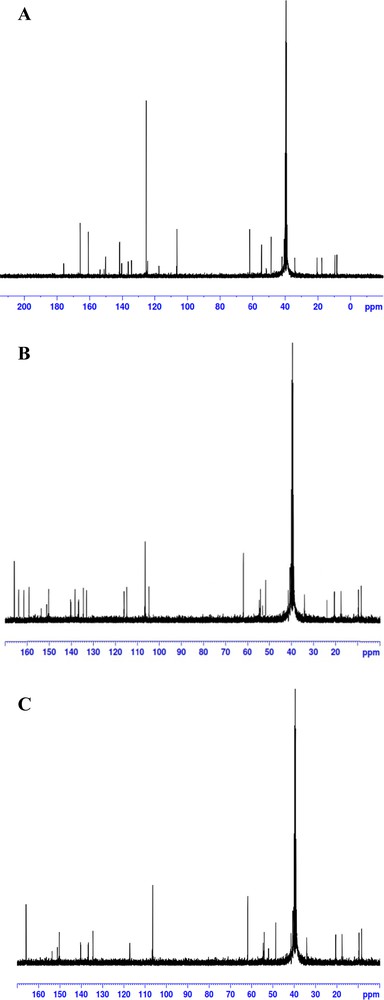
(Color online.) A. 1H NMR spectrum of the MOX–PA complex. B. 1H NMR spectrum of the MOX–CLA complex. C. 1H NMR spectrum of the MOX–CHL complex.
(Color online.) Proposed structural formula for the proton-transfer complex; MOX–PA and charge-transfer complexes; MOX–CLA and MOX–CHL.
3.2 Thermal characterization
3.2.1 Thermogram properties
The thermal decomposition and stability of the synthesized complexes were investigated by TG analysis. The possible thermal degradation patterns for these complexes are collected in Table 2, and their representative TG thermograms are depicted in Fig. 11. The analysis of these thermograms provided the following observations:
- • the observed weight loss is in excellent agreement with the theoretical predictions;
- • the MOX–CHL complex exhibited good thermal stability up to 200 °C;
- • the complexes are stable up to ∼ 130, 150 and 200 °C for MOX–PA, MOX–CLA and MOX–CHL, respectively. Thus, these complexes are stable in the solid state at room temperature and can be stored for several months without degradation;
- • the CLA and CHL complexes exhibit a one-stage degradation process, while the PA complex was thermally decomposed in approximately two decomposition steps;
- • the decomposition of the complexes is almost complete without any carbon residue;
- • the degradation data strongly support the formation of the synthesized complexes and their proposed structures.
Thermal decomposition data for the synthesized MOX complexes.
| Compound | Stages | TG range (°C) | TG% mass loss | Lost species | |
| Found | Calculated | ||||
| MOX–PA | I | 130–335 | 34.05 | 34.34 | PA |
| II | 335–600 | 65.41 | 65.64 | MOX | |
| MOX–LA | I | 150–600 | 99.89 | 100.0 | MOX + CLA |
| MOX–CHL | I | 200–600 | 99.82 | 100.0 | MOX + CHL |
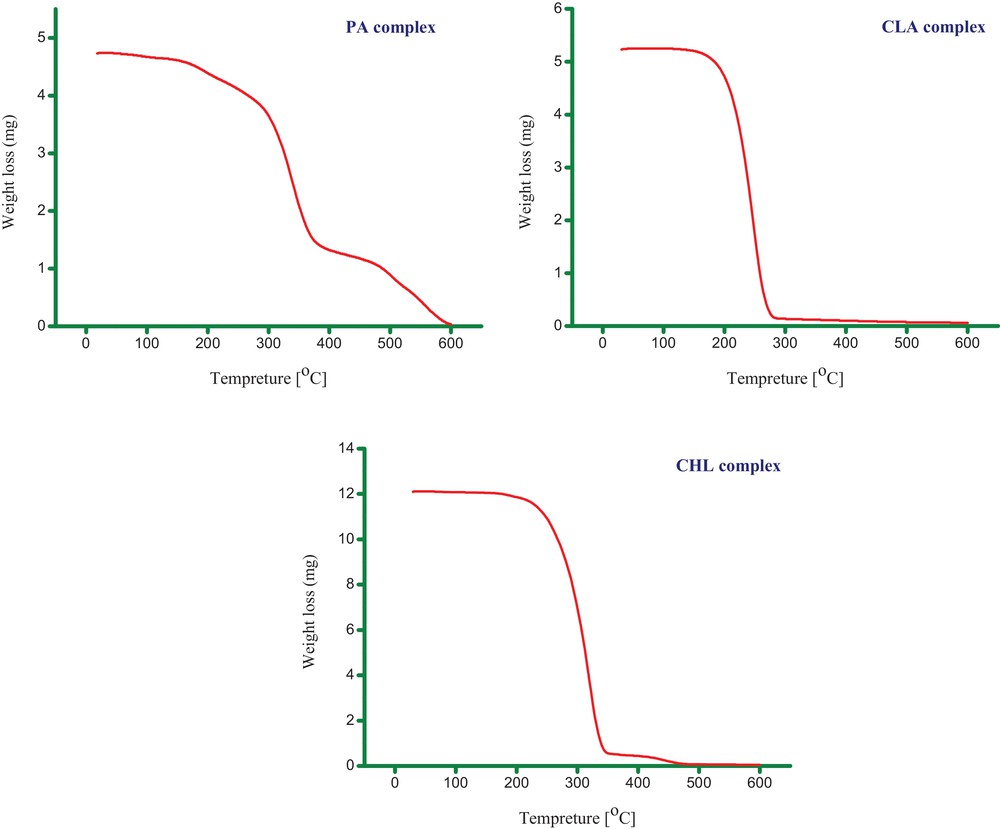
(Color online.) TG thermogram plots of the MOX complexes with PA, CLA and CHL acceptors.
3.2.2 Kinetic properties
The kinetic–thermodynamic parameters (i.e., E*, A, H*, S* and G*) associated with the MOX complexes were evaluated graphically (Fig. 12) by employing the Coats–Redfern and Horowitz–Metzger methods. The evaluated data are tabulated in Table 3. The kinetic–thermodynamic data obtained from the two methods are comparable and can be considered to be in good agreement with each other. The activation energy (E*) of the complexes is expected to increase with the increasing thermal stability of the complexes. Therefore, the E* value for the MOX–PA complex is higher than for the other complexes, which indicates a higher thermal stability for this complex. Comparing the E* values for the main decomposition step of the complexes, we observed the following trend for the different acceptors: PA > CLA > CHL. The negative values of ΔS* indicate that the activated complexes have a more ordered structure than the reactants. Moreover, these values suggest the formation of donor–acceptor CT complexes [62]. The ΔS* values of the complexes occur in decreasing order for the acceptors as follows: PA > CLA > CHL.
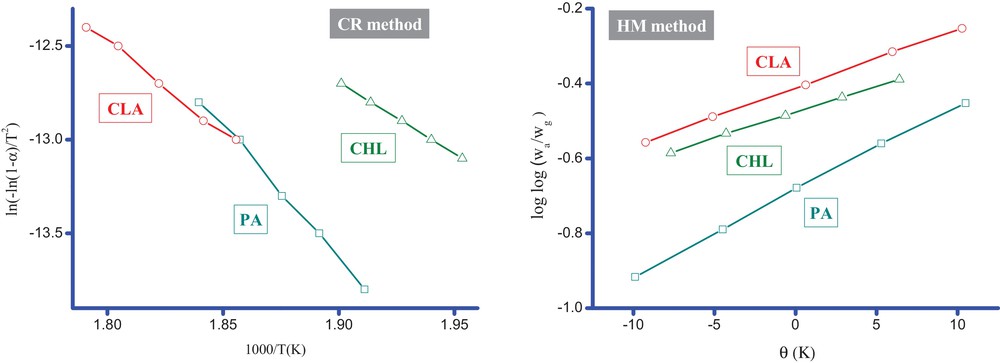
(Color online.) Kinetic–thermodynamic plots for MOX complexes (CR; Coats–Redfern equation, HM; Horowitz–Metzger (HM) method).
Kinetic data of thermal decomposition determined using the Coats–Redfern (CR) and Horowitz–Metzger (HM) methods.
| Compound | Method | Parameters | r | ||||
| E* (J mol−1) | A (s−1) | ΔS* (J mol−1 K−1) | ΔH* (J mol−1) | ΔG* (Jmol−1) | |||
| MOX–PA | CR | 1.10 × 10⁵ | 3.95 × 10⁸ | –8.32 × 101 | 1.10 × 10⁵ | 1.44 × 10⁵ | 0.9984 |
| HM | 1.15 × 10⁵ | 5.52 × 10⁹ | –6.20 × 101 | 1.12 × 10⁵ | 1.40 × 10⁵ | 0.9976 | |
| MOX–CLA | CR | 7.72 × 10⁴ | 1.40 × 10⁵ | –1.48 × 10² | 7.22 × 10⁴ | 1.50 × 10⁵ | 0.9975 |
| HM | 8.61 × 10⁴ | 1.30 × 10⁵ | –1.28 × 10² | 8.20 × 10⁴ | 1.49 × 10⁵ | 0.9982 | |
| MOX–CHL | CR | 6.32 × 10⁴ | 1.21 × 10⁴ | –1.65 × 10² | 5.86 × 10⁴ | 1.44 × 10⁵ | 0.9994 |
| HM | 7.20 × 10⁴ | 1.10 × 10⁴ | –1.42 × 10² | 6.65 × 10⁴ | 1.32 × 10⁵ | 0.9979 |
3.3 Structural characterization
The characterization of both the shape and size of CT or PT complexes is important in the development of these materials and as a means to control the quality of the synthesis. The surface morphology, nanometry, structural features and characteristics of the synthesized complexes were observed by XRD, SEM and TEM analysis. Fig. 13 shows the indexed XRD patterns of the synthesized complexes, and Table 4 presents the XRD spectral data for these complexes. The strongest diffraction peak was observed at diffraction angles 2θ of 32.2°, 13.12°, and 6.94° for the MOX–PA, MOX–CLA and MOX–CHL complexes, respectively. The appearance of a strong and narrow sharp diffraction peak indicated that the as-synthesized complex was well crystallized and has a well-defined structure. The particle size of these complexes was estimated from their XRD patterns based on the highest-intensity value using the well-known Debye–Scherrer formula. The calculated particle diameters of the MOX–PA, MOX–CLA and MOX–CHL complexes were ∼ 14.8, 20.6 and 25.7 nm, respectively, which are in good agreement with the results obtained by TEM. These values suggest that the particle sizes of the complexes are within the nanoscale range. Fig. 14A–C presents multiple SEM micrographs of the outer surfaces of the synthesized complexes at different levels of magnification (i.e., ×1000, ×2000, ×4000). The SEM micrographs of the particles revealed that all of the complexes have a well-defined shape, uniform matrix, distinct size and morphology with homogeneously dispersed nanoparticles, indicating the formation of homogeneous material. Visible morphological change is observed between the MOX complexes. From the high-quality and well-focused TEM micrographs (Fig. 14), it is inferred that all of the complexes are spherical nanoparticles that are homogeneously dispersed with no particle agglomeration. According to these micrographs, most of the nanoparticles of the MOX–PA, MOX–CLA and MOX–CHL complexes exhibit diameters in the range of 6.5–14 nm, 6–31 nm and 8–33 nm and main diameters of 10.3, 18.5 and 20.5 nm, respectively. We note that these diameters are in good agreement with the results calculated from the XRD data.
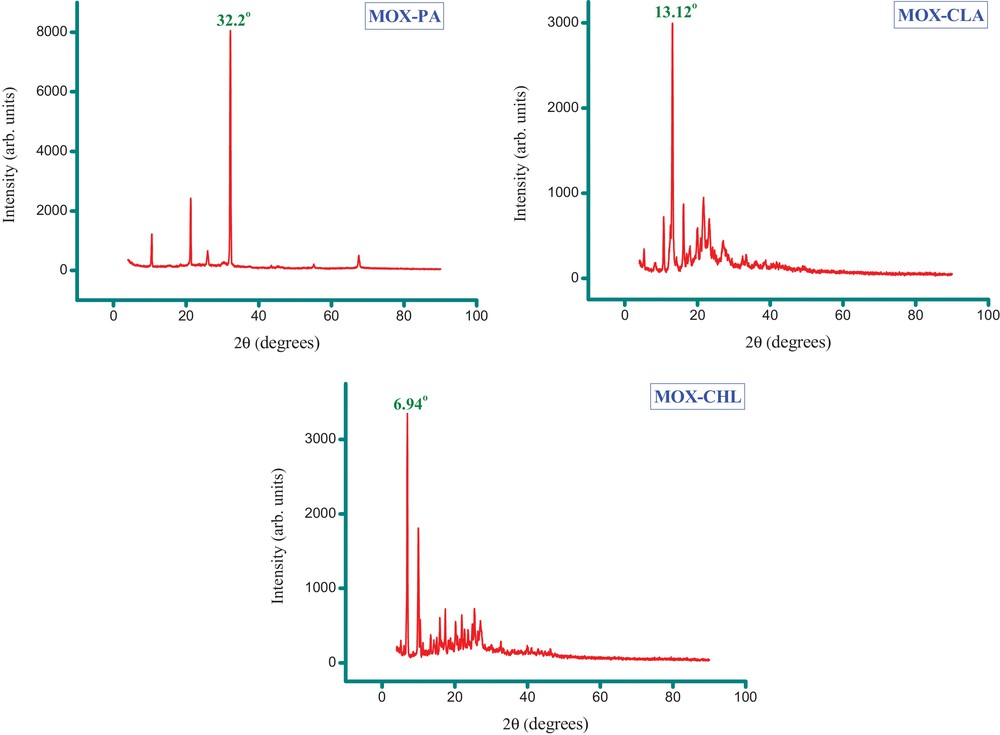
(Color online.) XRD spectra of the MOX complexes with the acceptors PA, CLA and CHL.
XRD spectral data for the synthesized complexes.
| Complex | 2θ; (°) | θ; (°) | d-spacing value; (Å) | Height | β; FWHM | Particle size (nm) |
| MOX–PA | 32.2 | 16.1 | 2.7777 | 8012.935 | 0.580 | 14.77 |
| MOX–CLA | 13.12 | 6.56 | 6.7426 | 3014.896 | 0.473 | 20.60 |
| MOX–CHL | 6.94 | 3.47 | 12.7268 | 3358.017 | 0.324 | 25.65 |
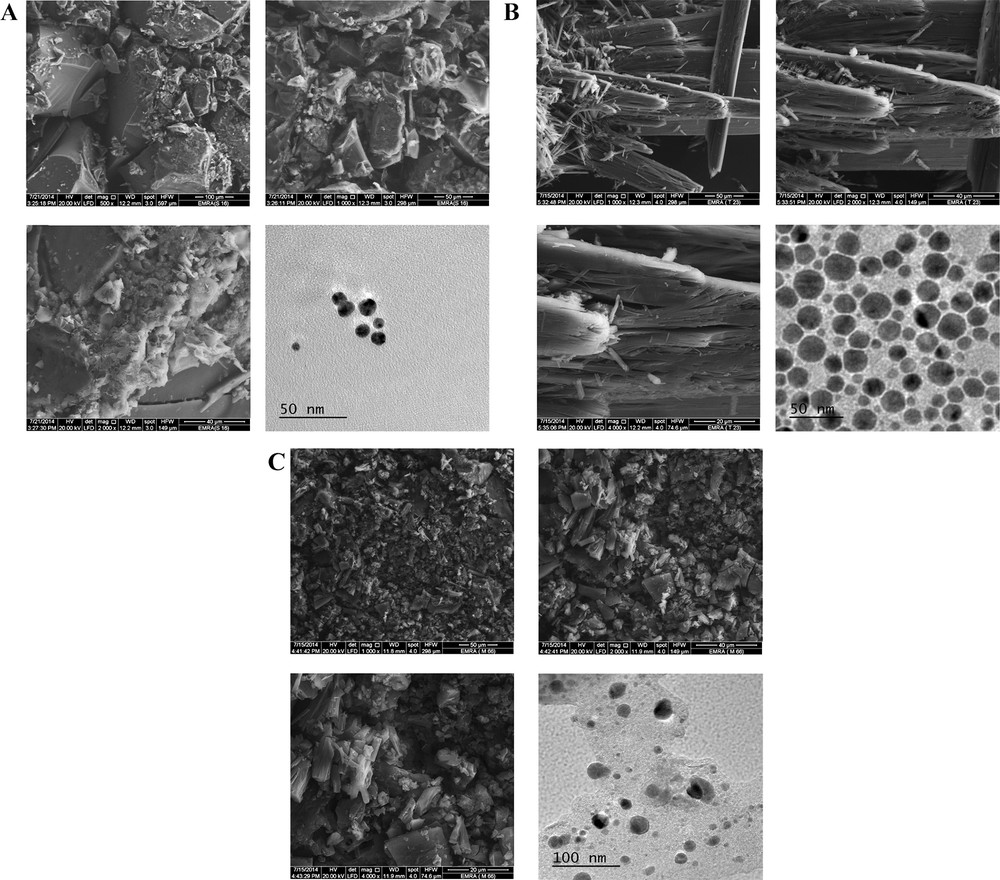
A. SEM and TEM images of the MOX–PA complex. B. SEM and TEM images of the MOX–CLA complex. C. SEM and TEM images of the MOX–CHL complex.
3.4 Properties of carbon material
The as-prepared non-activated carbon product obtained from the direct carbonization of the MOX–PA complex was ground into powder and characterized by XRD, SEM and TEM techniques. Fig. 15 shows the XRD profile for the resultant carbon. This profile displayed one broad peak located at a 2θ of approximately 25°. It matches well with the profile previously reported [63–66] for non-graphitic carbon. The absence of a sharp diffraction pattern indicated that the resulting porous carbon mainly possesses an amorphous structure [67]. Furthermore, no impurity diffraction was observed, confirming the absence of any other X-ray traceable compounds in the carbon product. The multiple SEM micrographs (Fig. 16) at different degrees of enlargement (i.e., ×1000, ×5000, ×10,000) indicate the porosity behavior of the product. The highly magnified (×120,000) TEM micrographs (Fig. 16) show that the length of the carbon particles is approximately 100 nm. The XRD, SEM and TEM analyses confirm that the direct carbonization of the complex leads to nanoporous carbon material.
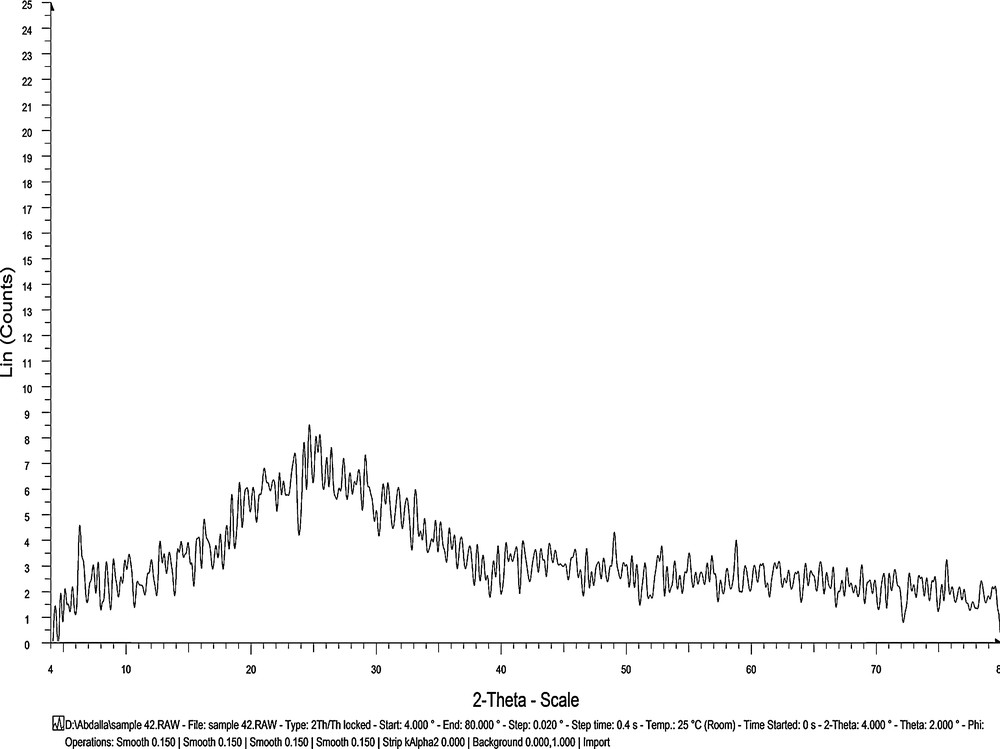
XRD spectrum of the resultant porous carbon.
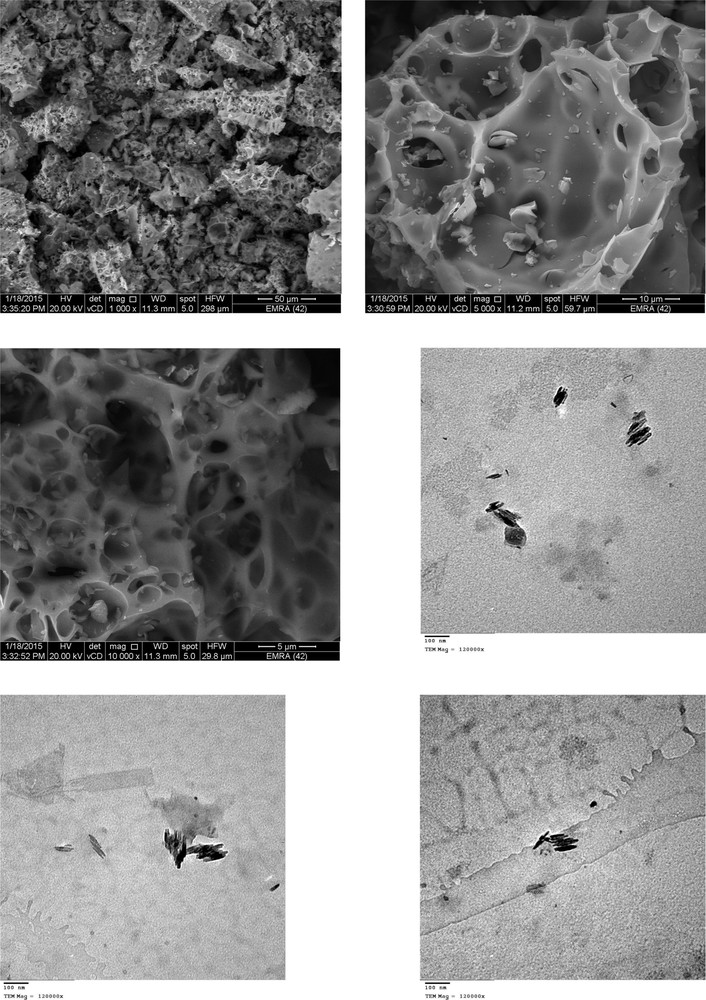
SEM and TEM images of the resultant porous carbon.
3.5 Why carbonize the complex containing the PA acceptor?
The experimental results presented here indicate that the complexation of the drug MOX with the PA acceptor instantly forms a yellow precipitate, while its complexation with the CLA or CHL acceptor forms a colored precipitate after a short period of time. Furthermore, the PA acceptor is soluble in both aqueous and organic media, while CLA and CHL are not. Thus, the PA acceptor is more suitable to remove MOX residues from either aquatic or non-aquatic environments. In recent years, the occurrence and fate of pharmaceutically active compounds, such as antibiotics in the environment, including water, soil, and sediment, has drawn increasing public concern worldwide and has been recognized as one of the emerging issues in environmental chemistry. The presence of antibiotic residues in the environment increases the risk of antibiotic-resistant pathogenic bacteria and genes. Growing resistance means that what were once effective and cheap antibiotics may become unsuitable for treating infections [68–72]. The direct carbonization of the complex containing the PA acceptor leads to a nanoporous carbon material. So, this technique is an efficient way to remove and utilize discarded MOX antibiotic in other products based on complexation with the PA acceptor.
4 Conclusions
Nanostructured complexes derived from the reaction of the drug MOX, a broad spectrum antibiotic against both Gram-positive and Gram-negative bacteria, with organic acceptors (PA, CLA and CHL) were prepared, isolated and characterized by a range of physicochemical methods. The obtained nanoparticles possess interesting microstructures and diameters of ∼ 10–20 nm. Furthermore, this study suggests that complexation with the PA acceptor may be potentially used to remove and utilize discarded MOX antibiotic in other products as porous carbon materials while shedding new light on the further development of charge-transfer complexation for a wide range of environmental applications.