

1 Introduction
Ethylene is one of the most important building blocks in the chemical industry. Among organic chemicals, ethylene ranks first with respect to volume, with an annual worldwide production of 120.106 tons in 2008 [1]. It is used to synthesize polymers, styrene, ethylene oxide, vinyl chloride and vinyl acetate monomers, functionalized hydrocarbons (i.e., dichloroethane, ethylbenzene, acetaldehyde, and ethanol) and many other basic and intermediate products. The direct activation and conversion of alkanes into chemicals is less easy than that of olefins [2], but the availability of alkanes, the increasing demand for olefins [3] and the necessity to minimize the negative environmental impact of a process [4] have stimulated research in this field.
Although, naphtha is the main feedstock for ethylene production in Western Europe and Japan, natural gas derived feedstocks are mainly used in the United States and the Middle East. The lighter ones consist of liquefied petroleum gas (that contains propane and different butanes) or ethane, propane, and butane, which originate from natural gas. For naphtha crackers, full-range naphtha (boiling point: 30–200 °C) or C6–C8 cuts are typically used as feedstocks. In the Middle East, the feedstock basis has shifted to ethane only during the last decade, thus leading to attractive production costs [4]. The emerging availability of shale gas contributes to the shift towards processes that use light alkanes. The recurring variations in the price of crude oil and the availability of ethane has increased the interest in alternative processes for ethylene production, including the dehydration of ethanol (thus enabling the utilization of biomass-derived feeds) [5] and the (oxidative) dehydrogenation of ethane[6–8]. This latter process offers conceptual advantages and, therefore, has been the subject of substantial research activities.
However, the lack of suitable catalysts that combine high activity and selectivity has prevented their industrial realization so far. Transition metal molybdates have interesting photoluminescence properties [9–11], magnetic properties [12–15], electronic properties [16–18] and catalytic properties, particularly in industrial processes of conversion of hydrocarbons [19–22]. For example, cobalt and nickel molybdates are important systems in industrial catalysts especially in partial oxidation of hydrocarbons [22, 23] as well as precursors in the synthesis of sulfide, nitride and carbide materials for HDS activities [24–27]. The Mx(MoO4)y compounds are ideal for exploring possible correlations among the structural, electronic and chemical properties of mixed-metal oxides [28–30].
The perspectives of synthesizing MMoO4 and mixed Ni–Co molybdates with improved catalytic properties furthermore enhance the interest for these compounds. Stern et al. [31] initiated the investigations on a series of binary nickel-cobalt molybdates displaying improved catalytic properties in propane oxidative dehydrogenation, whose XRD patterns let us to conclude that the structures of these mixed compounds are solid solutions of NiMoO4 and CoMoO4.
The present study deals with the preparation of MMoO4 (M=Ni or Co) and mixed Ni–Co molydates using a co-precipitation route. Structural and textural properties of catalysts were studied by several techniques. The catalytic behavior of the catalysts was investigated in the oxidative dehydrogenation of ethane and compared with those reported for bulk catalysts from the literature.
2 Experimental section
2.1 Preparation of catalysts
The catalysts were synthesized by modifying the co-precipitation method previously reported in [32–33]. Stoichiometric amounts of M(NO3)2.6H2O (M=Ni and/or Co) (Aldrich +99%) and (NH4)6Mo7O24.4H2O (Merck +99%) were dissolved separately in deionized water to obtain 0.25 M aqueous solutions with (Ni + Co)/Mo = 1.0 and the final Ni1–xCoxMoO4 (x = 0, 0.5, 1.0) composition of catalysts. The two solutions were mixed and heated at 85 °C and poured dropwise in a vigorously stirred ammonia 2M solution. The volume proportion of both solutions was adjusted to get the final pH ∼5.25, in order to produce [MoO4]2− and [M4O]2− (M=Ni or Co) species in solution, according to the reactions described in Eqs. (1) and (2) (Oh and Td being the octahedral and tetrahedral environments of M species, respectively):
| (1) |
| (2) |
The solution containing the precipitate was concentrated at 85 °C in a centrifugator for 17 h in the same instrument to obtain ‘‘Ni1−xCoxMo’’ (a yellow precipitate is formed for NiMoO; light purple for NiCoMo and purple for CoMoO), according to Eqs. (3) and (4). The obtained solid contains both and entities in close interaction with octahedral nickel and/or cobalt aqueous hydroxide.
| (3) |
| (4) |
The precipitate, thoroughly washed with hot bi-distillated water, was finally dried at 120 °C for 15 h in a flow of dry air. These precursors, called NiMoO (x = 0), CoMoO (x = 1) and NiCoMoO (x = 0.5), were treated at 550 °C for 4 h under 1 L.min−1 of N2 flow to obtain their respective catalysts.
2.2 Characterization techniques
A number of physicochemical methods were used for the characterization of solids before and after calcination. Thermogravimetric analysis (TG-DTA) was performed on a SETARAM TG-92 in combination with analysis of released gases by mass spectrometry (Pfeiffer). Ca. 20 mg of the sample was heated at 5 °C/min in air flow from 25 to 1000 °C.
X-ray powder diffraction (XRD) was performed on a Bruker AXS D8 Advance diffractometer working in Bragg-Brentano geometry using Cu-Kα radiation (λ = 1.54 Å), equipped with an energy dispersive detector (Sol-X). Patterns were collected at room temperature, in the 2θ = 10–90° range, with a 0.02° step and 10 s counting time per step. The EVA software attached to the Bruker machine was used for phase identification.
X-ray diffraction at variable temperatures (HT-XRD) under air atmosphere was carried out on the same apparatus equipped with an XRK 900 chamber and a Vantec detector up to 800 °C. Diagrams were collected every 25 °C at 0.1 °C/s heating rate, the counting time being chosen to collect a diagram in 15 min in the 10–90° 2θ range.
Laser Raman Spectroscopy (LRS) was performed with a Spectra Physics krypton ion laser spectrometer with the 647.1 nm excitation line at room temperature. The beam was focused onto the samples using the macroscopic configuration of the apparatus. To avoid damage due to light absorption, all compounds were studied with a very low laser power (3 mW on the sample). Four accumulations were used in each spectral range. The scattered light was analyzed with an XY Raman Dilor spectrometer equipped with an optical multichannel charge coupled device liquid nitrogen-cooled detector. The spectral resolution was approximately 0.5 cm−1 in the 200–1500 cm−1 range. Acquisition and data processing were performed with the LABSPEC software.
The surface area of samples was obtained from N2 physisorption experiments after degassing at 200 °C for 30 min on a Micromeritics ASAP2010 apparatus using the BET method.
X-ray photoelectron spectroscopy (XPS) was carried out on an Escalab 220 XL spectrometer (Vacuum Generators). The monochromatic AlKα X-ray source was used and electron energies were measured in the constant analyzer energy mode. The pass energy was 100 eV for the survey of spectra and 40 eV for the single element spectra. All XPS binding energies were referred to C1s core level at 285 eV. The angle between the incident X-rays and the analyzer was 58°, photoelectrons being collected perpendicularly to the sample surface. Spectra were analyzed with the CasaXPS software.
The reducibility of samples was studied by temperature-programmed reduction by hydrogen (H2-TPR), which was carried out on a Micromeritics-Autochem II 2920 with a TCD detector to monitor the H2 consumption. After calibration of H2 on the TCD, the sample displayed in a U-shaped quartz reactor was pre-treated in argon, and heated at 5 °C/min from 25 to 1000 °C in 5% H2 in an Ar gas mixture.
2.3 Catalytic experiments
The catalytic experiments were performed at atmospheric pressure in a conventional test rig. Ethane and oxygen were mixed with helium and argon (all gas flow-rates measured by using flow-mass controllers) and passed through the quartz U-shaped fixed bed reactor (10 mm inner diameter, 17.80 cm length) containing the catalyst. Two thermocouples were displayed, one at the center of the oven to monitor the temperature outside of the reactor and the other at the middle of the catalyst bed to indicate the temperature of the reaction. The effluents were analyzed before and after the reaction using a Prisma 200 Pfeiffer mass spectrometer. Before loading into the reactor, 100 mg of powder sample were diluted with an equal amount of silicon carbide granules of 0.250 mm diameter size to achieve isothermal operation within the catalytic bed.
Tests have been run with varying the temperature between 250 and 600 °C and the W/F ratio was varied from 0.06 to 0.24 g.s/cm3 by varying the flow. Before each experiment, the catalyst was heated progressively from ambient until the desired temperature under a mixture of oxygen, helium and argon (O2/(He + Ar) = 1) to remove any humidity and to ensure a fully oxidized state of elements. Ethane (C2H6/O2 = 1) was introduced into the reactor after 30 min.
2.4 Results and discussion
2.4.1 Thermal analysis and HT-XRD of precursors
In order to determine the convenient calcination temperature, the decomposition of precursors was studied by TG-DTA-MS (Fig. 1) and by HT-XRD (Fig. 2) techniques in the 25–1000 °C range. The successive weight losses (%), the corresponding temperatures and the nature of evolved gases are gathered in Table 1. Endothermic peaks on the DTA curve were attributed to the elimination of reversibly bound water molecules below 100 °C, and to the crystal water molecules of NiMoO4.H2O and to the decomposition of remaining ammonium ions between 100 and 300 °C. The losses of weight in the 300–500 °C range corresponding to exothermic peaks located at 450, 384 and 331 °C for NiMoO, NiCoMoO and CoMoO, respectively, were attributed to the decomposition of ammonium nitrate temporarily formed at grain interfaces or during synthesis which may favor the formation of the mixed oxide [34]. In addition, the exothermic peak located at 450°C for NiMoO may be ascribed to the decomposition of NH4(NiMoO4)2OH.H2O[34,35]. The weight becomes stable above 500 °C for the three synthetized precursors. These precursors present approximately the same weight loss (Table 1) they are 14.5, 10.64 and 11.9% for NiMoO, NiCoMoO and CoMoO, respectively. These values were approximately reached compared to the theoretical weight loss for the transformation of M(NO3)2.6H2O + (NH4)6Mo7O24.4H2O → MMoO4 (M=Ni and/or Co) (Δm/m = 12.04–14.34%).

Thermal analyses (TG-DTA) of, (a) NiMoO, (b) Ni0.5Co0.5MoO, (c) CoMoO precursors.
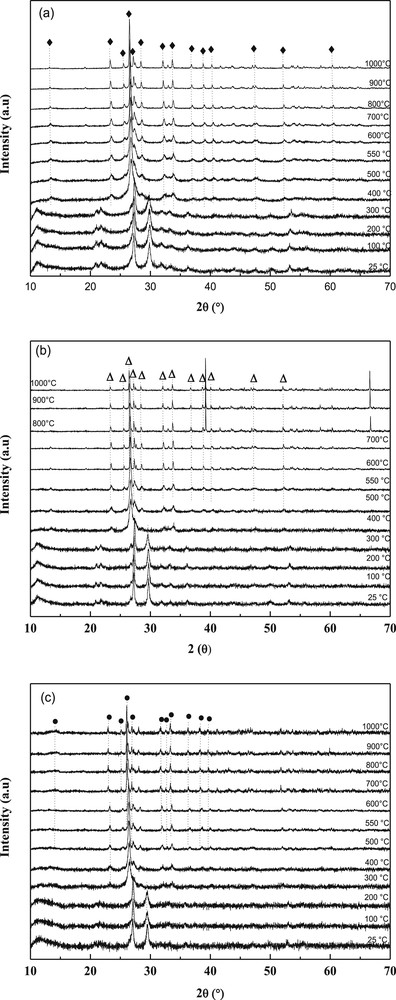
HT-XRD patterns of decomposition in air of, (a) NiMoO, (b) Ni0.5Co0.5MoO and (c) CoMoO precursors (♦: α-NiMoO4, Δ: α-Ni0.5Co0.5MoO4,●: β-CoMoO4).
TG-DTA-MS of precursors.
| Sample | Temperature (°C)a | Released gas | Temperature (°C)b | Δm/m (%)c | (Δm/m)theord |
| NiMoO | 127 | H2O, NH3 | 100 | 7 | 14.33 |
| 316 | H2O, NH3, CO2, CO | 290 | 12 | ||
| 460 | NO, NO2 | 455 | 14.5 | ||
| NiCoMoO | 128 | H2O, NH3 | 100 | 4.8 | 12.04 |
| 322 | H2O, NH3, CO2, CO | 300 | 9.4 | ||
| 431 | NO, NO2, CO2 | 400 | 10.6 | ||
| CoMoO | 128 | H2O, NH3 | 100 | 6 | 14.34 |
| 240 | CO2, CO, NH3, H2O | 210 | 8 | ||
| 347 | NO, NO2 | 300 | 11.9 |
a DTA-MS signals.
b Change of slope of weight versus temperature curve.
c Successive weight losses.
d The total theoretical weight loss.
The transformation of precursors was studied by HT-XRD up to 1000 °C (Fig. 2). The same type of XRD pattern was observed for precursors up to 200 °C (CoMoO) or 300 °C (NiMoO and NiCoMoO), the lines being slightly shifted depending on the precursor. The patterns fit with those given for CoMoO4.H2O (JCPDS card No. 26-0477) and NiMoO4.H2O (JCPDS card no. 13-0128) for CoMoO and NiMoO, respectively. However, up to our knowledge the crystal structure of these hydrates has not yet been solved. The patterns fit as well those for NH4(CoMoO4)2OH.H2O[36] and NH4(NiMoO4)2OH.H2O[34,35].
Above these temperatures, other lines started to grow. In all cases, the peak at 2θ = 30° disappeared completely (at 400 °C for NiMoO and NiCoMoO, at 300 °C for CoMoO) while a peak located at 2θ = 23° appeared. Above 500 °C, the lines of α-NiMoO4 (file 33-0948) in NiMoO and NiCoMo and β-CoMoO4 (file 21-0868) in CoMoO patterns were observed. Upon heating, the polymorphic transition (α → β) of NiMoO4 occurred from 700 °C as noticed by the growing of the main peaks located at 2θ = 23.4°, 25.6°, 26.6°, 27.2°, 28.5°, 32.1°, 33.7°. This phase transformation was complete only at 800 °C when only the peaks of the β-phase were observed. When decreasing the temperature from 1000 °C to 25 °C, the opposite transformation (β → α) was observed, even though a small percentage of β-phase still remained. In contrary, the behavior of CoMoO is completely different compared with NiMoO. The transformation α-CoMoO4 → β-CoMoO4 was found to occur at temperatures between 300 and 400 °C and was observed by A. Maione et al. [30]; these temperatures are considerably lower than those found for the α-NiMoO4 → β-NiMoO4 transformation. After cooling β-CoMoO4 back to room temperature, there was however no formation of the other isomorphs, in contrast with the transformation seen with β-NiMoO4, therefore suggesting that β-NiMoO4 is less stable than β-CoMoO4. This difference can be explained by the lower activation energy associated with the change in the coordination of the metal atoms (Oh → Td) for the α-NiMoO4 → β-NiMoO4 transition (∼40 kcal.mol−1)as compared to that of α-CoMoO4 → β-CoMoO4(∼64 kcal.mol−1) [16,37].
The results of thermal analyses (TGA-TD and HT-XRD) of our precursors show that 550 °C is the most appropriate temperature of calcination as this temperature seems high enough for the removal of water, carbonates and nitrates.
It should however be noted that in the case of CoMoO4, the (220) and (002) lines are so close to each other (d220 = 3.362 Å and d002 = 3.361 Å) that they overlap. This behavior is consistent with the increase in six-fold coordinated ionic radii of Ni2+ (0.69 Å) to Co2+ (0.74 Å), which is reflected in the linear increase of d-spacing with the Co/Ni ratio across each region. Since both the cell dimensions and the relative intensities representative of these two compounds vary linearly with the Ni/Co atomic ratio [30,31], this brings us to a conclusion that the structures of the mixed nickel-cobalt molybdates in each domain is a α-Ni0.5Co0.5MoO4 system of NiMoO4 and CoMoO4 in a common molybdate lattice. At high temperatures, a decomposition occurred at ca. 800 °C. Weak extra lines appeared in the XRD patterns that can be attributed to cobalt oxide left in the sample after the partial sublimation of MoO3.
2.4.2 Structural properties of catalysts
The elementary composition of catalysts was checked by the atomic absorption spectroscopy technique (Table 2). Only Ni, Co and Mo were detected in all cases (no impurity) and the atomic ratios were very close to the nominal ones. These results suggest that the solids contain only the molybdate phase without any supplementary oxide.
Composition, specific surface area and crystalline phases detected in pure MMoO4 and mixed Ni–Co molybdate (calcination at 550 °C).
| Catalysts | Molar ratio | AAS (Ni + Co)/Mo | SBET (m2 g−1) | Vp (cm3 g−1)a | Dp (nm)b |
| α-NiMoO4 | 1:1 | 1.10 | 37 | 0.12 | 21 |
| α-Ni0.5Co0.5MoO4 | 0.5:0.5:1 | 0.90 | 17 | 0.08 | 16 |
| β-CoMoO4 | 1:1 | 0.98 | 14 | 0.44 | 14 |
a Average pore volume.
b Average pore diameter.
In accordance with the results obtained by HT-XRD, the XRD analysis of the three calcined samples (Fig. 3), performed at room temperature, show the presence of α-NiMoO4 in NiMoO with an octahedral Mo coordination and of β-CoMoO4 in CoMoO with a tetrahedral Mo coordination. The solid solution Ni0.5Co0.5MoO4 is of α-type.
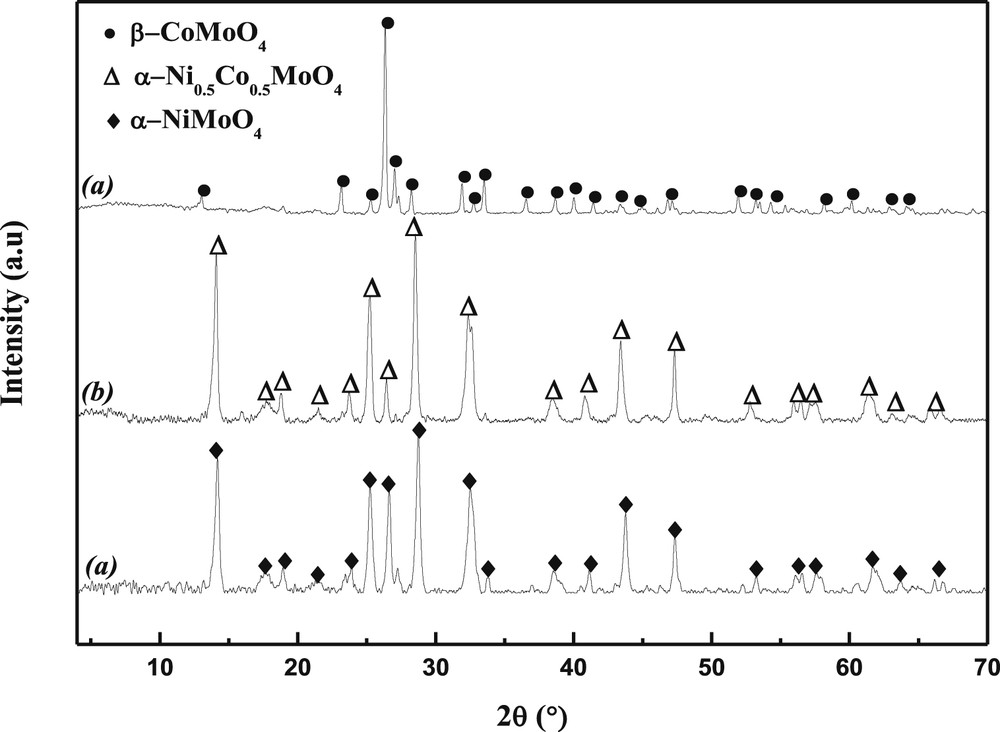
X-ray diffraction patterns of precursors heated at 550 °C (a: NiMoO4, b: Ni0.5Co0.5MoO4, c: CoMoO4).
The Raman spectra of catalysts (Fig. 4) are in good agreement with XRD results. As observed in the literature[36,38,39], the spectral characteristic of the solids containing Ni species exhibit bands corresponding essentially to the α-phase. The sample α-NiMoO4 is assumed to be the result in the formation of the so-called α'-phase, which is a distorted form of α-NiMoO4 [38–40], and this has been confirmed in our case. The presence of the β-phase in the CoMoO4 case is inferred from the occurrence of two neighboring bands at 935–945 cm−1, resulting in a broad band without clear resolution. The Raman spectra of NiMoO4 and CoMoO4 catalysts confirm that only the bands of α-NiMoO4 and β-CoMoO4were found. No free oxides as MoO3, NiO and CoO were detected.
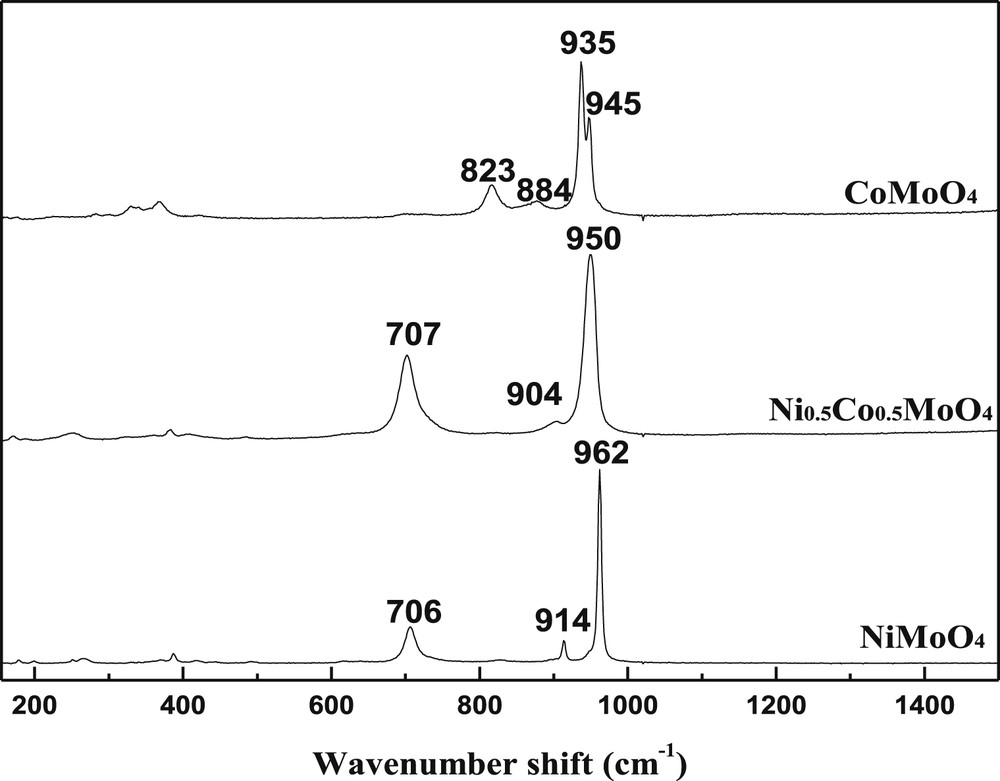
Raman spectra of catalysts after heat treatment at 550 °C.
Raman spectrum of Ni0.5Co0.5MoO4 showed a similar curve to that of both NiMoO4 and CoMoO4, which is characterized by the presence of three bands situated at 707, 904 and 950 cm−1 corresponding to the formation of mixed oxides NiMoO4 and CoMoO4 with a common molybdenum lattice;s this finding is in accordance with XRD analysis (Fig. 3)
2.4.3 Textural properties of catalysts
Depending on the nature of the M element (Ni or Co), the specific surface varied. The highest surface is observed for the NiMoO4 sample (37 m2/g), both samples CoMoO4 and Ni0.5Co0.5MoO4 showed a similar specific area (14–17 m2/g).
For all samples, the adsorption isotherms (Fig. 5) are close to type IV and seemed to be a composite of type IVa and type IVb isotherms as suggested by Rouquerol and Sing [41], they are characteristic of mesoporosity (2.5–50 nm). The three samples displayed a H3 hysteresis behavior according to IUPAC classifications confirming the presence of mesopores open at both ends. Generally, the H3 hysteresis behavior was observed for solids contain aggregates or particle agglomerations. For our systems, the loops closed at the same relative pressure (at P/P0 ∼ 0.7) which confirms the mesoporous nature of the samples. The average pore radius was determined from the adsorption branch of the isotherm. The mean average pore radius (Evaluated by BJH method) for NiMoO4, Ni0.5Co0.5MoO4 and CoMoO4 synthesized samples was found to be 21; 16 and 14 nm, respectively (Table 2). The values gathered in Table 2 clearly show the effect of M (Ni or Co) on the textural properties of catalysts.
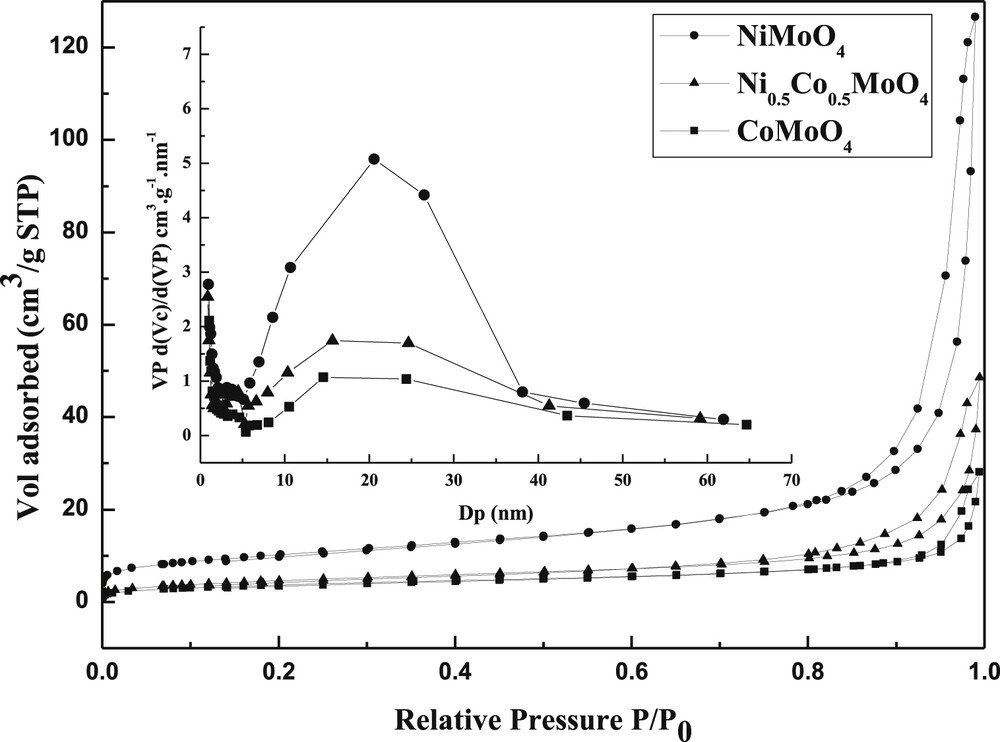
Nitrogen adsorption–desorption isotherms of samples prepared by the modified co-precipitation method.
The surface properties were evaluated by XPS analysis and the obtained results are gathered in Table 3. The experimental atomic surface ratios are compared to the theoretical ones (corresponding to the bulk composition). The binding energies of the various elements were found in the following ranges: 856.7–855.8 eV for 3Ni2p, 781.9–781.0 eV for 3Co2p, 232.5–233.0 eV for 1Mo3d and 5Mo3d, these values indicate that all these elements appear only with their normally expected oxidation states: Ni(II), Co(II) and Mo(VI) [42].
Binding energies (BEs, eV), atomic percentages and atomic ratios obtained from XPS experiments performed on molybdenum-based catalysts.
| Catalyst | Mo6+ | Ni2+ | Co2+ | Ni + Co/Mo | |||||
| 3Mo3d | 5Mo3d | Ni2p | Co2p | ||||||
| BE (eV) | At.% | BE (eV) | At.% | BE (eV) | At.% | BE (eV) | At.% | ||
| NiMoO4 | 232.4 | 18.4 | 232.5 | 18.5 | 855.8 | 41.5 | – | – | 1.1 |
| Ni0.5Co0.5MoO4 | 232.0 | 20.6 | 232.2 | 20.6 | 856.7 | 17.9 | 781.9 | 18.1 | 0.9 |
| CoMoO4 | 232.5 | 22.8 | 232.7 | 22.7 | – | – | 781.2 | 33.8 | 0.7 |
The results showed that the surface composition depends on the nature of the metal. For NiMoO4 sample, the experimental atomic ratio (Ni/Mo = 1.1) is slightly larger compared to the stoichiometric value (Ni/Mo = 1) indicating a slight excess of nickel on the surface. In contrast, for samples Ni0.5Co0.5MoO4 (Ni + Co)/Mo = 0.9) and CoMoO4 (Co/Mo = 0.7) a smaller atomic ratios was observed reflecting an excess of molybdenum on the surface.
According to the values of atomic ratios obtained by AAS and XPS, the surface composition of NiMoO4 and Ni0.5Co0.5MoO4 was very close to the bulk composition, meaning that both catalysts present a better homogeneity compared to CoMoO4.
2.4.4 Reducibility of catalysts by H2-TPR
The H2-TPR profiles of MMoO4 and mixed Ni–Co molybdateare are shown in Fig. 6.Our samples exhibited similar H2-TPR profiles (Fig. 6) but at different temperatures of reduction and the same total amount of H2 consumption (≈20 mmol/g) (Table 4). According to Pillay and Friedriche [43] the reduction of MMoO4 proceeds in several steps depending on the particle size, the surface composition and on operating parameters like the heating rate[44]. First Ni2+ and Co+2 are reduced to metallic Ni and Co, respectively. Then, a part of Mo+6 is reduced to Mo+5 to form . As the temperature continues to increase, is further reduced to Mo+4 and Mo0 via a MoO2 intermediate. In our case, the TPR of NiMoO4 sample revealed three neat reduction peaks with a maximum consumption of H2 at ca. 335, 560 and 757 °C, which likely corresponded to the reduction of most Ni2+ species (335 °C) and of Mo5+ to Mo+4 (560 °C) and Mo0 (757 °C), respectively. A shoulder, observed at 500 °C, could be attributed to the reduction of Mo+6 to Mo+5 via a intermediate. In the case of CoMoO4 sample, two principal peaks are observed but at higher temperatures (602 and 869 °C) compared to NiMoO4. The first one could be associated with the reduction of Co to Co° and a part of Mo+6 to Mo+5 and the second peak to the formation of metallic Mo. The reduction of Mo species together with the reduction of Co at 602 °C is in good agreement with XPS results which showed a surface richer in Mo species for CoMoO4 solid (Table 3). The shoulders observed at 689 and 775 °C are attributed to the reduction of another part of Mo+6 and Mo+5 respectively. In the case of Ni0.5Co0.5MoO4, the reduction occurs in two-stages with two main reduction peaks at lower temperatures (ca. 572 and 821 °C) compared with CoMoO4. The first peak (at 572 °C) may correspond to the reduction of Co+2 to Co° and Mo+6 to Mo+5 and the second (at 821 °C) to the reduction of Mo+4 to metallic Mo. In this profile, two shoulders were evidenced: the first (at ca 457 °C) could be attributed to the reduction of Ni species and the second (at ca 769 °C) to the reduction of Mo+5 to Mo+4.

Temperature programmed reduction profiles of samples heated at 550 °C.
Steps of reduction and quantitative H2-TPR of molybdenum-based catalysts.
| Samples | 1rst step of reduction | 2end step of reduction | ||
| Temperature at maximum (°C) | Consumption of H2 (mmol/g) | Temperature at maximum (°C) | Consumption of H2 (mmol/g) | |
| NiMoO4 | 560 | 15.1 | 757 | 5.3 |
| Ni0.5Co0.5MoO4 | 572 | 10.9 | 821 | 9.3 |
| CoMoO4 | 602 | 11.8 | 869 | 7.8 |
As observed in the literature, the presence of nickel and/or cobalt has a significant effect on the reduction of Mo species, compared with MoO3 and NiO[45] or CoO[46]alone. Although Zhang et al studied separately the reducibility of NiO and MoO3, the profile of MoO3 showed three peaks. The first one at 640 °C was due to the reduction of Mo+6 to Mo+5. The peak at 680 °C attributed to the reduction of Mo+5 to Mo+4 species was confirmed by several studies [43,47–48]. The consumption of H2 above 750 °C was associated with the reduction of Mo+4 to metallic Mo [48]. For the reduction of NiO, the consumption of H2 around 380 °C was attributed to the conversion of Ni+2 to Ni°[45].
2.4.5 Catalytic activity
The ODH of ethane was carried out at 550 and 600 °C while varying W/F from 0.06 to 0.24 g.s/cm3 by varying the dilution of the catalyst bed by SiC. First, the possible contributions of the quartz reactor and of SiC were examined. The conversion of ethane was null in the empty reactor and less than 1% when filled with SiC. The use of SiC as a diluent ensures good dispersion of the active phase, limits the formation of agglomerates, but also enhances the heat transfers, thus limiting possible runaways.
The ethane conversion and selectivity to ethylene are plotted against the reaction temperature in Figs. 7 and 8. Ethylene and COx were the only products detected. The conversion of ethane increased with the temperature of the reaction while the selectivity in ethylene slightly decreased. Such decrease is more important for NiMoO4 than CoMoO4 or Ni0.5Co0.5MoO4. This result indicates that the high reaction temperature favors total oxidation.
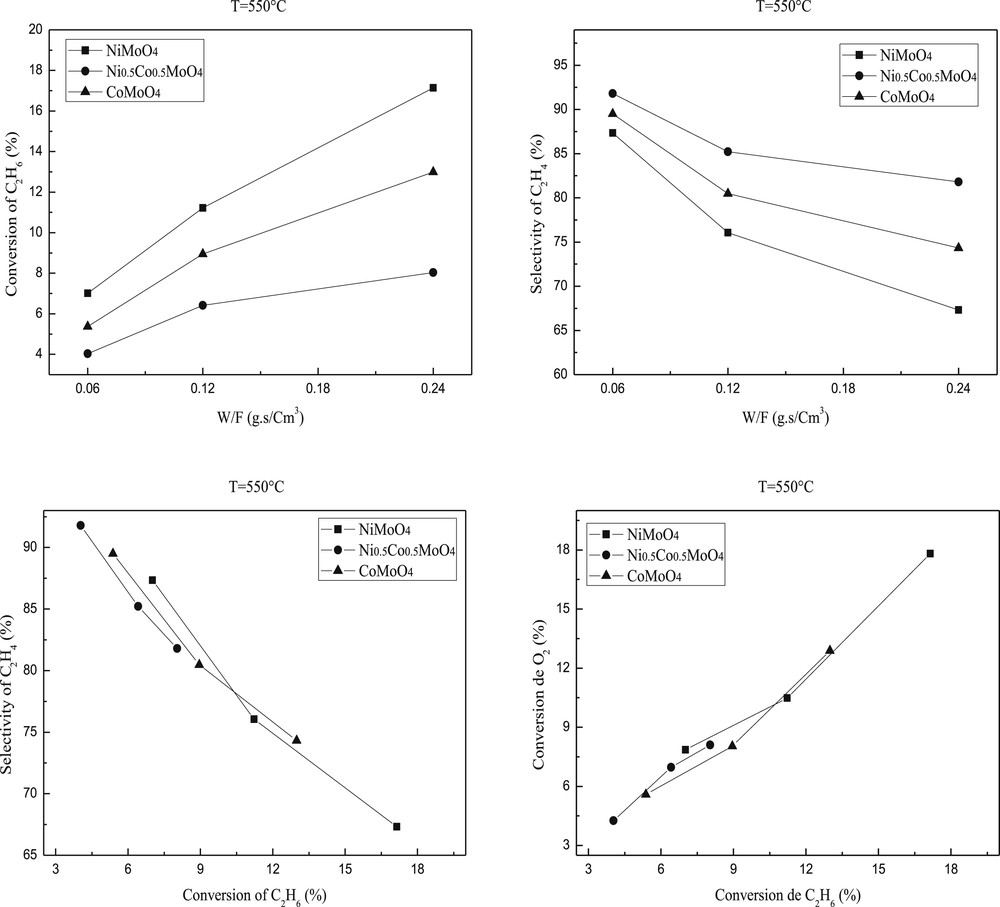
Ethane conversion and ethylene selectivity over molybdenum based catalysts. Reaction conditions: T = 550 °C; C2H6/O2 = 1; W/F = 0.06–0.24 g.s/cm3.
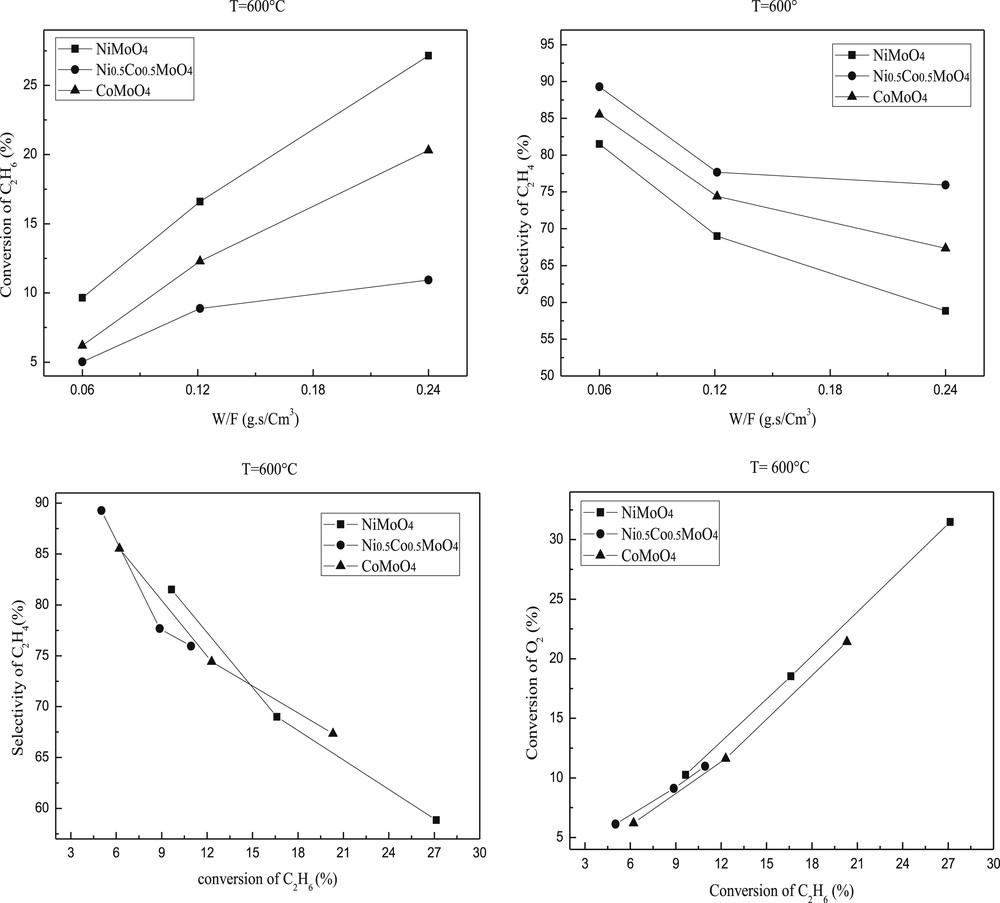
Ethane conversion and ethylene selectivity over molybdenum based catalysts. Reaction conditions: T = 600 °C; C2H6/O2 = 1; W/F = 0.06–0.24 g.s/cm3.
The catalytic results showed that the introduction of the second metal into the MMoO4 (M=Ni or Co) structure leads to the decrease of catalytic activity. Indeed, the ethane conversion over the mixed modified oxide Ni0.5Co0.5MoO4 is lower than those observed on NiMoO4 or CoMoO4 catalyst but the selectivity increased significantly (Figs. 7 and 8). These results are in accordance with those observed by H. Zhu et al. [49]. The apparent catalytic activities of these catalysts decreased along NiMoO4 > CoMoO4 > Ni0.5Co0.5MoO4. The best activity of NiMoO4 is in accordance with (i) its higher surface area (ii) a lower temperature reduction and (iii) a higher dispersion of Ni active species as shown by the difference between the atomic M/Mo ratios determined by XPS and AAS.
The higher Ni/Mo and the lower Co/Mo ratios, observed for NiMoO4 and CoMoO4 solids, respectively, show that the molybdenum is not the active phase in ODH of ethane, and it means that the nickel, mainly localized on the NiMoO4 surface, represents the most active phase in alkane transformation [49]. The lower activity in mixed catalysts (Ni0.5Co0.5MoO4) may be mainly associated with their TPR properties. As stated above, the reduction temperature of this catalyst shifts towards a high temperature as compared to that in pure NiMoO4. This results in a hindrance of the first step of ethane ODH (reduction of the catalyst surface) in transition metal composites while this step is generally considered to be a limiting factor in ethane ODH. Also, the decreased activity of these metals added to MMoO4 could be due to the coverage and decrease of active sites on the catalyst surface by another layer of the transition metal, which is confirmed in the case of Ni0.5Co0.5MoO4 catalyst. It was showed that the synergetic interaction of MMoO4 with other metal oxides such as Ni or Co could alter the properties of MMoO4 based materials [34].
Since CoMo is a well-known catalyst for converting light alkanes [50–52], it is possible that the stoichiometric compound or a molybdenum-rich composition thereof provides for facile adsorption of ethane, the first formed product of ethane conversion, forming ethylene, which readily converts further to COx under the conditions used in the study. In addition, the chemisorbed ethylene can inhibit the interaction of the ethane with the surface, resulting in self-poisoning of the surface and hence lower rates of ethane activation. These issues, including a comprehensive analysis of ethane activation kinetics over molybdates, have already been discussed [53].
The study according to the contact time showed that 0.24 g.s/cm3 contact time gives higher conversion, in contrast, the reaction in 0.12 and 0.06 g.s/cm3 contact times provides higher ethylene selectivity (Figs. 7 and 8) mainly in the case of Ni0.5Co0.5MoO4 .
The ethylene selectivity is not only dependent on the reaction temperature but also on the ethane conversion as illustrated in Figs. 7 and 8 at 550 and 600 °C, respectively. The performance of pure MMoO4 (bimetallic sample) is used as a reference. Clearly, the Ni0.5Co0.5MoO4 catalysts have higher selectivity than that of pure MMoO4 in the ethane conversion below 18 and 27%. The enhanced selectivity of the NiMoO4 catalyst can be achieved only at low ethane conversion, and the high selectivity drops to the level below that of MMoO4 when the conversion is above 12%. The selectivity of the NiMoO4 catalyst is quite close to that of CoMoO4 in the whole range of conversion we studied. Scheme 1 shows the simplified reaction pathway over these catalysts. It is admitted that the selectivity to ethylene is a function of the k1/k2 ratio at low ethane conversion rates, while it should be dependent on the k1/(k2 + k3) ratio at high ethane conversions. The results in Figs. 7 and 8 suggest that both step 2 and step 3 are favored in NiMoO4 and CoMoO4 catalysts, in which the selectivity decreases strongly with increasing conversion. By contrast, the ethylene combustion rate seems negligible in Ni0.5Co0.5MoO4 catalysts, and a stable ethylene selectivity is obtained even at high ethane conversion.
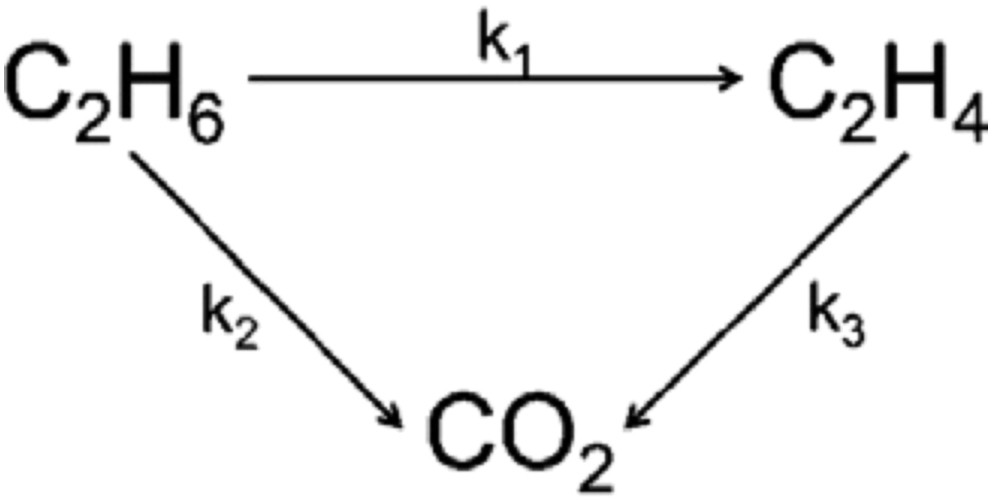
Catalytic reaction pathway of C2H6 oxidation over the catalysts.
3 Conclusion
Ni and/or Co-molybdate based catalysts have been successfully synthesized by a modified co-precipitation method. In all cases, pure systems contained α or β phases without any impurities. Both α-NiMoO4 and α-Ni0.5Co0.5MoO4 are stable up to 700 °C, in contrast β-CoMoO4 is stable at room temperature. In accordance with thermal analysis performed by ATG-TD, the mixed Ni and Co molybdate is more stable compared to NiMoO4 or CoMoO4. The incorporation of a second metal in the MMoO4 structure has a significant effect on the structure, the texture, the reducibility and the catalytic properties for oxidative dehydrogenation of ethane. The combination of Ni and Co species in the same molybdate structure modified the reduction temperature. The Mo species can be reduced before or at the same temperature compared to the Co element because of their localization on the CoMoO4 surface (XPS analysis). In the operating conditions, the highest conversion is observed for the NiMoO4 catalyst without any prior pre-treatment. At 600 °C, the conversion of ethane reached 28% but the highest selectivity in ethylene is observed for the mixed oxide Ni0.5Co0.5MoO4 (∼92%). The higher conversion obtained in the NiMoO4 system is in accordance with (i) the higher surface area (ii) the lower temperature reduction and (iii) the higher dispersion of Ni species as shown by the negligible difference between the atomic Ni/Mo ratio determined by XPS and AAS analysis for the NiMoO4 sample.
Acknowledgments
Sonatrach, Chevreul Institute (FR 2638), Ministère de l'Enseignement Supérieur et de la Recherche, Région Nord–Pas-de-Calais and FEDER are acknowledged for supporting and funding this work.