

1 Introduction
The fast-developing velocity map imaging (VMI) technique is increasingly used in molecular beam experiments on gas-phase polyatomic reactions. VMI is particularly interesting for reactions leading to two molecules [1–6], for it makes the accurate measurement of the angle-velocity distribution for a given quantum state of one of the two products possible. This pair-correlated angle-velocity distribution allows us to probe the dynamics of polyatomic processes at an amazing level of details, generally possible only for triatomic reactions before the invention of VMI. Consequently, this distribution is emerging as one of the most important experimental data on gas-phase chemical reactivity. In the present work, we mainly focus our developments on the theoretical description of the pair-correlated velocity distribution (PCSD), deduced from the previous density by integration over the angle. It should be noted that at the moment, this distribution appears to have been much more often measured than theoretically predicted [7–11]. There is thus an important gap to be filled. We also briefly approach the more complex issue of the calculation of the pair-correlated angular distribution.
We shall perform our study within the framework of the reactions OH+CH4→H2O+CH3 and OH+CD4→HOD+CD3, studied ten years ago by Zhang et al. [12–14] using the previous techniques. These seven-atom reactions leading to two polyatomic products are among the largest bimolecular processes considered to date in this type of experiment. By varying both the collision energy and the probed quantum state of the CH3/CD3 radical, they could obtain accurate informations on the subtle way the vibrational state distribution of the co-fragment H2O/HOD and the angular distribution may evolve.
If a qualitative interpretation of such results is possible from simple physical and chemical arguments, their quantitative analysis requires the development of theoretical models capable of accurately reproducing them. These models can then be used for detailed understanding of the dynamics. They can also represent (inexpensive) alternative approaches to predict data needed by atmospherical chemists and astrophysicists in order to model planetary atmospheres [15] and interstellar clouds [16], respectively.
The previous reactions take place in the electronic ground state. The first step of their accurate theoretical description requires performing ab-initio electronic structure calculations and using fitting procedures to construct the corresponding potential energy surface (PES) [17,18]. This work has recently been performed by two of us [19]. The surface obtained was called PES-2014. Note that the latter takes into account the full dimensionality of the system, i.e. 15 (reducing the dimensionality generally makes far easier the construction of PESs, but this may induce artificial dynamical behaviors ; treating a molecular collision in its full-dimensionality is often preferable). The second step of the simulation consists in moving nuclei in the previous PES. Ideally, one would like to do it quantum mechanically [20,21], and exactly. For the title reactions, however, the basis sizes necessary to converge quantum scattering calculations are huge, thus leading to exceedingly large computation times. The alternative is to classically move nuclei, a method traditionally called the quasi-classical trajectory method (QCTM) [22,23]. However, it is known that in the case where only a few vibrational states are available to the products, as is often the case when VMI is used, velocity distributions should preferably be estimated only from those classical trajectories ending in the products with integer vibrational actions, i.e. satisfying Bohr's quantization principle in the separated products [24]. During the last decade, the QCTM in this old quantum spirit proved to lead to very satisfying predictions as compared to exact quantum scattering calculations or experimental measurements [24]. This approach has been recently used by two of us [19,25] in order to reproduce some of the measurements of Liu and co-workers. In the present work, we focus on those obtained for a collision energy of ∼10 kcal/mol published in Refs. [12] and [14].
The corresponding QCTM results semi-quantitatively reproduced experimental evidence [19,25], which is already quite satisfying given the size of the processes under scrutiny. In particular, the theoretical vibrational state distributions of the co-fragment H2O/HOD were found to be in good agreement with the experimental ones [25]. On the other hand, the predicted speed distributions associated with given vibrational states of the co-fragment tend to be broader than their measured counterparts and not always well located [25]. As a consequence, the PCSD obtained by summing the previous densities appears to partially or totally loose the structures seen in the experimental PCSD [12,14] (see Section 2.3). Without any further calculations, one might attribute these discrepancies to a possible lack of accuracy of the PES-2014, but we shall see that this is not the case. The goal of the present note is indeed to show that the previous disagreement can be significantly reduced by adding a few more constraints to the analysis of QCTM results so as to better comply with the restrictions imposed by VMI. In Section 2, these changes are detailed within the framework of the OH+CD4 reaction, and comparison between the predictions of the new analysis and measurements is made for both title processes. We end up this section discussing the high numerical cost of the pair-correlated angular distribution (PCAD), as compared to the PCSD. We conclude in Section 3.
2 Calculations
2.1 Trajectories
We used the VENUS code [26] to run 106 trajectories on the PES-2014 for each process. Full computational details on these calculations can be found in refs. [19,25] (note that in these previous studies, only 105 trajectories were run for each reaction). As far as OH+CD4→HOD+CD3 is concerned, 90,646 trajectories turned out to be reactive. The product quantities involved in the next developments are the vibrational energy of CD3, its rotational energy , the vibrational energy of HOD, its rotational energy , the vibrational actions a1, a2 and a3 associated with the symmetric stretching, antisymmetric stretching and bending vibrational modes of HOD, respectively, the relative translational energy Etrans between HOD and CD3, the speeds (with algebraic sign) v of CD3 and v′ of HOD within the center-of-mass system, and the scattering angle θ. The VENUS code provides directly all these quantities except the actions and the velocities. The actions are obtained by means of the normal-mode analysis (NMA) method [27], which includes anharmonicity and Coriolis-coupling terms. The velocities are deduced from Etrans as follows; the total linear momentum within the center-of-mass system being zero, we have
| (1) |
| (2) |
From the two previous equations, one obtains
| (3) |
This velocity is the one measured by Zhang et al. using the VMI techniques [12–14].
2.2 Vibrational state populations
The vibrational state of HOD is denoted (n1, n2, n3). These quantum numbers are associated with the same vibrational modes as the previous actions (a1, a2, a3). The corresponding frequencies are ω1, ω2, and ω3 (their values are given in Ref. [25]). The population of state (n1, n2, n3) is denoted as . In the experiments of Zhang et al. [12–14], frozen reagents meet with a collision energy of ∼10 kcal/mol (among others) and P(v) is measured for CD3 in its vibrational ground state and its lowest rotational levels (N ≤ 5) [3]. The rotational energy of the probed CD3 is thus lower than ∼1 kcal/mol. Three vibrational states are found to be available to HOD (at a collision energy of 10 kcal/mol, to be exact [12]). These states are (1,0,0), (1,0,1) and (2,0,0), by increasing the order of energy.
We shall now estimate their populations from the reactive trajectory results. Since these results are in much larger amount than in Refs. [19,25], the present method will better cope with the constraints imposed by the VMI techniques than before. These constraints will be taken into account as follows:
- (i) the zero point energy (ZPE) of CD3 is kcal/mol. We assume that all the trajectories violating the ZPE, i.e. such that , do not contribute to the reactivity. We thus discard them from the statistics.
- (ii) the energy of the first excited vibrational state of CD3 is 14.9 kcal/mol [25], corresponding to one quantum in the lowest umbrella mode of CD3 (396 cm−1 or 1.1 kcal/mol) above the ZPE. Calling δ the previous quantum, the intermediate energy between the two previous energies is . We now assume, in the spirit of standard binning (SB) [24], that all the trajectories leading to do not contribute to the vibrational ground state of CD3 probed by Zhang et al. [12–14], and should thus be ignored.
- (iii) finally, we also reject all the trajectories leading to .
In Fig. 1, the cloud of points of coordinates is represented for the 90,646 reactive trajectories. Gray/red points correspond to rejected/accepted trajectories. Only 722 paths turn out to be useful, thus representing only ∼0.07% of the whole set of calculated trajectories. This clearly illustrates the fact that simulating polyatomic reactions studied by VMI is numerically demanding, even with the QCTM.
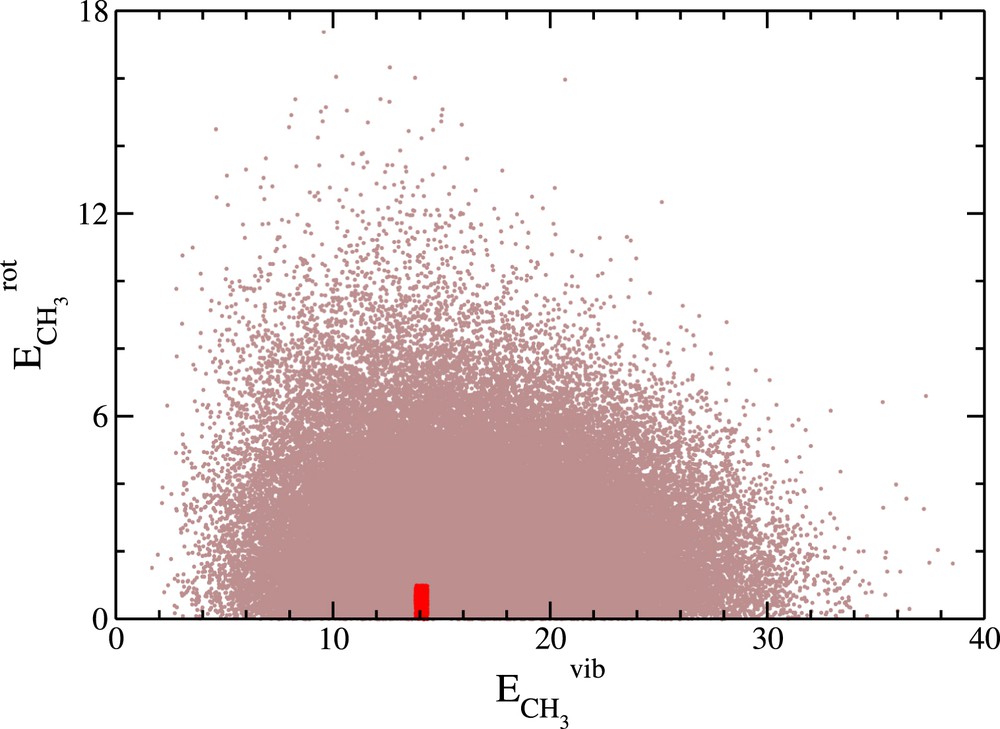
Cloud of points of coordinates for the 90646 reactive trajectories relative to the OH+CD4 reaction. Gray points correspond to the rejected trajectories (89,924) while red points correspond to the accepted ones (722) from which the vibrational state populations and the pair-correlated speed and angular distributions will be constructed.
A purely classical treatment of vibrational motions is realistic when many vibrational states (ideally, several tens) are available to the products. In the present case, however, only three vibrational states of HOD are found to be populated [12] and it is preferable, as stated in the introduction, to take into account Bohr's quantization principle in the analysis of the final trajectory results [24]. For polyatomic molecules, this is usually done by means of the energy-based Gaussian binning procedure, often called the 1GB procedure [24,25,28–31]. The latter puts strong emphasis on those trajectories leading to HOD with its classical vibrational energy close to one of the quantum energies of the available vibrational states. In practice, the 1GB estimation of is performed as follows: we consider the set of trajectories for which , where is the nearest integer of ai, i = 1, 2 or 3. In other words, trajectories for which (a1, a2, a3) does not belong to the unit cube centered at (n1, n2, n3) are rejected. This selection is common to both the 1GB and SB procedures. However, contrary to SB which assigns the democratic unit weight to each trajectory, the 1GB weight, within the harmonic treatment of HOD vibrational motions, is given by
| (4) |
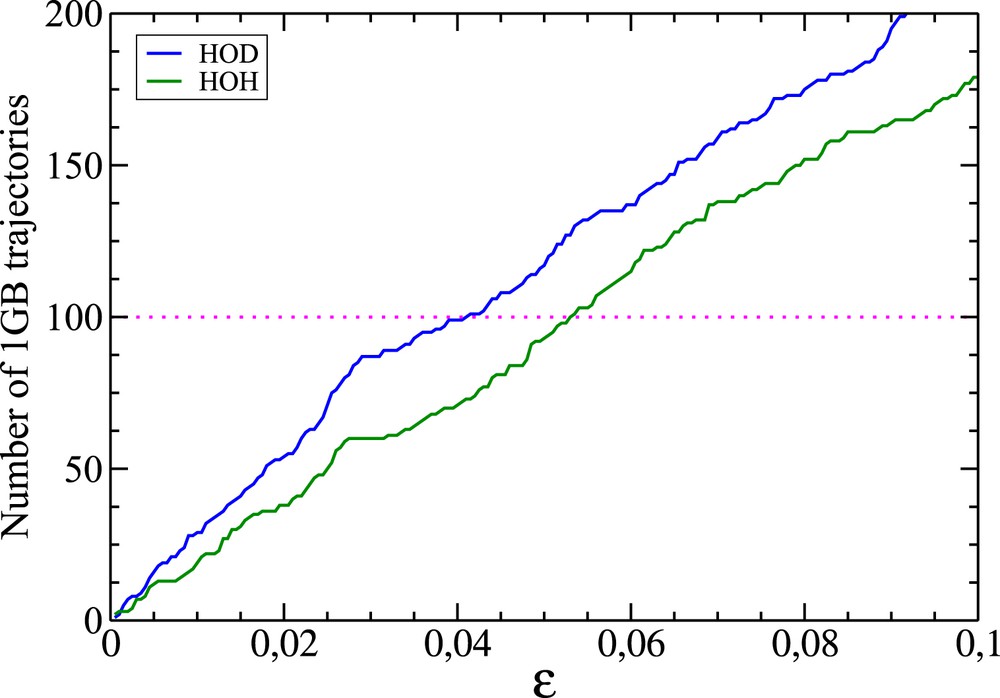
Variation in terms of ɛ of the number of 1GB trajectories effectively contributing to the 1GB populations. These paths have been identified as those for which the 1GB statistical weight is larger than 0.5 (see Eq. (4)). The blue and green curves correspond to the OH+CD4 and OH+CH4 reactions, respectively. The magenta dotted line shows that the values of ɛ for which 100 paths contribute to the previous processes are slightly larger than 0.04 and 0.05, respectively (their exact values are 0.041 and 0.053).
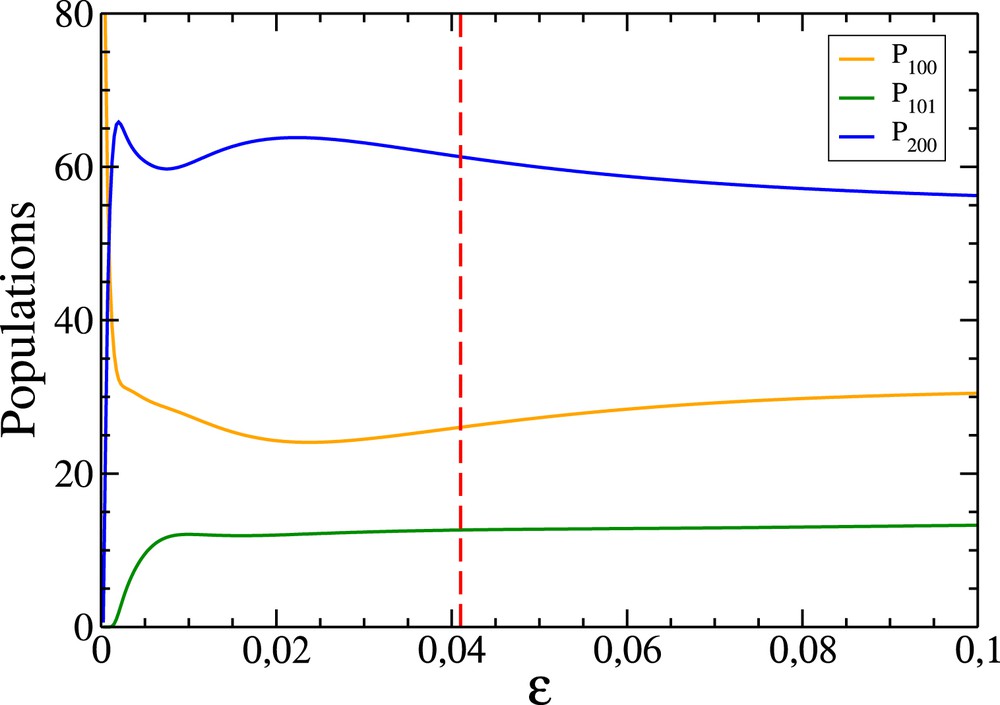
1GB vibrational state populations (in percentage) of the product HOD of the OH+CD4 reaction in terms of ɛ. The vertical red dashed line corresponds to the value of ɛ (0.041) such that 100 trajectories effectively contribute to the populations.
Constraints (i) and (ii) define an energy-based windowing, which is related somehow to SB and 1GB [24,28–31]. The main difference is that the former procedure takes into account paths for which the nearest integers of the vibrational actions of CD3 are non 0, contrary to the latter. This is probably a bit less physical, but significantly increases the number of trajectories contributing to the populations, in addition to avoiding the determination of the six vibrational actions of CD3.
In order to improve the statistics, we also made calculations with the maximum value of kept at 2 kcal/mol (instead of 1 kcal/mol), but this affected the accuracy of the vibrational state populations. Moreover, this artificial shift, whenever used, should be as small as possible, since it allows for more energy channeled into the rotational motion of CD3, at the expense of its translation motion. This is expected to shift the speed distribution towards small velocities.
2.3 Pair-correlated speed distribution
The contribution of state (n1, n2, n3) to the PCSD P(v) is denoted as . This quantity will be normalized to unity. From the previous developments, we have
| (5) |
We now concentrate on the calculation of P100(v), P101(v) and P200(v). We use the same constraints on the rovibrational energy of CD3 as previously used. Like , should better be calculated in a quantum spirit. In order to illustrate this, we first focus on the most probable state (2,0,0) and calculate P200(v) in the standard following way ignoring any quantization: we apply the SB procedure, i.e. we focus on trajectories for which (a1, a2, a3) belongs to the unit cube centered at (2,0,0). We then divide in 80 equal intervals the range [0.5, 2.5] comprising the velocities measured in km/s [12] and count the number of trajectories per interval (the resulting curve is made of points separated by 0.025 km/s, thus leading to a satisfying resolution). The resulting SB distribution, normalized to unity, is represented by the blue curve in Fig. 4, to be compared with the magenta experimental curve [12]. The SB curve appears to be much broader than the magenta curve. We thus calculate P200(v) by means of the 1GB procedure, following the same route as above, with the difference that trajectories are now assigned 1GB weights with ɛ = 0.041 (see Eq. (4)) instead of unit weights. The resulting distribution is given by the green curve in Fig. 4. The agreement with the experiment appears to be much more satisfying than for the SB procedure. Moreover, we repeat this calculation with ɛ = 0.022 (not shown) and observe that despite more irregularities in P200(v) due to worse statistics, its width is nearly unchanged. The distribution at ɛ = 0.041 is thus expected to be close to its extrapolation at ɛ = 0. The analogous distributions for the states (1,0,1) and (1,0,0) are displayed in Figs. 5 and 6. As a matter of fact, the 1GB distributions are slightly shifted towards the large velocities, revealing some inaccuracies in the theoretical treatment. The three distributions, weighted by their corresponding 1GB vibrational state populations, are represented in Fig. 7 by the blue, green and orange curves for the (2,0,0), (1,0,1) and (1,0,0) states, respectively. Summing them up leads to P(v) (see Eq. (5)).
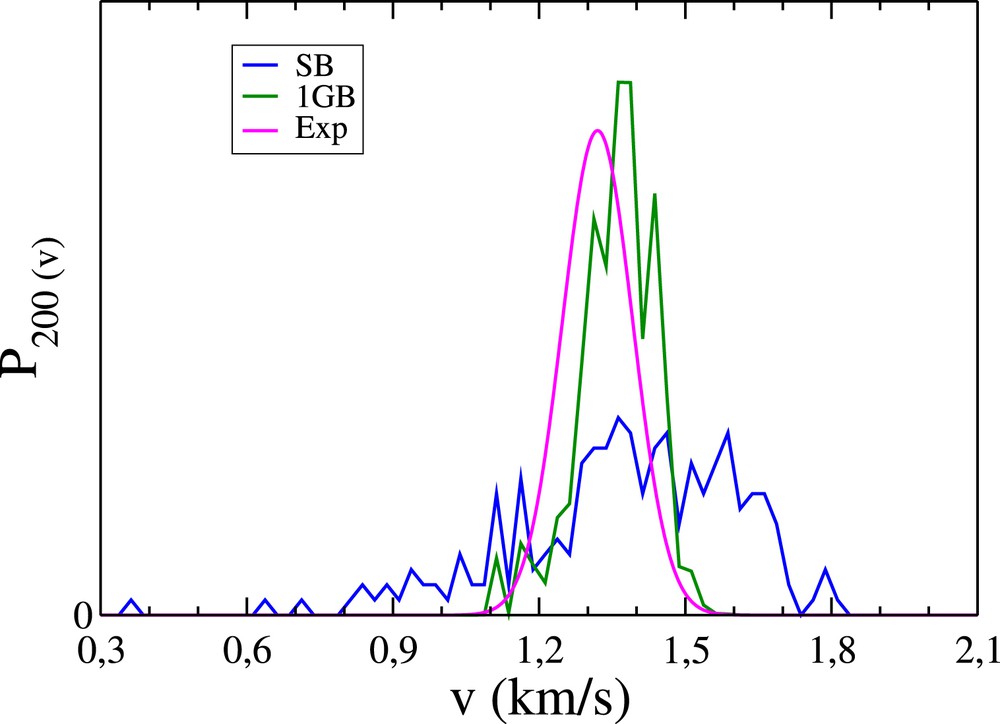
Contribution of the state (2,0,0) to the pair-correlated speed distribution for the OH+CD4 reaction. Blue curve: P200(v) obtained from QCTM calculations and the SB procedure. Green curve: same as previously obtained with the 1GB procedure. Magenta curve: corresponding experimental distribution of Zhang et al. (see Fig. 2a in Ref. [12]).

Same as Fig. 4 for (1,0,1).
Same as Fig. 4 for (1,0,0).
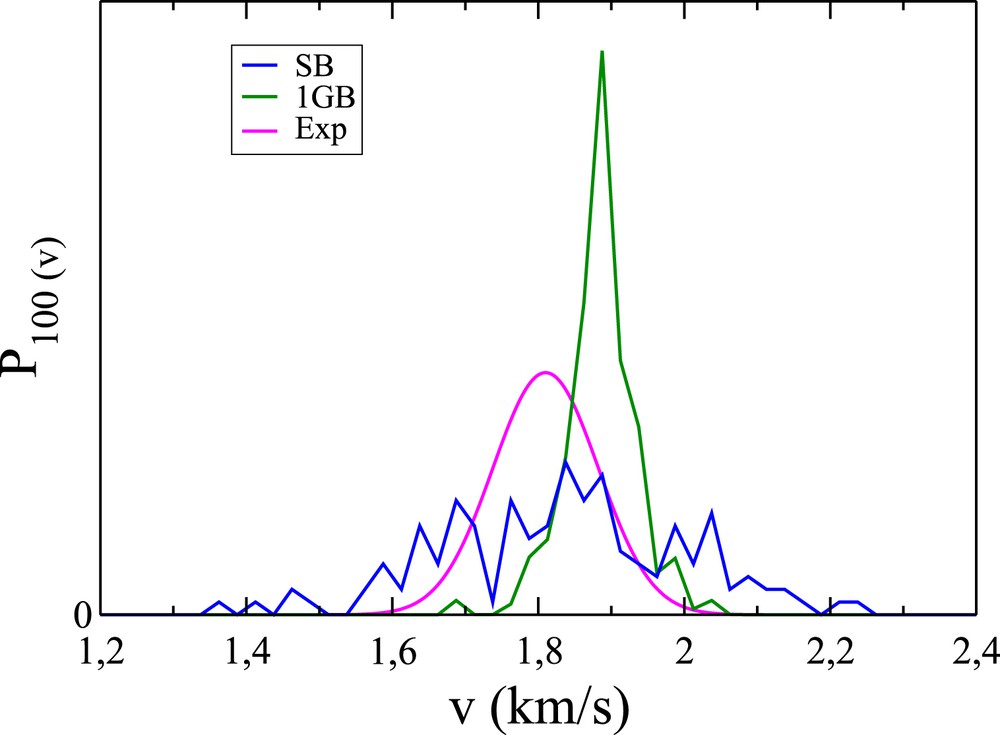
Pair-correlated speed distributions for the OH+CD4 reaction. Blue, green and orange curves: weighted 1GB distributions p200P200(v), p101P101(v) and p100P100(v), respectively. Red curve: full 1GB distribution obtained from a convolution of the sum of the previous quantities (see Eq. (6)). Magenta curve: experimental distribution of Zhang et al. (see Fig. 2a in Ref. [12]).
At this point, a comment on the experimental measurement of P(v) is in order. In a hypothetical experiment where both reagents would be in the rovibrational ground state and the collision energy would be perfectly controlled, the total energy available to the products would take the same value for the whole set of reactions detected. Since Etrans is equal to the previous energy minus the quantized internal energy of the products, Etrans would also be quantized. Consequently, P(v) would be given by a set of Dirac peaks with given weights. In our calculations, however, we pseudo-quantize the vibration motion through the 1GB procedure, but not the rotation motion. P(v) is thus a rough approximation of what would be observed if the measurement of the final velocities were introducing a blurring of the peaks slightly exceeding the average rotational spacing between them. In real experiments, however, the blurring is much larger, for the collision energy and the reagent rotational states are not fully controlled and VMI itself significantly contributes to the blurring. We thus take this into account in the calculation of the PCSD through the Gaussian convolution
| (6) |
The value of η is chosen so as to reproduce as satisfyingly as possible the experimental speed distribution at the threshold and cut-off. With η kept at 0.08, one obtains the red curve in Fig. 7, to be compared with the experimental one (magenta curve), extracted from Fig. 2a of Ref. [12]. The convolution is welcome, as a million trajectories is not enough to get a smooth P(v). Without blurring, good agreement between experiment and theory would likely be beyond reach. Compared with the previous predictions, displayed in the lower left panel in Fig. 2 of Ref. [25], the PCSD is clearly improved. In particular, when summing up the three bells in the previous figure, only two bumps are found, instead of the three bumps observed both in the experimental and present theoretical results.
As far as the OH+CH4 reaction is concerned, five states of H2 O are found to be available (at a collision energy of 10.2 kcal/mol, to be more precise [14]). These states are (0,0,1), (0,1,0), (1,0,0), (0,1,1) and (1,0,1), by increasing the order of energy. We checked that the harmonic normal mode description of water vibrations is very satisfying for the energies of the previous states. For the PES-2014, the vibrational frequencies of the OH stretching, OH∗ stretching and HOH bending are ω1 = 3806, ω2 = 3762 and ω3 = 1651 cm−1, respectively. Moreover, the ZPE of CH3 is 18.8 kcal/mol, and the lowest umbrella frequency is 510 cm−1 or 1.5 kcal/mol. The same type of calculation as before has been performed. Over 106 trajectories run on the PES-2014 [19,25], 123567 are found to be reactive, and 1013 comply with the three constraints imposed by VMI. The dependence of the 1GB populations on ɛ is displayed in Fig. 8. The region of statistical confidence roughly lies on the right side of the red dashed line, defined by ɛ = 0.053. By linearly extrapolating the 1GB populations from ɛ = 0.053 down to 0, we arrive at p001 = 6, p010 = 53, p100 = 19, p011 = 10 and p101 = 12%. The speed distributions P001(v), P010(v), P100(v), P011(v) and P101(v) weighted by the previous populations are represented in Fig. 9. With η kept at 0.09, Gaussian convolution of the sum of these densities leads to the PCSD represented by the red curve in Fig. 9, to be compared with the experimental magenta curve extracted from Fig. 2a of Ref. [14]. Note that states (1,0,1) and (0,1,1) have similar energies, so the speed distributions associated with these states overlap (see the blue curves in Fig. 9). This comment holds for states (1,0,0) and (0,1,0) (see the green curves in Fig. 9). This is the reason why the vibrational populations deduced from the speed distributions were previously denoted for states (1,0,1) and (0,1,1), for states (1,0,0) and (0,1,0) and p001 [25]. From the present calculations, , and p001 = 6 (see above), to be compared with the experimental populations, i.e. , and p001 = 6 [14]. Like previously observed, the PCSD is clearly improved as compared with its previous estimation, displayed in the upper left panel in Fig. 2 of Ref. [25]. In particular, when summing up the three bells in the previous figure, a single bell is found, instead of the three bumps observed both in the experimental and present theoretical results.
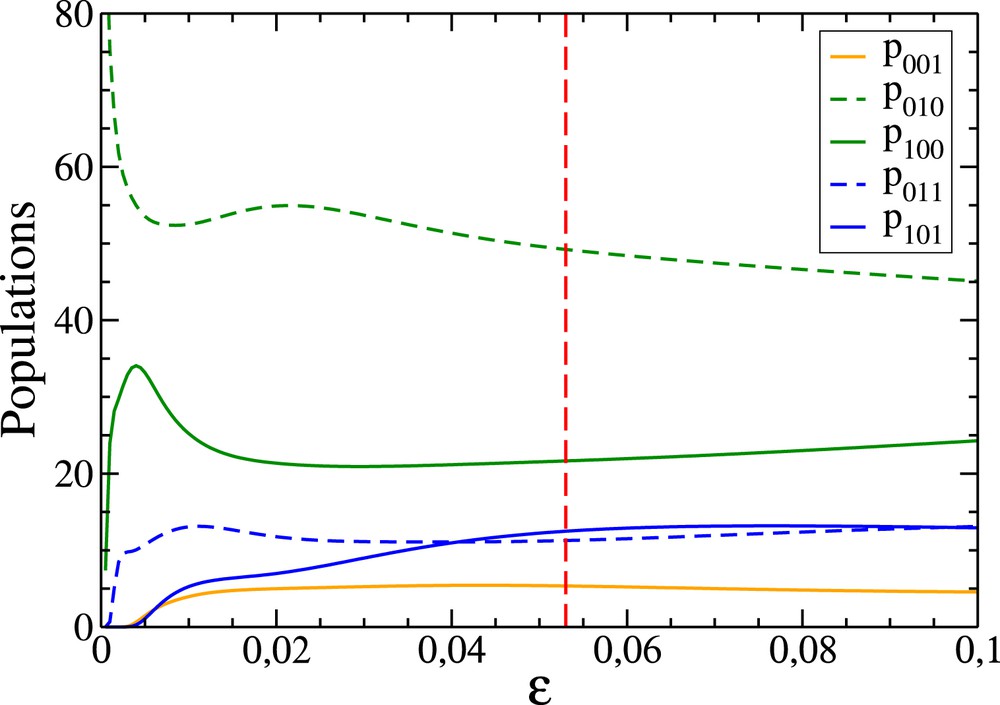
1GB vibrational state populations (in percentage) of the product H2O of the OH+CH4 reaction in terms of ɛ. The vertical red dashed line corresponds to the value of ɛ (0.053) such that 100 trajectories effectively contribute to the populations.
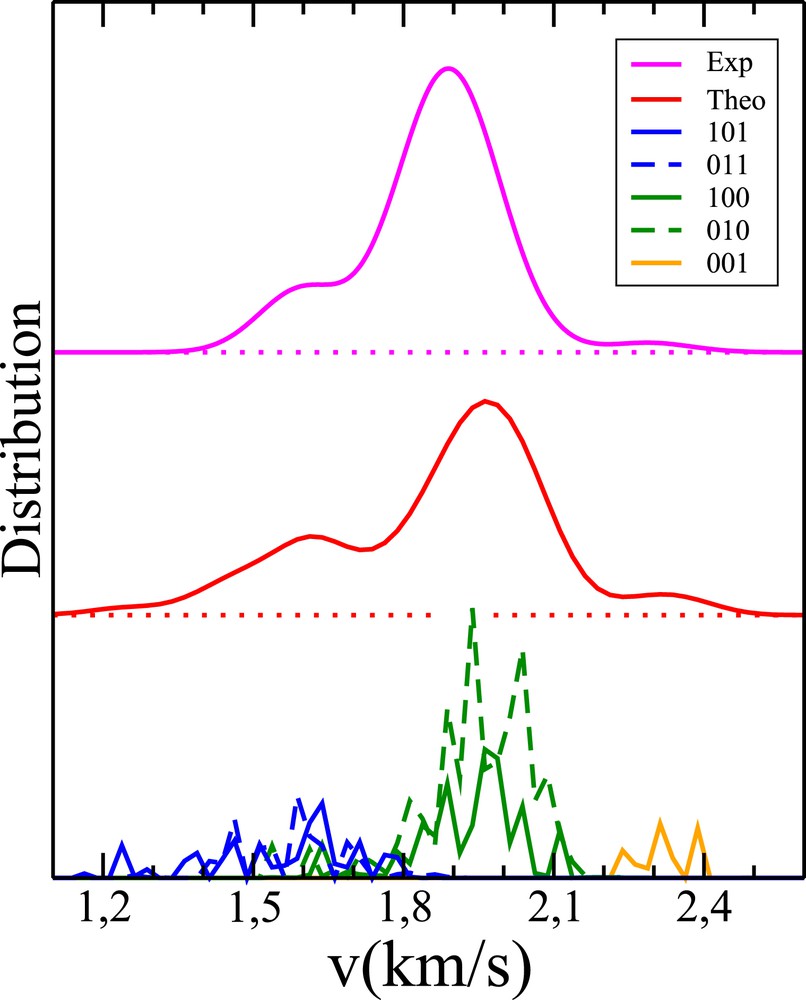
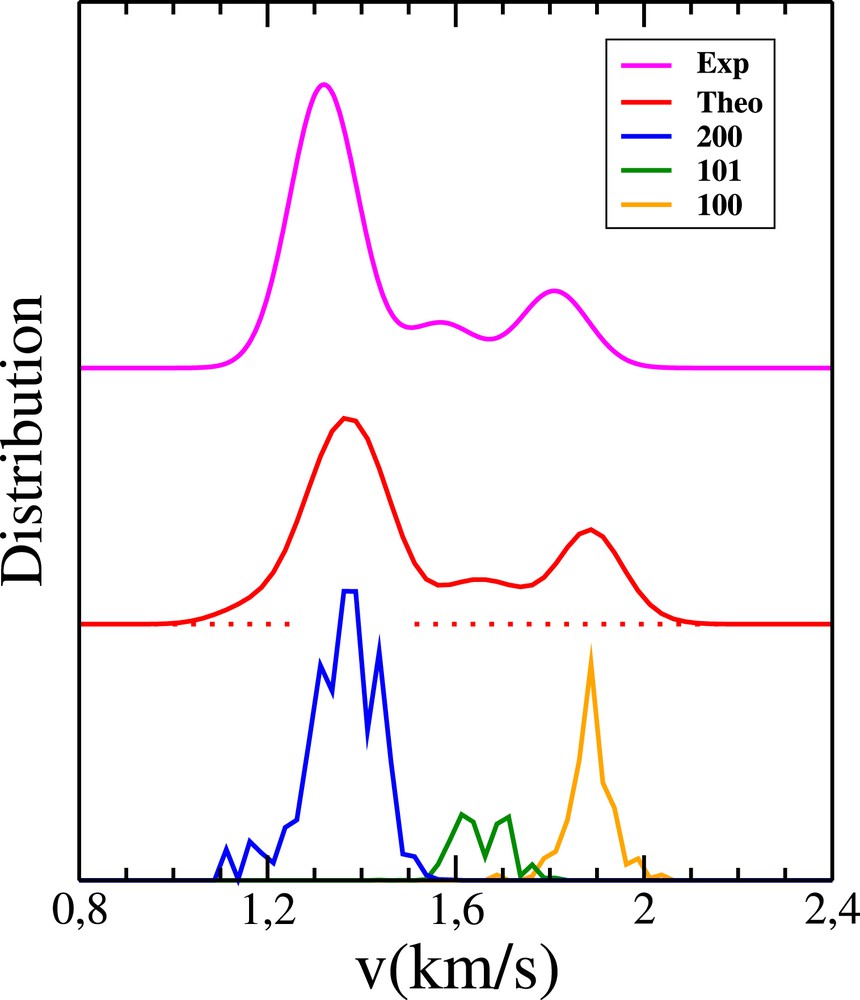
Pair-correlated speed distributions for the reaction OH+CH4. Solid blue, dotted blue, solid green, dotted green and orange curves: weighted 1GB distributions p101P101(v), p011P011(v), p100P100(v), p010P010(v) and p001P001(v), respectively. Red curve: final theoretical result obtained from a convolution of the sum of the previous quantities (see Eq. (6)). Magenta curve: experimental distribution of Zhang et al. (see Fig. 2a in Ref. [14]).
Last but not least, we wish to emphasize that standard QCT-SB calculations do not even allow us to reveal the structures seen in the experimental PCSDs, as can be seen in Fig. 10. The QCT-SB distributions are indeed simple bell-shape curves broader than the experimental distributions. In comparison, QCT-1GB distributions are much more realistic (see Figs. 7 and 9).
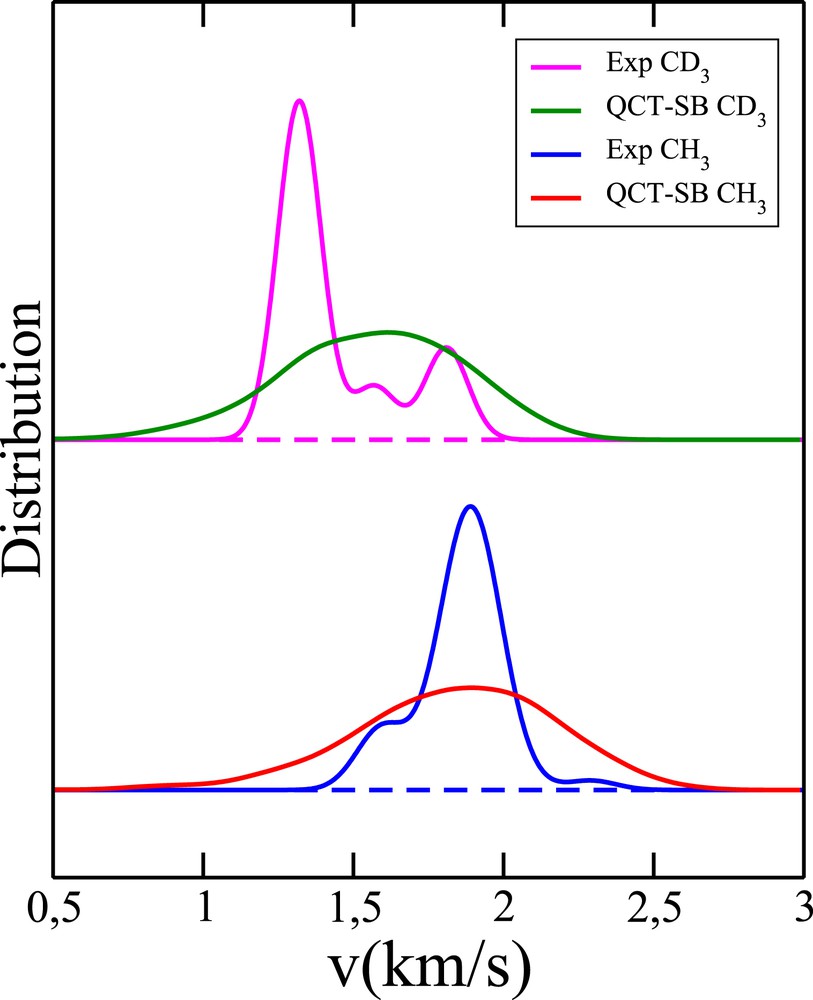
Comparison between the experimental pair-correlated speed distributions and those obtained by means of the QCTM within the standard binning procedure for the two reactions of interest.
2.4 High numerical cost of the pair-correlated angular distribution
Following Ref. [19], we estimate the PCAD by limiting the restrictions imposed by VMI to the second constraint in Section 2.2 and using the 1GB procedure with ɛ = 0.041. This distribution is called Pa(θ). For the OH+CD4 reaction, the number of 1GB trajectories is then equal to 4417. Pa(θ) is found to nearly reproduce the previous prediction represented by the solid black curve in Fig. 7 of Ref. [19]. This distribution turns out to be in qualitative agreement with the experimental PCAD of Zhang et al. represented by the dashed black curve in the same figure (see also Fig. 3a in Ref. [12]). The main difference is that the former involves a forward contribution not seen in the latter. One may thus wonder whether calculating the PCAD in a way consistent with the estimation of the PCSD might make this forward contribution disappear. Moreover, it is logical to use the same approach for estimating different observations measured under the same conditions. This calculation would require adding constraints (i) and (iii) (see Section 2.2) to the method leading to Pa(θ) and deduce the PCAD at ɛ = 0, called Pb(θ), from its values at ɛ = 0.1 and 0.041 by linear extrapolation. However, the PCAD is determined by means of 218 and 100 trajectories at ɛ = 0.1 and 0.041, respectively. Now, these numbers are too small for the PCAD to be reliable, especially in the neighborhood of the poles, as is clearly shown in the study by Truhlar and Blais [34]. In particular, it is shown in Figs. 7 and 8 of the previous work that at least one or two thousand trajectories are necessary to get significant results around the poles. The accurate calculation of Pb(θ) for the title processes would thus imply running at least 10 million trajectories.
3 Conclusion
The development of the velocity map imaging (VMI) technique [1] over the last twenty years [2] has made possible the study of polyatomic reactions at an unprecedent level of details through the measurement of pair-correlated speed distributions. For the title processes, for instance, one may extract from the previous observations accurate data on the subtle way H2O/HOD vibrates and rotates for a given quantum state (or set of closely spaced quantum states) of CH3/CD3 [12–14]. If one is able to accurately reproduce these data by an adequate theoretical treatment of nuclear motions on a high-quality ab-initio potential energy surface, one may then use this treatment to get a deep understanding of the dynamics of the processes under scrutiny and improve the synergy between experiment and theory. We have confirmed in this work that the QCT method can be such an approach provided that Bohr's quantization of product vibration motions is taken into account in the final analysis of trajectory results [24,25,28–30]. This is an encouraging result considering (a) the scarcity of theoretical predictions on pair-correlated speed distributions, and (b) the computational challenges of quantum scattering calculations for processes involving large systems. Moreover, we have confirmed that the PES-2014 correctly describes the dynamics of the title processes. We plan to apply this QCT method in a quantum spirit to several polyatomic bimolecular reactions and photodissociations for which pair-correlated speed distributions have never been theoretically reproduced. It should be noted that pair-correlated angular distributions can also be predicted by this method, though the number of trajectories required should be much larger than for the previous distributions.
Acknowledgments
LB is grateful to Prof. Kopin Liu for clarifying explanations on the cross-beam experiments performed in his laboratory.