

1 Introduction
Titania (TiO2) is one of the potential materials that can be used for different industrial purposes, especially for manufacturing of solar cells and water treatment because it is cheap, stable in any condition, and environment friendly [1,2]. Advanced oxidation process commonly uses photocatalysts such as titania for the removal of organic and inorganic pollutants in wastewater [3]. During the photocatalytic degradation process, TiO2 can mineralise many types of pollutants into harmless compounds such as water and carbon dioxide [4,5].
Nonetheless, this material has some limitations in which it can only work under UV light because of a large band gap and a high recombination rate of electron–hole during the process caused by lack of site defects [6,7]. Regardless, by altering its porous structure, many site defects, mainly Ti3+ site defects and oxygen vacancies that can be generated when coupling with other semiconductors, can potentially decrease the band gap [8]. Currently, mesoporous materials are actively studied for a promising improvement from its initial properties by enhancing the surface area and forming a uniform framework with adjustable pore sizes [9].
Besides, synthesis of various porous catalysts using microwave is getting more attention because this method can provide a stable and rapid operation condition and form catalysts with good surface morphology because of adequate energy transfer and heat distribution [10]. According to a previous study, this procedure has managed to produce materials with nanosized particles and numerous pores. These materials also possess many site defects, a smaller band gap, and superior photoactivity that could be activated under visible light compared with commercial TiO2 [11].
On the other hand, in-situ electrolysis procedure for the addition of a dopant has been reported as a simple experiment, which requires a short time to complete the reaction [12]. Typically, the addition of transition metal cations into photocatalysts can highly boost their optical properties by reducing the band gap and potentially being activated under visible light [13]. Fe3+ has gained a lot of interest among researchers because it can potentially generate numerous oxygen vacancies, which promote water adsorption, produce surface hydroxyl groups, and enhance photoactivity [14]. Other than that, the addition of iron on the material's surface may be an electron or a hole scavenger that promotes free carrier separation [15]. In this study, in-situ electrolysis was used to introduce different Fe loadings ranging from 3 to 10 wt% onto microwave-assisted synthesised mesoporous titania nanoparticles (MTNs) for the photocatalytic degradation of 2-chlorophenol (2-CP) under visible light irradiation. The catalysts were characterised using X-ray diffraction (XRD), Fourier transform infrared (FTIR), surface area analysis, UV–vis diffuse reflectance spectroscopy (DRS), and X-ray photoelectron spectroscopy (XPS).
2 Experimental section
2.1 Materials
Ninety-nine percent purity Pt and Ag plates were obtained from Nilaco, Japan. Acetone, methanol, sodium dodecyl sulfate surfactant, titanium(IV) isopropoxide, Degussa P25, 2-CP, tetraethylammonium bromide solution, and sodium oxalate (SO) were purchased from Sigma–Aldrich. Next, hydrochloric acid, potassium peroxodisulfate (PP), perchloric acid, N,N-dimethylformamide, potassium iodide (KI), and propanol were bought from Merck, Malaysia, whereas ammonium hydroxide, naphthalene, and sodium hydroxide were obtained from QREC. Supporting electrolyte (tetraethylammonium perchlorate) used during the electrolysis process was synthesised based on a previously reported procedure. First, 190 mL of 1 mol tetraethylammonium bromide was added to 600 mL of water. Then, the saturated aqueous solution was treated with 60 mL of 1 mol perchloric acid (60%). The insoluble perchlorate salts formed were filtered, washed with cold water, and dried. White needles were formed because of recrystallisation and were dried under reduced pressure [16]. All of the chemicals were of analytical grade and were used without any further purification.
2.2 Catalyst preparation
2.2.1 Synthesis of MTNs
The microwave-assisted method was used to prepare MTNs with some modifications based on previous work [11]. Sodium dodecyl sulfate (4.68 g), propanol (120 mL), 28% ammonia solution (29 mL), and distilled water (720 mL) were mixed together before being stirred in a water bath at 323 K for 30 min. Then, titanium(IV) isopropoxide (5.7 mL) was added before the mixture was stirred for another 2 h at 353 K in a water bath. After that, the white mixture was heated in a microwave (Samsung ME711K) with a frequency of 2.45 GHz and power density of 450 W. The mixture underwent continuous heating for 2 h to obtain the MTN sol–gel. Finally, the final product was dried for 12 h in an oven at 373 K followed by calcination for 3 h at 873 K.
2.2.2 Synthesis of iron supported onto MTN
Fe–MTN catalysts were synthesised via in-situ electrolysis as reported [12]. N,N-dimethylformamide solution (15 mL) was poured into a set cell fitted with Ag plate anode (4 cm2) and Pt plate cathode (4 cm2) containing 0.1 M tetraethylammonium perchlorate, MTN (1.5 g), and 6 mmol naphthalene mediator before being stirred at 60 mA cm−2 of constant current. The electrolysis times for 3, 5, 7, and 10 wt% Fe–MTN were according to Faraday's law.
| (1) |
2.3 Characterisation of the catalysts
A Perkin Elmer Lambda 900 UV–vis DRS spectrophotometer was used to estimate the band gap of the materials with the wavelength ranging between 200 and 500 nm. The crystalline structures of the materials were identified using a Bruker Advance D8 X-ray powder diffractometer at a 2θ angle ranging from 20° to 90° with Cu Kα radiation (λ = 1.5418 Å). Next, the chemical functional groups in the catalysts were identified with FTIR spectroscopy (Perkin Elmer Spectrum 2000 FTIR) using KBr. Infrared absorbance data were attained in between wavenumbers 400 and 4000 cm−1. Other than that, the surface area, isotherm, and pore distribution of the catalysts were estimated via the Brunauer–Emmett–Teller (BET) method. Before measurement, all samples were degassed for 2 h at 535 K and 0.1 Pa. The chemical oxidation of the catalysts was identified using XPS conducted on a Kratos Ultra spectrometer equipped with a Mg Kα radiation source (10 mA, 15 kV).
2.4 Photocatalytic degradation of 2-CP
Photoactivity during degradation of 2-CP was determined to study the photocatalytic performance of different photocatalysts, which were 3, 5, 7, and 10 wt% Fe–MTN and P25. The reactions were carried out in a batch reactor with fluorescence lamp (48 W) as the radiation source. Each catalyst (0.0750 g) was mixed in a 2-CP solution (200 mL) before being stirred in the dark (2 h) to reach adsorption–desorption equilibrium and then the solution was continued to be stirred under light irradiation (6 h). Sampling of about 2 mL of the solution was done every 30 min. The sampled solutions were then centrifuged in a microcentrifuge (15 min, 45,000 rpm) before being measured by Shimadzu Corp UV-2600 UV–vis spectrophotometry to identify the residual concentration of 2-CP at 274 nm. Reactions were replicated thrice to secure the accuracy of the experiment. The degradation percentage was calculated as follows:
| (2) |
3 Results and discussion
3.1 Characterisation of the catalysts
Fig. 1a shows the XRD pattern of different weight loadings of Fe on MTN. A set of peaks was detected for MTN at 25.32°, 36.98°, 37.86°, 38.60°, 48.06°, 53.97°, 55.09°, 62.76°, 68.87°, 70.33°, 75.14°, and 82.76°, which corresponded to (101), (103), (004), (112), (200), (105), (211), (204), (116), (220), (215), and (224) planes, respectively. Referring to the JCPDS file (No. 01-086-1157), these peaks matched the common peaks of anatase phase TiO2. It can be observed that the peak intensity of TiO2 slightly decreased with the increasing weight loadings of Fe onto MTN. According to Karim et al. [17], mesopores uniformity and the degree of orderliness in the MTN slightly decrease with the addition of Fe onto MTN, but these do not significantly affect the catalyst structure. The detection of new diffraction peaks at 35.14° was congruous with the presence of Fe in the MTN lattice, which increased in intensity with the increase of Fe loadings onto MTN. The Debye–Scherrer equation was applied to determine the particle size of these catalysts with the major peak at 2θ = 25.32° as follows:
| (3) |

(a) XRD diffractogram of (curve a) MTN, (curve b) 3% Fe–MTN, (curve c) 5% Fe–MTN, (curve d) 7% Fe–MTN, and (curve e) 10% Fe–MTN. (b) FTIR spectra of (curve a) MTN, (curve b) 3% Fe–MTN (curve c) 5% Fe–MTN (curve d) 7% Fe–MTN (curve e) 10% Fe–MTN.
Different weight loadings of the Fe–MTN catalyst were characterised and the structures were confirmed using FTIR spectra. From the FTIR data (Fig. 1b), it was noted that all of the catalysts exhibited a moderately broad absorption band around 3200–3900 cm−1, which indicated the chemisorption of hydroxyl (OH) group on the surface of TiO2 framework [21]. A noteworthy observation made was that the hydroxyl band became less significant with the increasing weight loadings of Fe onto the TiO2. A possible explanation, as reported by Hadjiivanov et al. [22], is that the introduced Fe atoms might shift the regular TiO2 framework by means of perturbation. The absorption band around 1300 cm−1 was also seen for all catalysts, which correlated with Ti–O–Ti bending vibrations and asymmetric stretching, whereas the band around 650 cm−1 displayed the typical band of the titanium tetrahedral framework [23]. It was observed that both the absorption bands at 1300 and 650 cm−1 decreased in intensity with increasing weight loadings of Fe onto MTN.
Next, the chemical states of 3 wt% Fe–MTN were identified using XPS, as shown in Fig. 2. This figure exhibits the Ti2p spectrum of 3 wt% Fe–MTN in the region of 455–469 eV. The Ti2p was fixed into six peaks, whereby 458.1 (Ti2p3/2), 458.2 (Ti2p3/2), and 462.9 (Ti2p1/2) eV were assigned to Ti3+, whereas the peaks at 460.0 (Ti2p3/2), 463.9 (Ti2p1/2), and 464.5 (Ti2p1/2) eV were attributed to Ti4+. The O1s spectrum of 3 wt% Fe–MTN in Fig. 2b shows the presence of Ti4+–O peaks at 529.3 and 529.6 eV, whereas peaks at 531.3 and 532.0 eV are attributed to the Ti3+–O and hydroxide or hydroxyl group (OH−), respectively. On the basis of the Fe2p spectrum in Fig. 2c, 710.5 (Fe2p3/2), 712.0 (Fe2p3/2), 723.7 (Fe2p1/2), and 724.3 (Fe2p1/2) eV were assigned to Fe3+ [25,29]. From this result, the synergistic effect between Fe and MTN was confirmed by the shifting of Ti4+ species peaks to higher binding energy in a Ti–O–Fe structure, in contrast to the previous study by Jaafar et al. [11]. This is because the electrons are induced and transferred from Ti4+ to Fe3+ in the Ti–O–Fe bond due to the difference in electronegativity where Fe3+ species are more electron-rich compared with Ti4+ species. Therefore, the binding energy for Ti4+ species increases whereas the binding energy for Fe3+ species decreases [25,26].
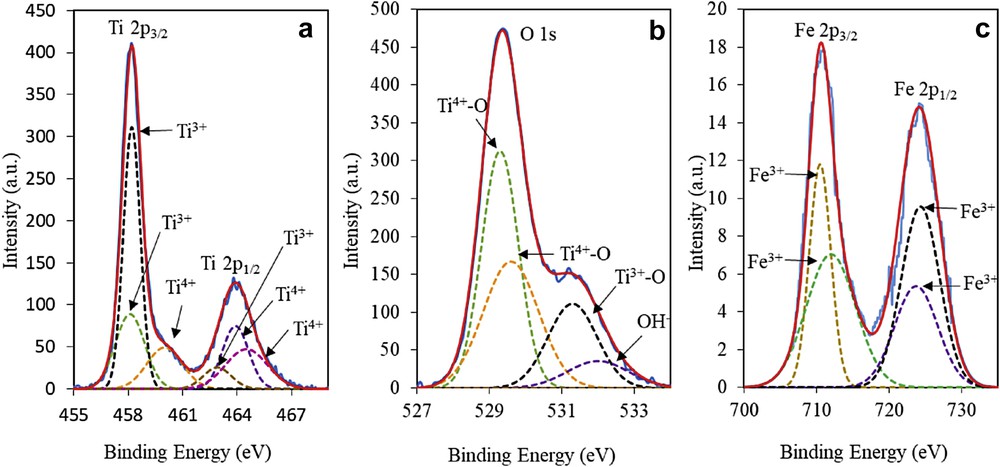
XPS spectra of (a) Ti2p, (b) O1s, and (c) Fe2p of 3 wt% Fe–MTN.
UV–vis DRS was used to investigate the band gap energy of the catalyst, as depicted in Fig. 3. As reported by Ozer and Ferry [27], a fast electron–hole recombination rate is caused by the large band gap of MTN that is affected by the charge stability of the photocarriers in the bulk material and thus limits the degradation of the pollutant. The result showed that the large band gap energy of MTN (3.2 eV) was successfully lowered with the addition of Fe into the MTN structure. It was observed that the 3 wt% Fe–MTN obtained the lowest band gap energy (2.4 eV) followed by 10 (2.6 eV), 7 (2.8 eV), and 5 (3.0 eV) wt% Fe–MTN. This result is supported by Li et al. [28], who suggested that one of the strategies to reduce the electron–hole recombination rate is by doping the TiO2 lattice with transition metal cations such as Fe. Hence, the decrease in the band gap energy after the addition of Fe onto MTN illustrated the potential of the system for photocatalytic degradation under visible light sources.

UV–vis spectra of (curve a) MTN, (curve b) 3% Fe–MTN, (curve c) 5% Fe–MTN, (curve d) 7% Fe–MTN, and (curve e) 10% Fe–MTN.
The nitrogen adsorption–desorption isotherm and pore size distribution of the catalysts are presented in Fig. 4. Fig. 4a illustrates the catalyst displaying the isotherm type IV with an H3 hysteresis loop, verifying the typical adsorption characteristics of mesostructured materials with slit-shaped pores not uniform in shape and/or size [29]. The hysteresis loop at P/P0 = 0.80–0.99 was attributed to the occurrence of nitrogen condensation within adjacent nanoparticles' void, which was formed because of textural porosity between particles [17]. Although it was observed that the adsorption trends of all of the catalysts were nearly identical to each other, the mesoporous volume of 3 wt% Fe–MTN was found to be higher. According to the BET results, the highest surface area was exhibited by 3 wt% Fe–MTN (23.86 m2/g), followed by 5 (19.29 m2/g), 7 (19.19 m2/g), and 10 (16.78 m2/g) wt% Fe–MTN. Zhang and Gao [30] explained that the high surface area obtained by 3 wt% Fe–MTN aids in the rapid mass transfer of the adsorbed molecules from the bulk solution onto the catalyst's surface, thus, accelerating the photocatalytic activity.
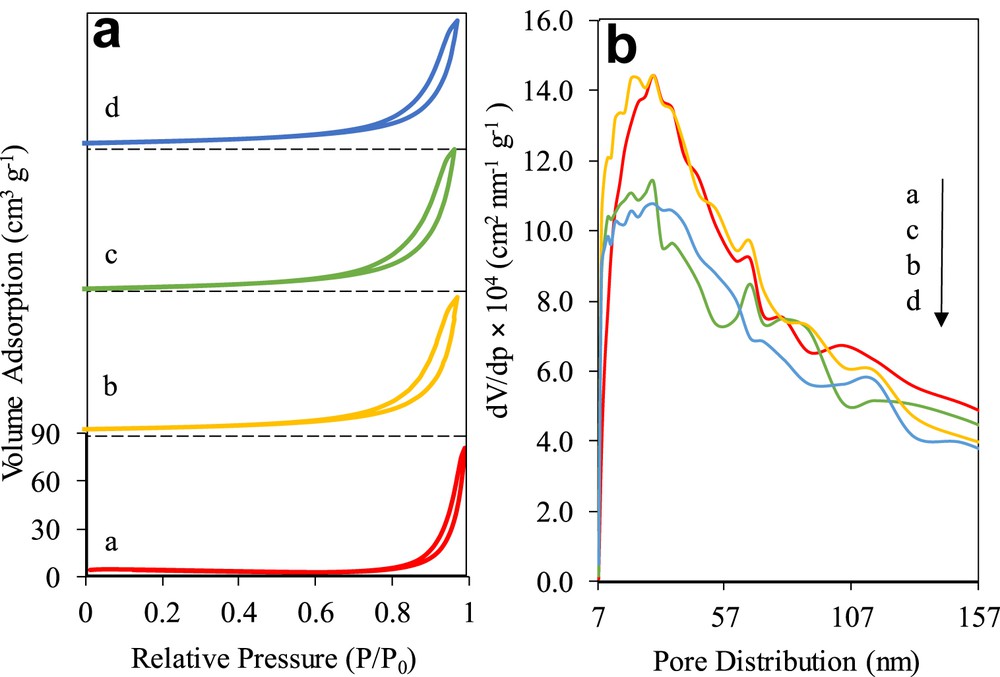
(a) N2 adsorption–desorption isotherm and (b) pore distribution (curve a) 3% Fe–MTN, (curve b) 5% Fe–MTN, (curve c) 7% Fe–MTN, and (curve d) 10% Fe–MTN.
Fig. 4b displays the Barrett–Joyner–Halenda pore size distribution for the catalysts, ranging between 7 and 157 nm. It was observed that the highest number of large pore size in the range of 147–157 nm was found in 3 wt% Fe–MTN, followed by 7, 5, and 10 wt% Fe–MTN. Interestingly, this trend changed in the pore size range of 7–57 nm, whereby the 3 wt% Fe–MTN obtained a higher number of pores, followed by 5, 7, and 10 wt% Fe–MTN, which suggested that the rudimentary pore formations favourably occurred in the 3 wt% Fe–MTN. This result also demonstrated that the mesoporosity of the nanoparticle lattice was influenced by the surface area and pore structure of the catalyst [31].
3.2 Performance and photocatalytic activity of the catalysts
Photocatalytic activity of the catalysts for the degradation of 2-CP under visible light irradiation is shown in Fig. 5. It was observed that 3 wt% Fe–MTN presented the best photodegradation (98.9%) followed by 10 wt% Fe–MTN (70.0%), MTN (60.0%), P25 (59.0%), 7 wt% Fe–MTN (58.0%), and 5 wt% Fe–MTN (52.0%). The photocatalytic performance exhibited by 3 wt% Fe–MTN might be because of the synergistic effect between Fe and MTN [24]. Moreover, the lowest band gap energy and highest surface area in 3 wt% Fe–MTN probably played a significant role in improving the photoactivity. This finding is in agreement with Hoffmann et al. [32] and Piera et al. [33] who reported that Fe3+ ions can act as shallow traps in the TiO2 lattice structure, which lowers the band gap energy and inhibits the electron–hole recombination process, thus, extending the photocatalytic performance. Besides, appropriate metal loading also contributes to the photocatalytic performance. A similar result was detected by Ranjit and Viswanathan [34], whereby doping at a relatively weak level such as 3 wt% iron could achieve the optimum photocatalytic properties.
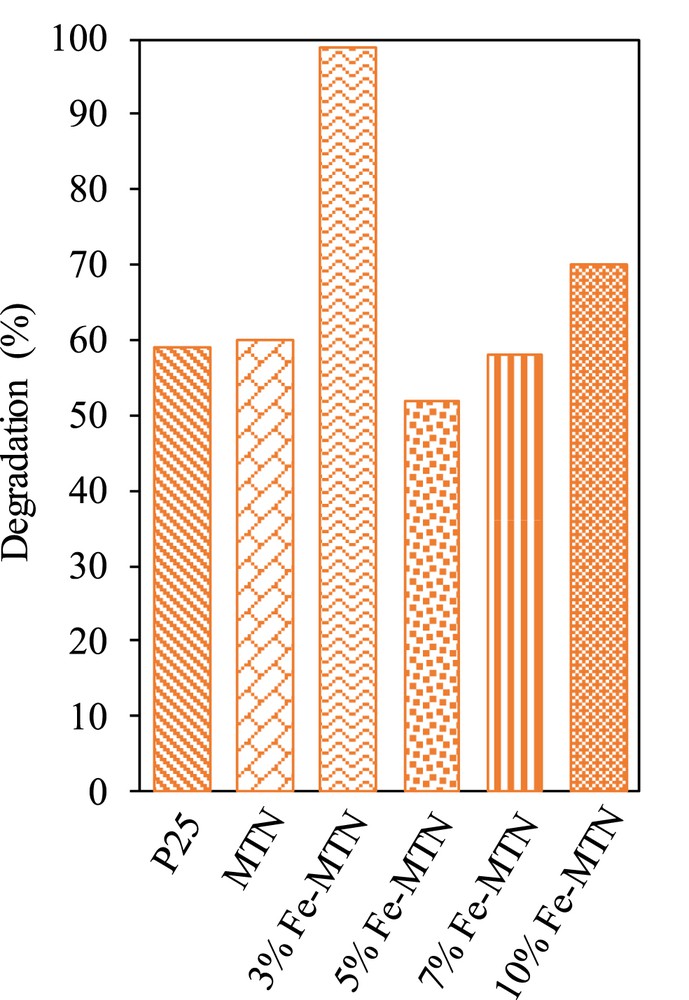
Photocatalytic performance of P25, MTN, 3, 5, 7, and 10 wt% Fe–MTN (C2-CP = 10 mg L−1, pH 5, W = 0.375 g L−1, t = 8 h, T = 303 K).
The photocatalytic activity of the catalysts was heavily influenced by the pH of the solution. As illustrated in Fig. 6a, the photocatalytic activity of 3 wt% Fe–MTN was observed to be the highest in the pH 5 solution with a 98.98% degradation followed by pH 3, 7, 9, and 11 with degradations of 52.74%, 22.09%, 5.00%, and 2.00%, respectively. This result could be explained by the amphoteric properties of the catalyst in terms of its point of zero charge (PZC), as suggested by Karim et al. [17]. It was observed that the 3 wt% Fe–MTN had a PZC of pH 6.1 (Fig. 6b), which indicated that any pH > 6.1 will result in the surface of the catalyst to be negatively charged and hence influence the photoactivity of the catalyst [24]. Adam et al. [35] suggest that the surface of the catalyst will be positively charged in acidic solutions and negatively charged in alkaline solutions. Therefore, the existence of a strong electrostatic field between the positively charged catalyst surface and negatively charged 2-CP, because of a pH value lower than its pHzpc, caused a higher percentage of degradation. As such, it can be concluded that the 3 wt% Fe–MTN catalyst exhibited the optimum photocatalytic performance in an acidic medium.
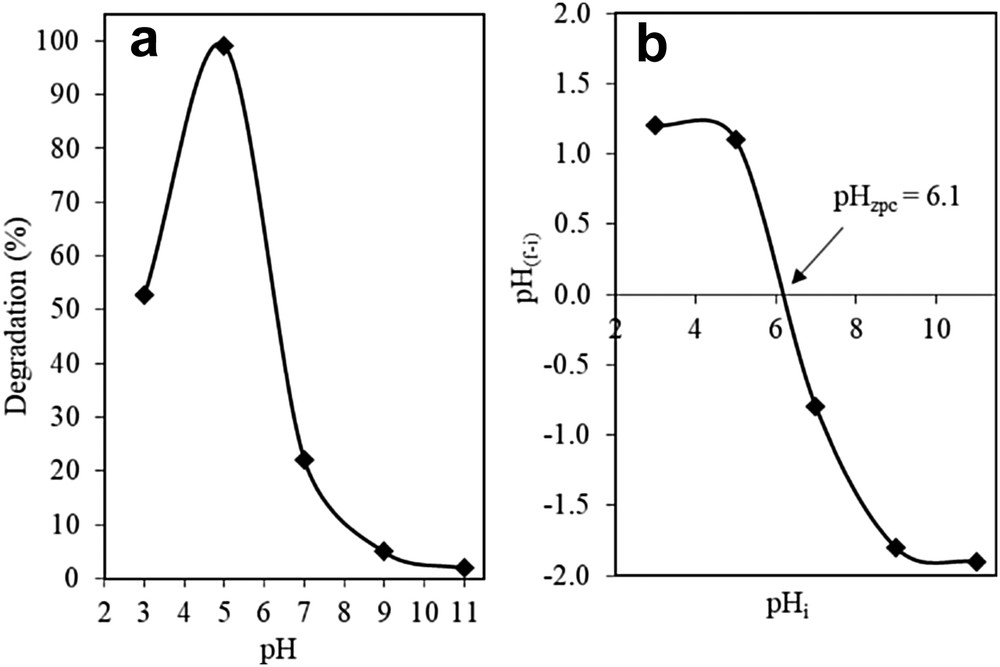
(a) Effect of pH using 3% Fe–MTN on degradation of 2-CP and (b) isoelectric point (pHPZC) of 3% Fe–MTN (C2-CP = 10 mg L−1, W = 0.375 g L−1, t = 8 h, T = 303 K).
Other than that, the photocatalytic performance of the catalyst is greatly affected by the initial concentrations of the solution [36,37]. Fig. 7a shows the photoactivity of the catalysts when various initial concentrations of 2-CP in the range of 10–100 mg L−1 of 2-CP were used. The degradation of 2-CP was the highest at the lowest concentration (10 mg L−1) with 98.98% degradation. This might be because the lower number of 2-CP molecules in the 10 mg L−1 concentration allows for good light penetration to reach the surface of the catalyst and trigger the photodegradation of 2-CP. Nevertheless, the degradation trend was shown to gradually decrease as the initial concentration of the pollutant increased to 100 mg L−1. A possible explanation for this trend is that an increase in 2-CP molecules prevents the penetration of light towards the catalyst's surface, which causes a significant reduction in the formation of hydroxyl ions that impacts the degradation of 2-CP [38].
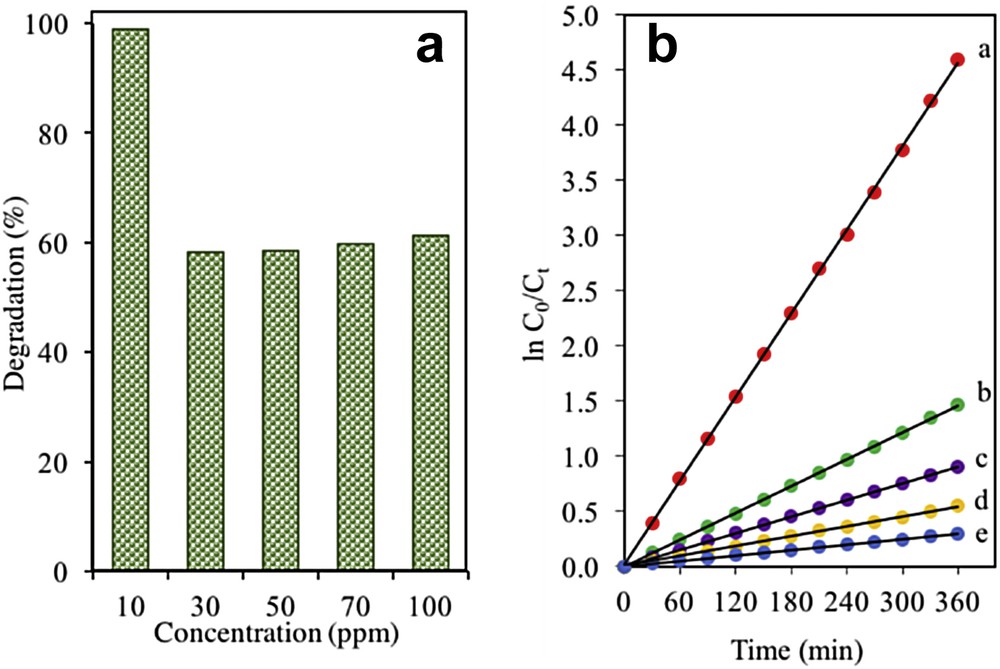
(a) Effect of initial concentraion of 2-CP using 3% Fe–MTN. (b) Photodegradation kinetics of 2-CP using 3% Fe–MTN at different initial concentrations. (curve a) 10, (curve b) 30, (curve c) 50, (curve d) 70, and (curve e) 100 mg L−1 (pH = 5, W = 0.075 g L−1, t = 8 h, T = 303 K).
On the basis of Eq 4, a graph consisting of linear plots of ln (C0/Ct) against the irradiation time for a series of concentrations (10–100 mg L−1) was plotted to extend the kinetic study of the catalysts where it was consistent with the Langmuir–Hinshelwood model (Fig. 7b) [36]. A straight line produced suggested that this system followed a pseudo-first-order kinetic model. Table 1 lists the percentage of degradation at different initial concentrations of 2-CP using 3 wt% Fe–MTN.
| (4) |
Percentage degradation at different initial concentrations of 2-CP and pseudo-first order apparent constant values for 2-CP degradation using 3 wt% Fe–MTN (pH = 5, W = 0.075 g L−1, t = 8 h, T = 303 K).
| Initial-CP concentration, C0 | Degradation (%) | Reaction rate, kapp (×10−3 min−1) | Initial reaction rate, r0 (×10−2 mg L−1 min−1) |
| 10 | 98.98 | 12.7 | 12.7 |
| 30 | 81.29 | 4.0 | 12.0 |
| 50 | 71.43 | 2.5 | 12.5 |
| 70 | 60.64 | 1.5 | 10.5 |
| 100 | 47.96 | 0.8 | 8.0 |
The effect of catalyst dosage was used as a parameter to improve the optimisation of the catalyst (Fig. 8a). Selected dosages were 0.188, 0.250, 0.375, 0.450, and 0.563 g L−1. The results showed that 0.375 g L−1 gave the best degradation of 2-CP (98.98%), followed by 0.250 (60%), 0.450 (60.0%), 0.563 (50.0%), and 0.188 g L−1 (34.18%). Zhou et al. [39] reported that the low number of surface-active sites could be caused by catalyst aggregation, which in turn causes the decline in photodegradation rate. Furthermore, increasing the dosage of the catalyst after 0.375 mg L−1 might have contributed to the turbidity of the suspension in the solution that hindered the penetration of light to the surface of the catalyst [40].
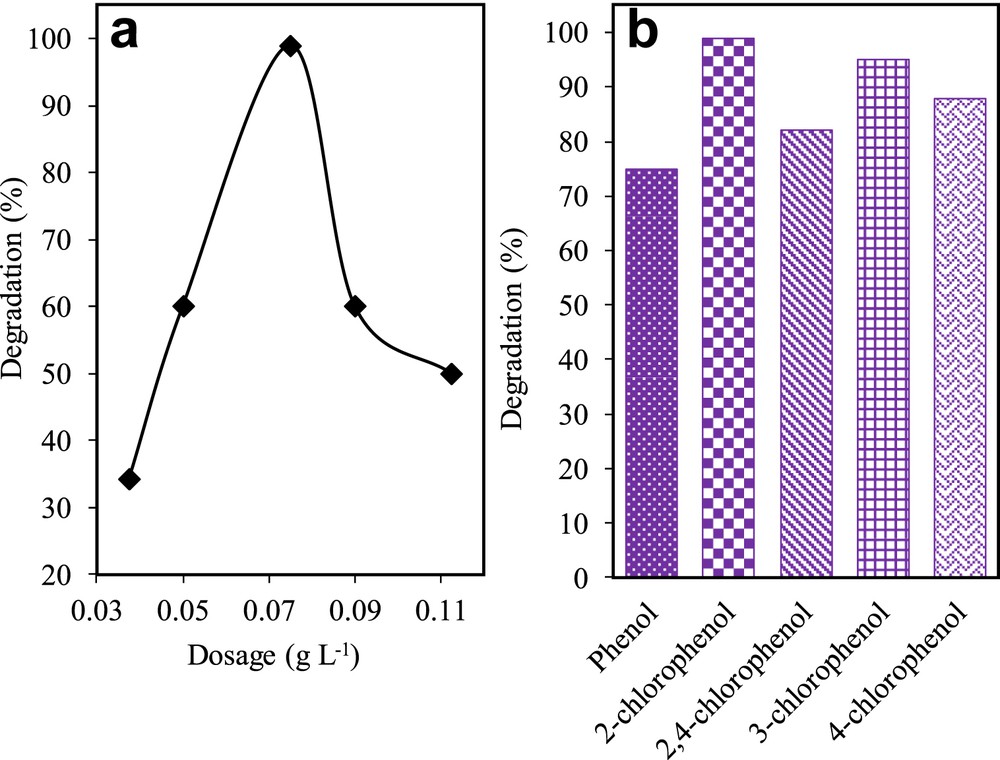
(a) Effect of catalyst dosage using 3% Fe–MTN on degradation of 2-CP (C2-CP = 10 mg L−1, pH 5, t = 8 h, T = 303 K) and (b) photodegradation activity of 3 wt% Fe–MTN for the degradation of simulated phenol derivatives (Cphenol derivatives = 10 mg L−1, pH = 5, W = 0.375 g L−1, t = 8 h, T = 303 K).
The effectiveness of the catalysts was studied for various phenolic compounds namely phenol, 2-CP, 3-CP, 4-CP, and 2,4-DCP. Fig. 8b shows the performance of 3 wt% Fe–MTN based on its photodegradation activity of pollutants (phenolic compounds). Interestingly, the catalyst managed to degrade more than 70% of each phenolic derivative as displayed in Fig. 8b. It was noteworthy to observe that 2-CP recorded the highest degradation followed by 3-CP, 4-CP, 2,4-DCP, and phenol. This result implies that 3 wt% Fe–MTN has a promising potential to be further developed for the industrial treatment of wastewater containing multiple phenolic derivatives.
The 3 wt% Fe–MTN catalyst underwent five cycles of regeneration to investigate its stability and reusability after repeated photocatalytic activity. Fig. 9a demonstrates that the photoactivity of the catalyst remained impressive with a slight decrease in performance from 99.0% (first cycle) to 85.0% (fifth cycle). According to Jaafar et al. [41], heat exposure during the drying process in between the regeneration cycles might decrease the surface area and increase the aggregation of the catalyst, hence, reducing the photodegradation of 2-CP in the successive cycles.

(a) Reusability performance of the catalyst using 3 wt% Fe–MTN (C2-CP = 10 mg L−1, pH = 5, W = 0.375 g L−1, t = 8 h, T = 303 K) and (b) photodegradation efficiencies of 2-CP in the presence of hole scavenger, electron scavenger, and OH scavenger using 3 wt% Fe–MTN (C2-CP = 10 mg L−1, pH = 5, W = 0.375 g L−1, t = 8 h, T = 303 K).
Then, the leaching of iron from the catalyst during the reaction was further confirmed via AAS analysis (Table 2). This analysis illustrated that < 0.1 mg L−1 (< 2%) of Fe ions were found after the 7 h of reaction, which is under the standard level and has been described in other studies [42,43]. Thus, this showed that photocatalytic degradation of 2-CP was further improved because of the existence of iron on the MTN surface instead of the leached iron ions.
Fe leaching in the solution during experiment determined by AAS.
| Condition | %Fe detected in solution |
| After 1 h dark | 0.020 |
| 3 h Irradiation | 0.024 |
| 6 h Irradiation | 0.044 |
Next, to study the mechanism of the Fe–MTN catalyst, scavenging agents were used, namely, KI, SO, and PP, which acted as the surface hydroxyl radical (OH) trapper, hole (h+), and electron (e−) trapper, respectively. Fig. 9b presents the degradation of 2-CP after the addition of the three scavenging agents. On the basis of this figure, the highest degradation of 2-CP was recorded with the addition of SO (95.0%), followed by KI (50.2%) and PP (46.0%). This result revealed that the electrons played a significant part in this system followed by hydroxyl radicals and holes.
In accordance with the results obtained, Fig. 10 illustrates the proposed mechanism of Fe–MTN for the photodegradation of 2-CP to represent the charge transfer process. It is proposed that the electrons in the valence band (VB) on the MTN surface were excited for the conduction band (CB) after being triggered with visible light irradiation, which led to the formation of negative electron and positive hole on the catalyst surface or better known as the electron–hole pair (Eq. 5).
| (5) |
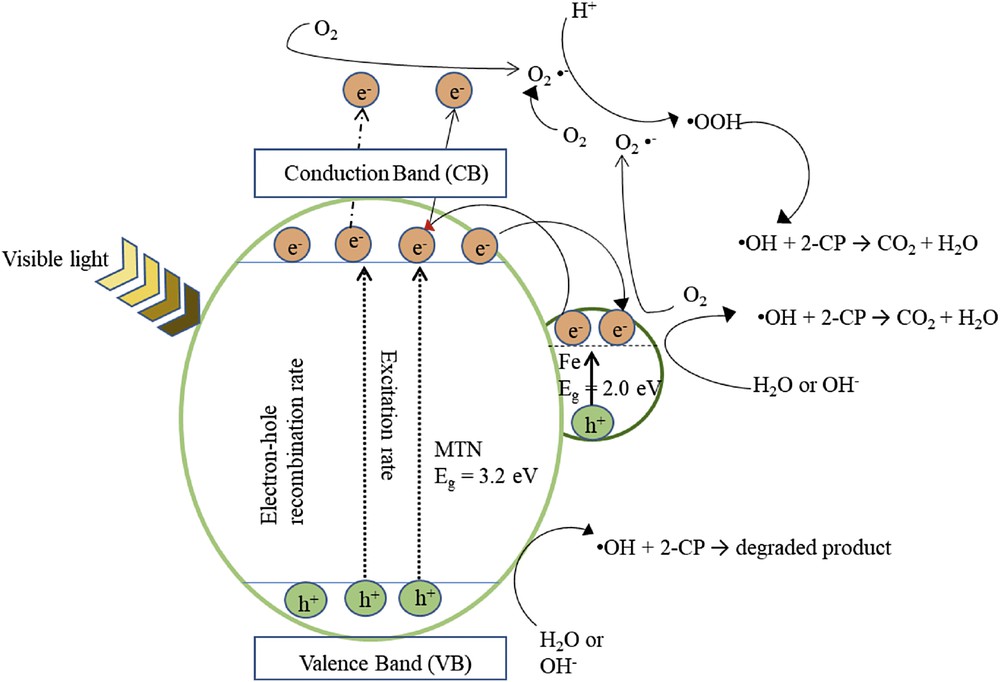
Proposed mechanism for photocatalytic degradation of 2-CP using Fe–MTN.
The holes (hVB+) reacted with water molecules or hydroxyl ions to form OH radicals (Eq. 6), whereas the electrons in the CB reduced O2 to superoxide anion radicals, O2− (Eq. 7). According to Lu et al. [44], the pollutant adsorbed on the catalyst's surface will be oxidised by reactive species, that is, OH ions and H2O2 superoxide radicals.
| (6) |
| (7) |
The excited electrons may generate OH (Eq. 8) to form partial or complete mineralisation of 2-CP and generate CO2 and H2O (Eq. 9).
| (8) |
| (9) |
The lower the band gap energy of the catalyst, the easier it is to induce electron transfer from the valence band to conduction band. Interestingly, the CB of Fe acted as a photoelectronic receiver because of its band gap energy being lower than that of TiO2 [45]. This resulted in the photogenerated electron being transferred to the conduction band of TiO2 from the Fe conduction band. Because the electrons moved in the opposite direction from the hole (hVB+), photogenerated holes existed on the TiO2 surface, which improved the charge separation [46]. The high oxidation potential influenced by photogenerated h+ at the valence band has two important roles in the degradation of 2-CP. First, is the direct oxidation of 2-CP to reactive intermediates and the second is the oxidation of water molecules or hydroxyl groups on the TiO2 surface to hydroxyl radicals, which subsequently degrade the 2-CP to a mineralised compound [47].
4 Conclusion
In this study, various weight loadings of Fe (3%, 5%, 7%, and 10%) supported on MTN were synthesised using a simple microwave-assisted method followed by in-situ electrolysis. XRD results exhibited that the peak intensity for the catalyst decreased as the weight loadings of Fe onto MTN increased, whereas BET surface area analysis showed that 3 wt% Fe–MTN had the highest surface area and the best performance in degrading 2-CP (99%) compared with others. The lowest band gap was also confirmed for this catalyst, which could be the primary reason for the best photocatalytic performance recorded in this research. The optimum conditions for 3 wt% Fe–MTN were 0.375 g L−1 catalyst in a pH 5 2-CP solution at a low concentration of 10 mg L−1. It was found that this system obeyed a pseudo-first-order kinetic model. The best catalyst also exhibited an impressive photocatalytic degradation even after five cycles and succeeded in highly degrading other phenolic derivatives.
Acknowledgements
The authors are grateful for the financial support by the Ministry of Education Malaysia for Fundamental Research Grant Scheme (203.PKIMIA.6711607) and the Universiti Sains Malaysia (USM) for Short Term Grant (304/PKIMIA/6315055).