

1 Introduction
Environmental pollution is a global problem that still threatens human health and ecosystems [1–6].
Several regulations have made global environmental pollution (air–soil–water) a serious problem [7–11], but, over the years, scientists have researched a solution to decrease or eliminate the impact of these kinds of pollution [12–16]. In this context, semiconducting photocatalysts have attracted interest for many potential applications in the air, water purification, and organic pollutant degradation [17–19]. Among photocatalytic applications, photocatalytic oxidation and the reduction of organic compounds in water have become important and have received considerable attention during the last few years. As known, among the used semiconductors, titanium dioxide (TiO2) has been intensively investigated due to its considerable photocatalytic ability to degrade organic and inorganic pollutants in water/air, remove environment pollutions, and produce hydrogen by water splitting. TiO2 has received a great deal of attention due to its chemical stability, non-toxicity and low cost [20–22]. The major drawback of pure TiO2 is its large band gap, meaning that it can only be activated upon irradiation with photons in the UV domain (λ ≤ 387 nm for anatase). Nevertheless, UV light makes up only 4–5% of the solar spectrum, whereas approximately 50% of solar photons are in the visible region, limiting the practical efficiency for TiO2 solar applications [23–25]. Moreover, its behavior remains limited by photocharge recombination [26] and by adsorption–desorption of reactants and reaction products [27]. As a result, the photocatalytic activity of TiO2 has been often not high enough to be used as such on the industrial scale.
Many approaches have been developed to overcome these limitations, and to enhance the photoactivity efficiency of TiO2 under solar irradiation. Indeed, the modification of semiconductors [27,28], the addition of transition metals [29,30] and non-metals [31,32] are the common methods for improving the response to visible light of TiO2 photocatalysts. Among non-metal elements, S, C, B, N and F [32–34] have been extensively investigated to extend the light absorption of titania to the visible range. These non-metal elements are considered to narrow the band gap energy of TiO2 owing to the interaction of their p orbitals with O 2p orbitals. Particularly, nitrogen (N) was considered to be the most effective one [35]. Nitrogen can be easily introduced into the TiO2 structure, due to its comparable atomic size with oxygen, small ionization energy, and high stability. It is also known that N-doping into TiO2 leads to the creation of surface oxygen vacancies, which results in band gap narrowing through either the mixing of nitrogen 2p states with oxygen 2p states on the top of the valence band at the substitutional lattice sites, or the generation of inter-gap states induced by the formation of NO bonds with π character at the interstitial lattice sites [36]. Besides, it has been proved that doping with sulfur (S) increases the visible light photocatalytic activity of TiO2 [37]. Especially, sulfur can substitute either oxygen as an anion or titanium as a cation [38]. The overlap of sulfur 3p states and oxygen 2p states facilitates the visible light catalytic activity of S-doped TiO2 [39].
Although N-doped and S-doped TiO2 exhibited improved visible-light-induced photocatalytic activity, electron–hole recombination remains a major obstacle that limits the effective use of non-metals doped TiO2 photocatalysts [31,40]. Many researches [41–43] have shown that co-doping of non-metals into TiO2 could be an effective strategy to improve the photocatalytic efficiency of TiO2 under visible light irradiation. It may result from the synergistic effect of both non-metals causing a band gap narrowing and a reduction of charge recombination, as observed for N, F co-doped TiO2 [44]. Concerning S, N-co-doped TiO2, it is similarly expected to benefit from the synergistic effects of strong light absorption in the UV–vis range, oxygen vacancy creation, and enhancement of surface acidity, all induced by N and S co-doping [45,46]. Besides, it has also been evidenced that doping with metal cations improves the visible light photoactivity of TiO2 [47,48]. Recently researches showed that W, N-co-doped TiO2 nanocatalysts exhibited high activity in the gas-phase selective oxidation of toluene and styrene upon sunlight excitation [49,50]. The synergistic action between the cation and anion doping species on the photochemical activity results in a combined influence on both the structural and electronic properties of the photoactive anatase phase.
In this work, we focus on the synthesis of a novel W–N–S-tri-doped TiO2 photocatalysts with a sol–gel method. Our main subject is to show that the synergistic effect of N, W and S doping in W–N–S-tri-doped TiO2 could highly improve its photoactivity compared to only co-doped W–N–TiO2 or W–S–TiO2. The photocatalytic activity of as-prepared samples was examined through the photodegradation of Congo Red (CR) dye under visible light irradiation.
2 Experimental
2.1 Materials
All reagents used were of analytical grade and employed as received. Titanium tetraisopropoxide (98%) (TTiP) and tungstic acid H2WO4 were purchased from Aldrich Chemicals. Propanol (C3H7OH) and acetic acid (CH3COOH) were obtained from Merck Chemicals. TiO2 P25 was purchased from Evonik Degussa. The azo dye used in the experiments is Congo Red from Merck.
2.2 Photocatalyst preparation
The studied WTiO2 photocatalysts were prepared by a sol–gel method. In a typical procedure, 10 g of titanium tetraisopropoxide (TTIP) were dissolved in 20 mL of propanol at room temperature under stirring for 20 min to prepare solution A. Then, solution B was prepared by dissolving some amounts of tungstic acid (H2WO4), sodium sulfate (Na2SO4), and urea CO(NH2)2 in 200 mL of distilled water and 1.4 mL of acetic acid. The dissolved amounts correspond to W, N and S molar ratios equal to 0.5%. Solution A was subsequently added dropwise to solution B under vigorous stirring within 40 min. The mixture was aged for 12 h at ambient temperature followed by filtering and washing several times with distilled water. Then, the samples were dried at 120 °C overnight and air treated for 2 h at different temperatures between 350 °C and 650 °C. The W–N and W–S co-doped TiO2, W–TiO2, and pure TiO2 were prepared using the same procedure, but by adding to solution B only the corresponding precursor. The as-prepared photocatalysts are named as follows: for example, the W–N–S-tri-doped TiO2 is labeled WNSTiO2.
2.3 Characterization of photocatalysts
The crystalline phases of the synthesized materials were identified by X-ray diffraction analysis on a D8 Advance Bruker diffractometer in a θ/2θ mode and using Cu Kα1 radiation at 1.5406 Å. The pattern was obtained at a scan rate of 0.020°/0.4 s, from 10° to 90°. The database of the Joint Committee on Powder Diffraction Standards (JCPDS) was used to identify the crystalline phases of the powders. The average crystalline size of the catalyst was determined according to the Scherrer equation using the full width at half maximum data after correcting for the instrumental broadening with the normal assumption of spherical shape. The structural characteristics of the photocatalysts were examined by Scanning Electron Microscopy (SEM) using a JEOL XL 30 FEG microscope working at 10–20 kV and Transmission Electron Microscopy (TEM) with a Topcon 002B microscope working at 200 kV and a point-to-point resolution of 0.17 nm. The surface area and pore size and volume of the materials were determined using the BET and the BJH models applied to nitrogen adsorption–desorption data obtained at 77 K on an ASAP2010 Micrometrics.
In order to determine the light absorption range of powder samples, diffuse reflectance spectroscopy was used in the UV–vis region with the help of an integrated sphere. These measurements were carried out on a Varian CARY 100 SCAN UV/Vis, between 200 and 800 nm with 0.02 nm in step-size and using BaSO4 as a reference. The energy band gap (Eg) of the powders was calculated using the differential reflectance method.
2.4 Photocatalytic degradation experiments
The photoactivity experiments were carried out in a cylindrical Pyrex glass reactor containing 125 mL of a 50 mg·L−1 aqueous solution of Congo Red dye (CR). The amount of prepared catalyst was 0.5 g·L−1. The suspension was kept in the dark and continuously stirred using a magnetic stirrer to equilibrate the adsorption–desorption processes. After 90 min in the dark, the mixture was illuminated with an immersed 250-W visible halogen lamp. The photoreactor was surrounded by a circulating water jacket (Pyrex) to cool the reaction solution. An aliquot of the aqueous suspension was periodically taken from the reactor and centrifuged. The absorbance of the clear solution was measured using a Shimadzu 3150 UV–vis spectrophotometer at 498 nm, and then CR concentration was deduced from a calibration curve. Total organic carbon (TOC) concentration was determined by a TOC-analyzer (Shimadzu 5000A) equipped with an auto-sampler (ASI-5000).
3 Results and discussion
3.1 Characterization of the catalyst
3.1.1 XRD analysis
The XRD patterns in Fig. 1 (A) showed that all the as-prepared pure and doped TiO2 samples were present in the anatase phase corresponding to 2θ values of 25.4°, 37.7°, 47.8° and 55.0°, indicative of (101), (004), (200) and (211) diffractions [JCPDS No. 12-1272]. Anatase TiO2 is very beneficial to the photocatalytic degradation of organic pollutants [51]. No diffraction intensity for the rutile phase was observed in WNTiO2, WSTiO2 and WNSTiO2, indicating that S and N-doping could effectively inhibit the growth of the rutile phase. Furthermore, a zoom on the (101) diffraction peaks is shown in Fig. 1 (B). The examination of the (101) peaks for all samples showed no significant change in the 2θ position and the corresponding interplanar distance. By comparing the atomic radius of tungsten (41 Å), sulfur (1.00 Å) and nitrogen (0.65 Å) to that of oxygen (0.60 Å) and titanium (53 Å), the relatively small variation of lattice spacing (±0.03 Å) suggests the insignificant change of crystal structure in doped TiO2 samples, which is probably due to the low doping percentage, whereas, with incorporation of the N or S, the most intense peak of anatase (101) becomes slightly wider, indicating a reduction in the crystallite size compared to single-doped WTiO2 [52,53]. The crystallite sizes are given in Table 1. It was calculated using Scherrer's equation from the width of the (101) peak of TiO2 anatase phase. It can be seen that the particle size is in the range of 7–9 nm for pure and doped TiO2 samples, which suggests that W, N and S dopants are introduced into the lattice of TiO2, but did not affect the crystallization process [53,54].
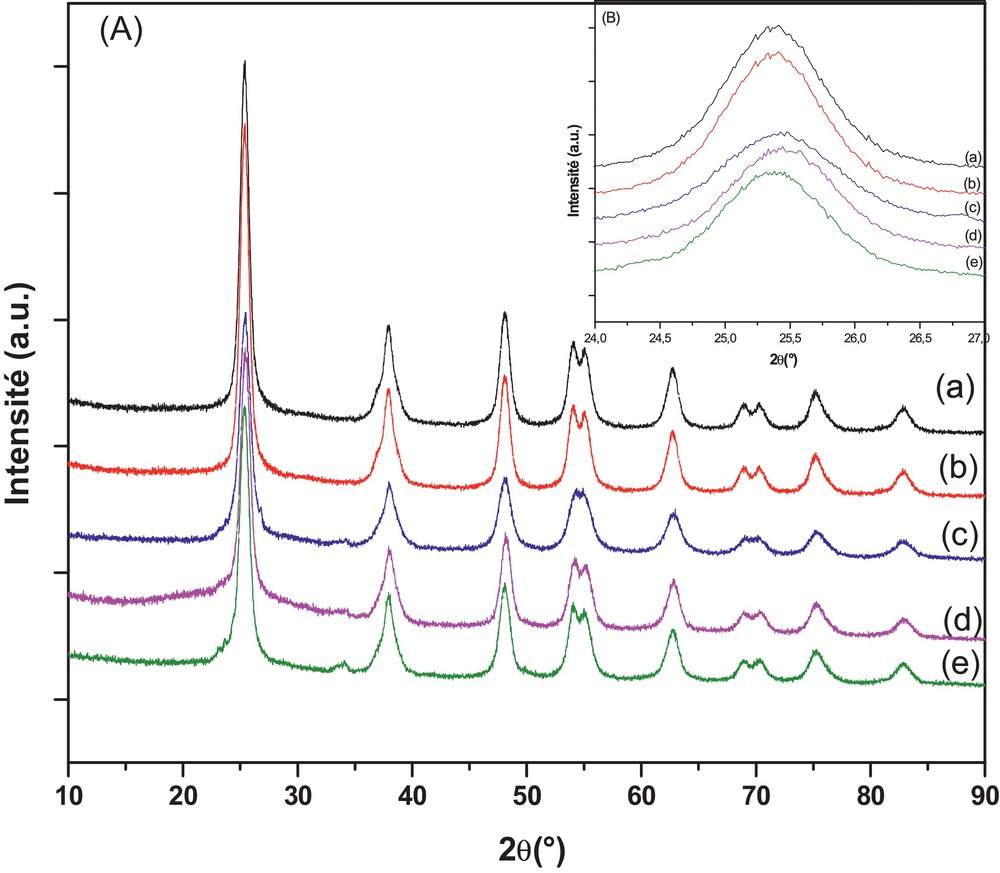
(Color online.) DRX patterns of pure TiO2, WTiO2, WNTiO2, WSTiO2, WNSTiO2 (a–e) respectively (heat treated at 450 °C) (A) and their magnification (B).
Crystalline sizes and interplanar distance of pure and doped TiO2 heat treated at 450 °C.
| Catalysts | Crystal size (nm) | Interplanar distance (nm) |
| TiO2 | 7.4 | 3.5033 |
| WTiO2 | 8.66 | 3.5032 |
| W S TiO2 | 6.94 | 3.5075 |
| W N TiO2 | 7.14 | 3.5014 |
| W S N TiO2 | 8.22 | 3.5050 |
3.1.2 SEM and TEM analyses
Fig. 2 (a and b) present the typical SEM images of the, respectively, prepared WTiO2 and WNSTiO2 catalysts air treated at 450 °C. Both samples appeared homogeneous and formed by a large number of aggregated small particles. A high-resolution TEM (HRTEM) image of WTiO2 (Fig. 2 (c, e)) and WNSTiO2 (Fig. 2 (d, f)) showed nanoparticles of a 10-nm average size, which is in agreement with our XRD results. Lattice images showed that WTiO2 and WNSTiO2 nanoparticles have high crystallinity. The parallel fringe spacing of the WTiO2 nanoparticles is estimated to be 0.35 nm, whereas for WNSTiO2 is about 0.39 nm, corresponding to the (101) plane of the anatase phase of TiO2, which indicates that this plane was the preferential growth direction of the nanocrystallites. The size of the primary particles estimated from the TEM image was about 10 ± 2 nm, which was in good agreement with those calculated from XRD analysis results.
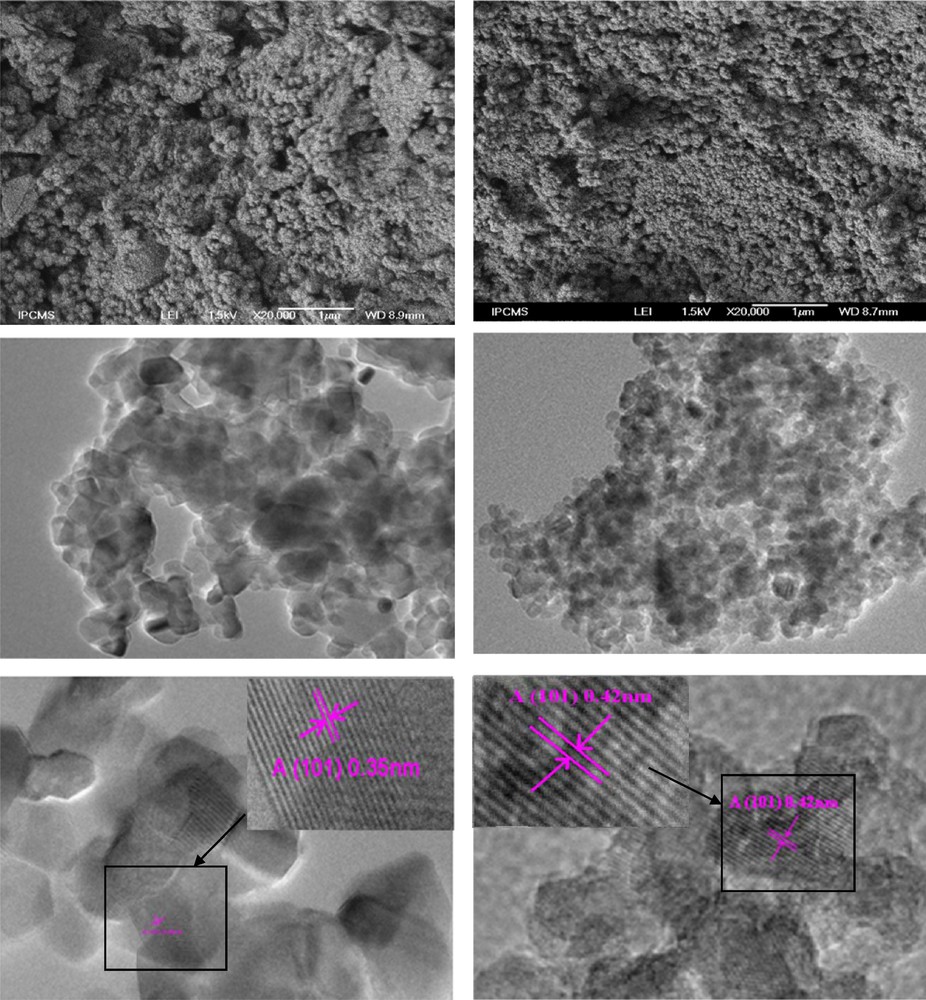
(Color online.) SEM images of (a) WTiO2, (b) WNSTiO2, high-resolution TEM (HRTEM) images of WTiO2 photocatalysts heat treated at 450 °C (c, e) and of WNSTiO2 (d, f).
3.1.3 Surface area measurement
The BET surface area of different samples heat treated at 450 °C is given in Table 2. WTiO2 is found to have the highest surface area. It is also found that the BET surface area decreases in the order WTiO2 > TiO2 > WSTiO2 > WNTiO2 > WNSTiO2. The pores volume and size were deduced from the BJH model. The average pore size is given in Table 2, which shows a mesoporous structure of the pores. Besides, the pore volume is slightly decreased with W, N and W, S co-doped TiO2 and W, N, S-tri-doped TiO2 compared to pure TiO2. This result indicates that the addition of dopant confined the growth of the TiO2 nanoparticles.
BET surface areas (SBET) values and pore parameters of pure and doped TiO2 heat treated at 450 °C.
| Samples | S BET (m2/g) | Pore volume (cm3/g) | Pore size (Å) |
| TiO2 | 121.5 | 0.2568 | 65.57 |
| WTiO2 | 173 | 0.2654 | 66.26 |
| WSTiO2 | 112 | 0.2282 | 74.31 |
| WNTiO2 | 98.6 | 0.1867 | 73.39 |
| WSNTiO2 | 95 | 0.1789 | 62.14 |
3.1.4 Absorption spectrum of TiO2
UV–vis diffuse reflectance (DRS) spectroscopy, which is generally used to detect the presence of framework- and non-framework-incorporated transition metal species in structures and to distinguish the coordination states of the metal and non-metal elements [55–57], was used here to provide some insight into the interactions of the photocatalyst materials with photon energies. Lettmann et al. [58] reported that there is a good correlation between the light absorption properties and the photocatalytic activity. So, it is a good way to obtain a high photocatalytic activity by improving its photoabsorption. Fig. 3 illustrates the UV–vis diffuse reflectance full spectra of the as-prepared pure and W, N, S-doped TiO2 heat treated at 350 °C. After being doped by W, N or W, S, the TiO2 photocatalyst not only can strongly absorb UV light, but can also absorb visible light. Consequently, a clear shift of the optical absorption edge and a band gap narrowing are observed for the W, N or W, S doped TiO2 (Table 3). The band gap (Eg) was determined using the transformed Kubelka–Munk function (inset in Fig. 3) assuming an indirect transition type [59,60]. Moreover, it is found that this improvement in the absorption properties of TiO2 is more pronounced when it is W, N, S-tri-doped. These results show that tri-doping of TiO2 with W, N, S is more effective than its co-doping with W, N or W, S. This behavior may be explained by a greater anion–cation cooperative effect of W, N and S than that of W, N or W, S alone. This anion–cation cooperative effect has a strong mutual structural influence on the band gap value. The enhancement of the absorbance in the UV–vis region increases the number of the photogenerated electrons and holes to participate in the photocatalytic reaction, which is expected to improve the photocatalytic activity of TiO2 [61].
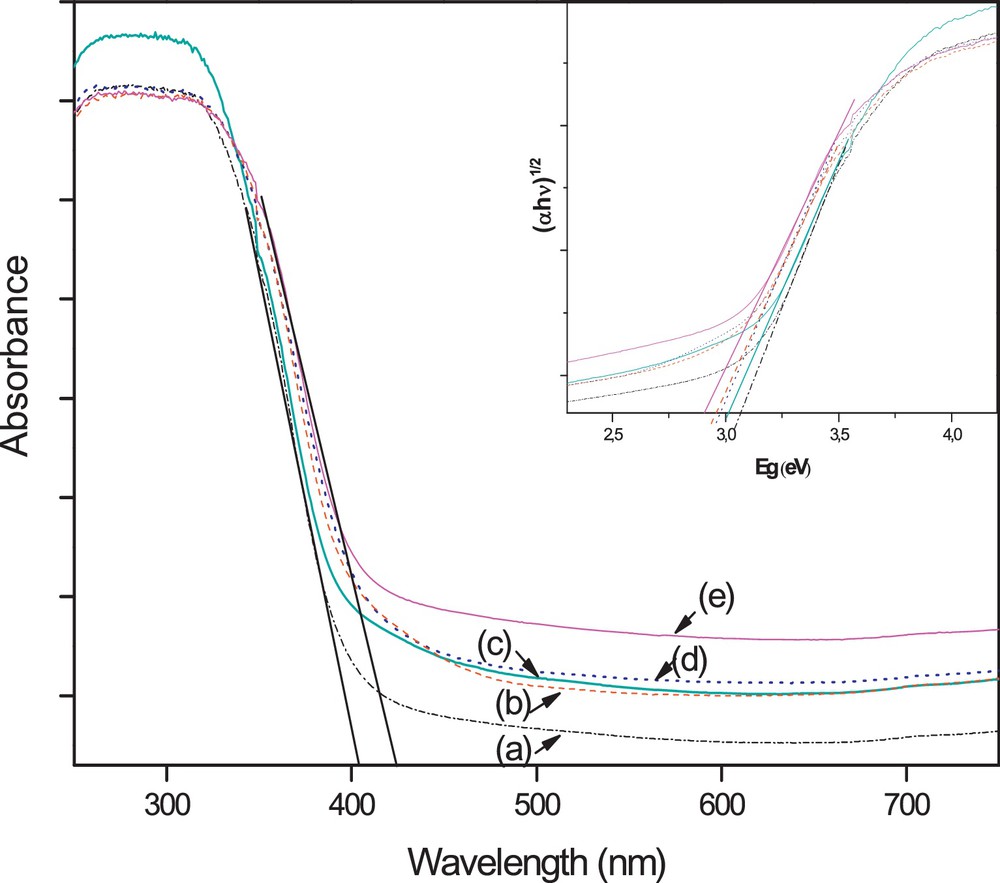
(Color online.) DRS spectra of (a) pure TiO2, (b) WSTiO2, (c) WTiO2, (d) WNTiO2 and (e) WNSTiO2.
Energy band gap values of pure and doped TiO2 heat treated at 350 °C.
| Sample | λ[gap] (nm) | E[gap] (eV) |
| TiO2 | 404 | 3.16 |
| WTiO2 | 420 | 2.95 |
| W S TiO2 | 414 | 2.99 |
| W N TiO2 | 423 | 2.93 |
| W S N TiO2 | 427 | 2.90 |
3.2 Photodegradation studies
3.2.1 Kinetic studies
The photocatalytic properties of the samples were evaluated following the photodegradation of Congo Red; they are shown in Fig. 4. The dye-conversion degree induced by photocatalysis was estimated by measuring the disappearance of the strong absorption band of CR located at 498 nm. To compare the photocatalytic activity of the pure and doped TiO2 samples, the reaction of CR degradation in an aqueous solution was performed as photoreaction probes in visible light irradiation (≥ 420 nm). All the doped samples showed a higher photocatalytic activity than the undoped TiO2, which removed only 43% of the initial CR after 60 min. However, the doped TiO2 samples revealed higher visible photocatalytic activity than the pure one, with the WNTiO2 and WSTiO2 samples showing the CR conversion by 83% and 66% after 60 min of irradiation, respectively, as shown in Fig. 4. The reason for this result may be related to the synergistic effect of W, N and S on the doped TiO2, which causes the absorption edge extension to the visible light range and, thus, plays an important role in improving the activity [61]. This shows that the degradation was much enhanced by incorporation of W, S or/and N into the lattice structure of TiO2 which reduced the value of Eg (Table 3). In general, the photocatalytic activities are attributed to the catalyst SBET, Eg, crystalline phases, and crystallinity [62]. From the BET surface area measurements, the surface area of the photocatalyst decreased with the incorporation of a dopant (Table 2).
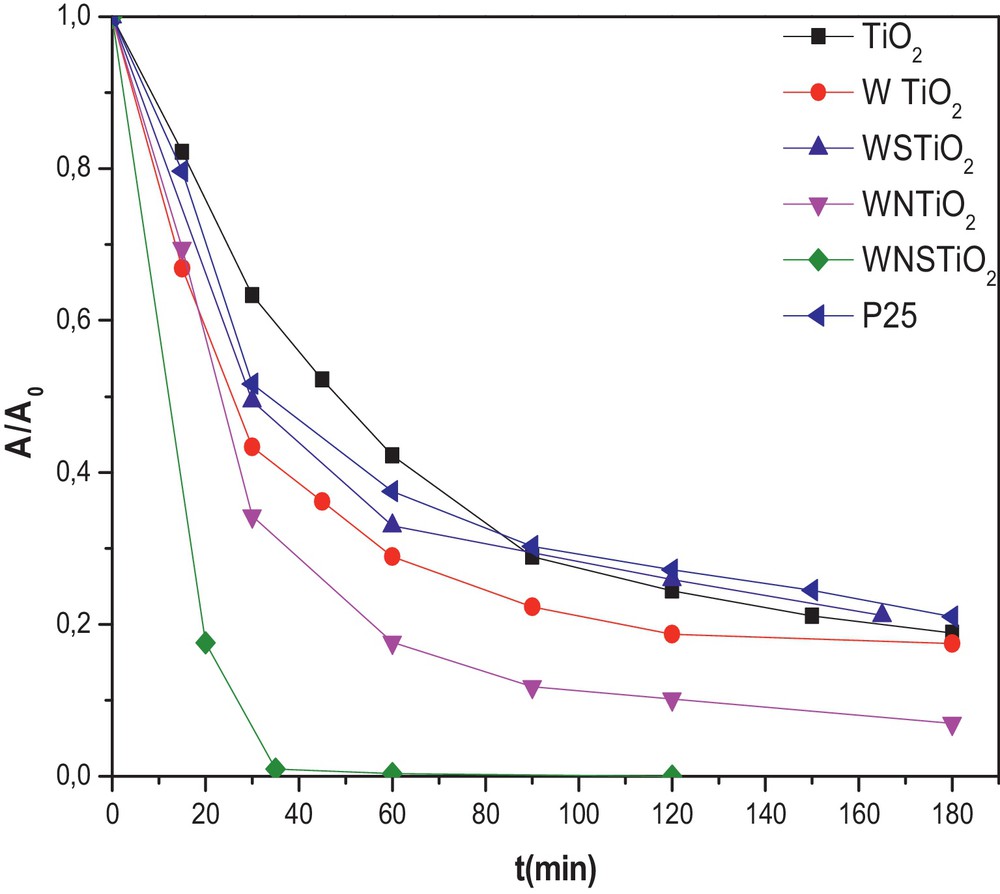
(Color online.) Photodegradation kinetics of CR for different prepared catalysts (initial CR concentration = 50 mg·L−1 and photocatalyst concentration = 0.5 g·L−1). (The photocatalysts were heat treated at 450 °C).
The tri-doped WNSTiO2 has a smaller SBET and a higher crystal size (Table 1). This also explains why there was an increase in the photocatalytic activity as in the undoped TiO2. As mentioned previously, the photocatalytic activity depends on calcination temperature. As shown in Fig. 5, calcination temperature influences the photoactivity of the tri-doped WNSTiO2 sample on CR degradation. At 450 °C, WNSTiO2 appears to be optimal for generating high photoactivity. Higher or lower calcination temperatures lead to a decrease in photoactivity. High calcination temperatures can improve anatase crystallinity and reduce the residual carbonate species content, and subsequently enhance photoactivity. However, at temperatures above the optimal calcination temperature, the photoactivity of the sample decreases because the resulting larger-sized semiconductor particles promote fast recombination of the photogenerated holes and electrons [63]. Besides, it was found that the degradation reaction of CR under the photocatalysis of WNSTiO2 basically obeys first-order reaction kinetics. This kinetic model has been successfully applied to the results and straight lines are obtained (not shown here) when plotting ln C0/C = f(t), where C0 and C are the CR initial concentration and that at time t, respectively. According to the above kinetic model, the rate constant k values are calculated and summarized in Table 4. It was found that the reaction rate constant depends strongly on the calcination temperature. The WNSTiO2 calcined at 450 °C showed the highest kinetic rate constant of 0.089 min−1, more than three times than when calcined at 350 °C and 550 °C.
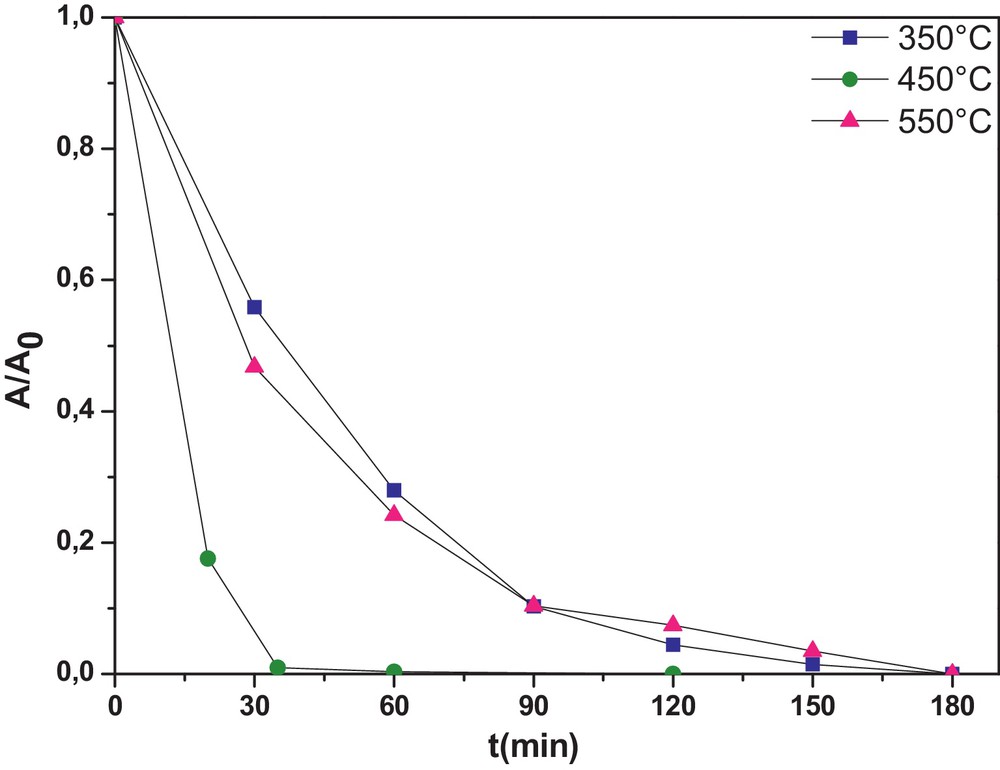
(Color online.) Photodegradation kinetics of CR for the prepared WNSTiO2 catalyst heat treated at different temperatures (initial CR concentration of = 50 mg·L−1 and photocatalyst concentration = 0.5 g·L−1).
Rate constants k of the photodegradation reaction of CR in the presence of WNSTiO2 heat treated at different temperatures.
| T (°C) | 350 | 450 | 550 |
| Kapp (min−1) | 0.026 | 0.089 | 0.022 |
| R2 | 0.98 | 0.99 | 0.98 |
3.2.2 Kinetics of TOC disappearance
In order to evaluate the complete degradation of organic compounds on the photocatalysis process, TOC concentration was usually analyzed as a function of irradiation time [64]. The effectiveness of the as-prepared photocatalysts in CR mineralization was evaluated and the kinetics is represented in Fig. 6. CR concentration decreased during the first 30 min and then became almost stable because of the degradation of CR into intermediate molecules during the photocatalysis. As the photocatalytic reaction proceeded, an increasing number of intermediates were produced and may have hindered the adsorption process, eventually leading to the termination of the degradation of CR on the surface of the co-doped TiO2 [65]. Meanwhile, the TOC rapidly decreased during the first 50 min of the reaction. The TOC removal rate was up to 72% for the tri-doped WNSTiO2 after 150 min, which indicates that 72% of CR was mineralized into inorganic ones such as SO42−, NO3−, CO2 and H2O. When the reaction time exceeded 90 min, the TOC remained nearly constant. The CR removal efficiency was higher than that of TOC, particularly during the first 10 min, because of the generation of intermediates that could significantly reduce CR concentration, but not the TOC. As shown in Fig. 6, tri-doped WNSTiO2 is more effective than non-doped TiO2, which gives only 35% of TOC after the same time (150 min).
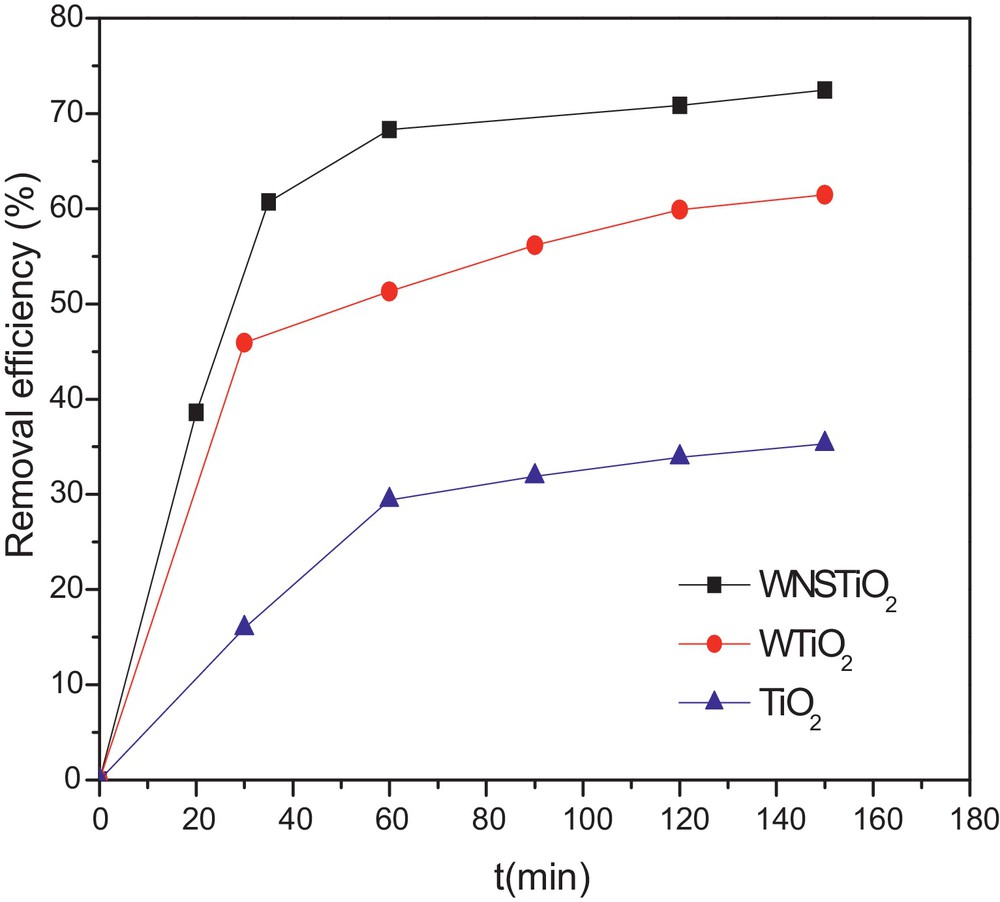
(Color online.) TOC removal kinetics for non-doped TiO2, WTiO2 and WNSTiO2 heat treated at 450 °C.
4 Conclusion
In this study, we successfully prepared new W–N–S-tri-doped TiO2 photocatalysts by a sol–gel method. The as-prepared powders were anatase in structure, and possessed a high specific surface area. When the TiO2 are doping with W and/or N and S atoms, the transformation from anatase to rutile was suppressed, it was found that doping improves the absorption properties of TiO2, and a smallest Eg observed for tri-doped WNSTiO2. Moreover, it is found that this improvement in the absorption properties of TiO2 enhances the photocatalytic activities of catalysts. Likewise, all doped TiO2 catalysts are more active than undoped TiO2 on the degradation of CR under visible light irradiation. Among all catalysts, tri-doped WNSTiO2 exhibited the highest photocatalytic activity, which gives a total conversion of CR within only 35 min. The enhanced visible light photocatalytic activity of the WNSTiO2 was mainly attributed to the small crystallite size, and to intense light absorption in the visible region.